Report19 pages
Blockchain Industry Report: August 2022
This analysis examines the state of the decentralized application (dapp) and blockchain industry during August 2022. The report highlights a period of significant volatility characterized by a 14.73% year-over-year decline in daily Unique Active Wallets (UAW), which reached a yearly low of 1.67 million. Despite the prevailing bear market and a series of high-profile security breaches—including the $190 million Nomad bridge exploit and the Solana wallet hack—the industry showed pockets of resilience, particularly within Ethereum scaling solutions and the gaming sector.
The Decentralized Finance (DeFi) sector experienced a 10.47% contraction in Total Value Locked (TVL), falling to $74.21 billion. This decline was exacerbated by U.S. sanctions against Tornado Cash, which sparked industry-wide debates regarding the true nature of Web3 decentralization. Conversely, Ethereum Layer-2 protocols like Optimism and Arbitrum saw growth in anticipation of "The Merge," with Optimism entering the top ten blockchains by TVL. While the gaming sector’s dominance of industry usage dipped slightly to 51%, it remained the primary driver of blockchain activity with over 847,000 daily UAW.
The NFT market faced downward pressure, with UAW dropping 16.7% to its lowest level since mid-2021. Trading volumes decreased by 5% month-over-month, influenced by the falling price of Ethereum and liquidation fears surrounding major collections like Bored Ape Yacht Club. However, the report notes structural evolution in the marketplace, specifically the rise of the Automated Market Maker (AMM) model via SudoSWAP and continued interest from traditional brands like Mars and Tiffany & Co. The findings suggest that while macroeconomic uncertainty and security vulnerabilities persist, the underlying infrastructure continues to mature through technical milestones and diversifying use cases.
- Daily Unique Active Wallets (UAW) across the blockchain industry fell 14.73% year-over-year to a yearly low of 1.67 million in August 2022.
- The gaming sector remains the primary driver of blockchain activity, accounting for 51% of industry usage with over 847,000 daily UAW.
- Total Value Locked (TVL) in Decentralized Finance (DeFi) contracted by 10.47% to $74.21 billion, impacted by market volatility and U.S. sanctions against Tornado Cash.
- NFT market activity declined significantly, with UAW dropping 16.7% to its lowest level since mid-2021 and trading volumes falling 5% month-over-month.
- Ethereum Layer-2 protocols, specifically Optimism and Arbitrum, experienced growth in anticipation of 'The Merge,' with Optimism securing a position in the top ten blockchains by TVL.
+1
DappRadarAug 2022

Report21 pages
Global Gaming Report H1 2022
The first half of 2022 marked the most active period in the history of the gaming industry, characterized by unprecedented consolidation and record-breaking investment levels. Total deal value exceeded $107 billion across 651 transactions, with mergers and acquisitions accounting for $95 billion of that total. This surge was primarily driven by massive strategic consolidations, most notably Microsoft’s acquisition of Activision Blizzard and Take-Two’s purchase of Zynga. While the public markets faced significant headwinds and valuation corrections, the private sector remained resilient, securing $7 billion in financing across nearly 500 deals.
Blockchain gaming and metaverse infrastructure emerged as the dominant catalysts for growth, representing over half of all financing transactions in the second quarter. This sector attracted more than $2.2 billion in funding, supported by the launch of multi-billion dollar funds from major venture capital firms. Despite the robust private activity, public gaming stocks largely underperformed, leading to a shift in investor focus toward high-quality, profitable targets. The absence of activity in the IPO and SPAC markets further underscored a transition toward private equity and strategic M&A as the primary vehicles for industry movement.
The industry landscape is currently defined by a divergence between aggressive private investment and cautious public market sentiment. As valuation multiples adjust to new economic realities, the sector is positioned for a second half of the year focused on opportunistic acquisitions and potential take-private transactions. The continued integration of Web3 technologies and the entry of massive capital reserves suggest that while the pace of "mega deals" may fluctuate, the fundamental restructuring of the gaming ecosystem toward a consolidated, blockchain-integrated future remains the central trajectory for the global market.
- The gaming industry saw record-breaking activity in H1 2022 with $107 billion in total deal value across 651 transactions, dominated by $95 billion in M&A activity.
- Strategic consolidation was driven by major acquisitions, most notably Microsoft’s purchase of Activision Blizzard and Take-Two’s acquisition of Zynga.
- Blockchain gaming and metaverse infrastructure became the primary growth catalysts, accounting for over 50% of all financing transactions in Q2 and attracting $2.2 billion in funding.
- While public markets faced valuation corrections and underperformed, the private sector remained resilient, securing $7 billion in financing across nearly 500 deals.
- The absence of IPO and SPAC activity signals a shift in industry movement toward private equity and strategic M&A as the primary vehicles for growth.
+3
Drake Star PartnersJul 2022
Report25 pages
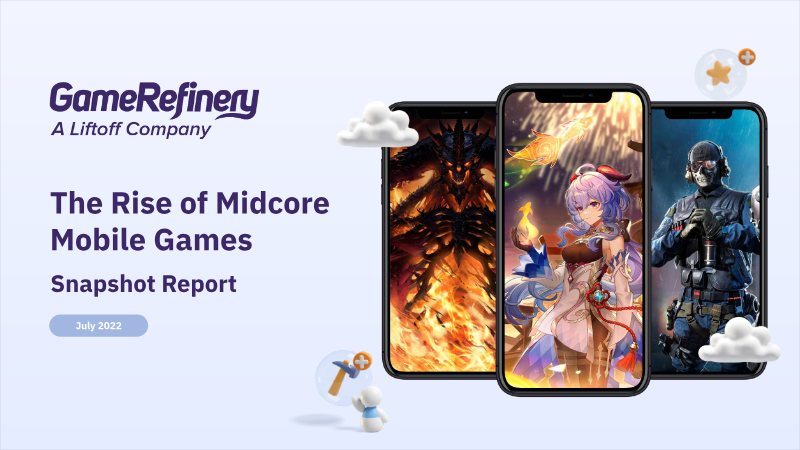
The Rise of Midcore Mobile Games Snapshot Report July 2022
The midcore mobile gaming sector is experiencing a significant shift as AAA developers and high-fidelity titles increasingly challenge the historical dominance of casual and hyper-casual games. Analysis of the US iOS market between Q1 2021 and Q1 2022 reveals that midcore was the only category to achieve revenue growth, currently accounting for 36.73% of total mobile game revenue. This trend is further evidenced by the fact that nine midcore titles released in the past year remain in the top 200 grossing chart, compared to only three casual titles.
The success of these games, such as Diablo Immortal, Genshin Impact, and Apex Legends Mobile, is attributed to three essential design pillars: sophisticated control systems, diversified monetization, and high content cadence. Top-performing midcore games differentiate themselves by offering precise, console-like manual controls and minimizing reliance on autoplay. Furthermore, they utilize complex monetization strategies; 75% of top-grossing midcore games employ Battle Pass systems, and over 63% feature five or more distinct gacha mechanics.
Live operations and player engagement are equally critical, with 100% of top-tier midcore games utilizing recurring live events. A notable 80% of these titles implement special event-specific currencies to manage game economies and drive temporary sinks. Additionally, a burgeoning trend involves publishers establishing external web stores to bypass standard app store commission fees. Data for this analysis was sourced from the GameRefinery SaaS platform, focusing on feature adoption and revenue performance within the US iOS market to identify the specific mechanics that separate market leaders from the broader competitive field.
- Midcore mobile games were the only category to achieve revenue growth in the US iOS market between Q1 2021 and Q1 2022, now capturing 36.73% of total mobile gaming revenue.
- New midcore titles are outperforming casual games in long-term retention, with nine midcore releases from the past year remaining in the top 200 grossing chart compared to only three casual titles.
- Top-performing midcore titles like Diablo Immortal, Genshin Impact, and Apex Legends Mobile prioritize console-like manual controls over autoplay mechanics to drive engagement.
- Monetization in the sector is highly complex, with 75% of top-grossing midcore games utilizing Battle Pass systems and over 63% incorporating five or more distinct gacha mechanics.
- Live operations are universal among top-tier midcore games, with 100% employing recurring live events and 80% using event-specific currencies to manage game economies.
+1
GameRefineryJul 2022
Report16 pages
DappRadar Blockchain Industry Report: Highlights of July 2022
The July 2022 DappRadar Blockchain Industry Report analyzes the state of the decentralized application ecosystem during a significant market downturn. The findings indicate that while the broader crypto industry remains trapped in a bear market influenced by the collapse of Terra and macroeconomic pressures like U.S. inflation, specific sectors—most notably blockchain gaming—demonstrate remarkable resilience. The report covers global trends across decentralized finance (DeFi), non-fungible tokens (NFTs), and gaming, utilizing data on Unique Active Wallets (UAW) and Total Value Locked (TVL) to measure health and engagement.
Data shows that dapp activity reached a yearly low in July with 1.68 million daily UAW, a 4% decrease from June. DeFi was the hardest-hit segment, with UAW dropping below 500,000 for the first time since early 2021. Despite this, DeFi TVL saw a 22% recovery during the month, rising to $82.3 billion, led by growth on Ethereum, BNB Chain, and Tron. The report also highlights the continued "crypto contagion" following the Celsius Network bankruptcy filing, which has increased calls for international regulatory frameworks like the EU’s MiCA.
The NFT market experienced a contraction, with monthly trading volume failing to reach $1 billion for the first time in over a year. Market dynamics are shifting as OpenSea’s dominance fell from 84% in May to 58.6% in July, facing increased competition from new entrants like the GameStop and Nickelodeon marketplaces. Conversely, the gaming sector emerged as a primary industry driver, accounting for nearly 60% of all dapp usage. With nearly 1 million daily UAW, blockchain games grew 8% month-over-month, suggesting that immersive mechanics and venture capital interest are insulating the segment from the prevailing "crypto winter."
- Blockchain gaming remains the industry's primary driver, accounting for nearly 60% of all dapp usage with 1 million daily Unique Active Wallets (UAW), an 8% month-over-month increase.
- DeFi activity hit a yearly low with UAW dropping below 500,000, though Total Value Locked (TVL) recovered 22% to reach $82.3 billion across Ethereum, BNB Chain, and Tron.
- The NFT market contracted significantly in July 2022, with monthly trading volume falling below $1 billion for the first time in over a year.
- OpenSea’s market dominance in the NFT space declined sharply from 84% in May to 58.6% in July due to competition from new entrants like GameStop and Nickelodeon.
- Overall dapp activity reached a yearly low of 1.68 million daily UAW in July, representing a 4% decrease from the previous month.
+2
DappRadarJul 2022
Report35 pages
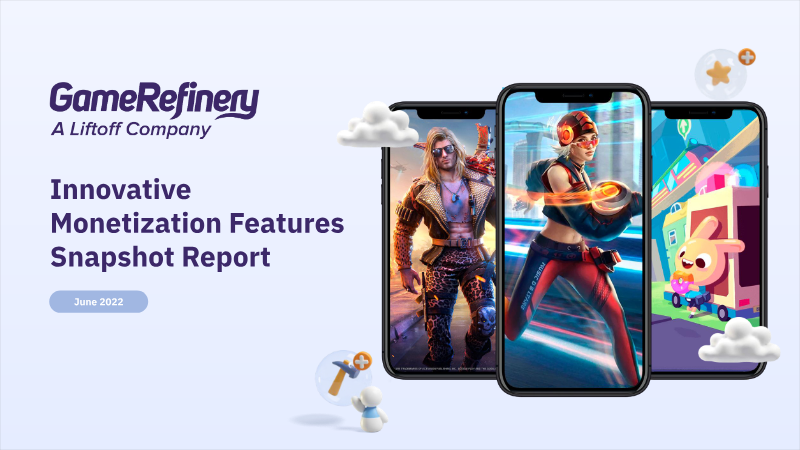
Innovative Monetization Features Snapshot Report June 2022
The mobile gaming landscape in mid-2022 is defined by the maturation and diversification of Battle Passes and gacha mechanics, which serve as the primary drivers for revenue in top-grossing titles. Battle Passes have evolved into sophisticated retention tools, appearing in 60% of high-performing games and incorporating social elements like guild-wide rewards and cooperative progression. Gacha mechanics remain even more pervasive, integrated into 93% of top titles in Japan and 75% of the top 20% grossing games in the United States. To maintain player trust and engagement, these systems increasingly feature transparency-focused innovations such as "pity" mechanics, player-selected prize pools, and social "joint-pull" events.
Monetization strategies are shifting away from direct gameplay boosters toward meta-layer engagement, focusing on narrative depth and cosmetic customization. Successful developers utilize psychological triggers like urgency and exclusivity through "Mystery Shops" and randomized discount events. For instance, mechanics that allow players to manipulate bundle contents or discount rates increase perceived agency, while quantity-based limitations create social pressure to purchase. These tactics are particularly effective when combined with hybrid monetization models, such as ad-supported tracks that convert non-paying users into the ecosystem.
Data indicates a clear correlation between sophisticated in-app purchase structures and market success. Progressive reward systems, which grant bonuses based on cumulative spending thresholds, are utilized by 23% of the top 20% grossing US iOS games, a significantly higher adoption rate than the 9% seen in lower-performing titles. By prioritizing player agency and social integration over simple transactional offers, developers are able to drive higher conversion rates and long-term player loyalty across diverse global markets and genres.
- Gacha mechanics are the dominant revenue driver, integrated into 93% of top-grossing Japanese titles and 75% of the top 20% of US-grossing games.
- Battle Passes have matured into primary retention tools, appearing in 60% of high-performing games and increasingly incorporating social and cooperative progression features.
- Progressive reward systems, which grant bonuses based on cumulative spending, are utilized by 23% of top-performing US iOS games compared to only 9% of lower-performing titles.
- Developers are shifting monetization focus toward meta-layer engagement, such as narrative depth and cosmetic customization, rather than direct gameplay boosters.
- To maintain player trust, developers are increasingly implementing transparency-focused gacha features, including 'pity' mechanics, player-selected prize pools, and joint-pull events.
+1
GameRefineryJun 2022
Report16 pages
The Highest-Grossing Mobile Games on iOS & Android: Q2 2022
The analysis set out to pinpoint the highest‑grossing mobile games of the second quarter of 2022, evaluating performance across Android and iOS markets. Data were drawn exclusively from Apptica’s Top Apps section, covering 37 countries between 1 April and 30 June 2022, and were segmented into casual, casino and mid‑core categories without supplementation from other analytics services.
Across both platforms, mid‑core titles generated the greatest revenue, with “Rise of Kingdoms” leading the chart at $179.5 million. Other top earners included “Candy Crush Saga” ($122 million), “Coin Master” ($99.2 million) and “Roblox” ($68.1 million). Casual games such as “Homescapes,” “Gardenscapes” and “Royal Match” each surpassed $20 million, while casino titles like “Slotomania” and “Jackpot Party” contributed between $10 million and $30 million. Organic traffic dominated most titles, typically accounting for 70‑95 % of user acquisition, with paid channels playing a smaller role.
Publisher analysis showed King as the highest‑grossing publisher with over $264 million from four leading titles, followed closely by Lilith Games ($254.6 million) and Playrix ($182.8 million). Playrix and Playtica each appeared in 16.2 % of top‑10 slots, while Supercell and King accounted for 10.8 % each, and Lilith Games 8.1 %. Studios headquartered in the United States held the most positions (17), with Finland, Singapore, Hong Kong and Israel also featuring prominently.
The study concludes that mid‑core games dominate revenue in Q2 2022, “Rise of Kingdoms” stands as the single biggest earner, and a relatively small group of publishers and studios capture the bulk of market share, underscoring the concentration of financial success within a few leading developers and regions.
- Mid-core titles dominated Q2 2022 revenue, led by 'Rise of Kingdoms' which generated $179.5 million.
- King was the highest-grossing publisher during the period, earning over $264 million across four leading titles.
- Top-earning games outside the mid-core category included 'Candy Crush Saga' ($122 million), 'Coin Master' ($99.2 million), and 'Roblox' ($68.1 million).
- Organic traffic accounted for 70–95% of user acquisition for the majority of top-performing titles, significantly outpacing paid marketing channels.
- Market success remains highly concentrated, with a small group of publishers like Lilith Games ($254.6 million) and Playrix ($182.8 million) capturing the bulk of revenue.
+2
AppticaJun 2022

Report15 pages
Mobile Advertising Benchmark Report Q2 2022
The analysis evaluates how the universal rollout of Apple’s AppTrackingTransparency framework reshaped media‑mix decisions for performance‑driven mobile‑app advertisers between the second quarters of 2021 and 2022. By comparing adoption rates and share‑of‑wallet across the principal acquisition channels, it demonstrates that Apple Search Ads (ASA) has moved from a peripheral position to a core component of the duopoly with Google, overtaking Facebook in advertiser adoption while narrowing the gap in spend allocation.
ASA’s adoption climbed to 94.8 %—a four‑point year‑over‑year increase—and its share‑of‑wallet rose five points to 15 %. In contrast, Facebook’s adoption slipped to 82.8 % (down three points) and its share‑of‑wallet fell four points to 28 %, though a modest rebound from Q4 2021 to Q2 2022 hints at recovery. Google remained stable, with roughly 95 % adoption and a 34 % share‑of‑wallet, reflecting its dominance on Android. Among lower‑tier channels, TikTok’s adoption fell to 43.2 % (down seven points) while its spend share held steady at 3 %; Snap’s adoption edged up to 32.7 % after a dip, yet its share‑of‑wallet halved to 2 %. Top‑five DSPs and ad networks grew to 27 % adoption, indicating a shift toward non‑self‑attributing solutions
- Apple Search Ads (ASA) has emerged as a core duopoly partner alongside Google, with advertiser adoption reaching 94.8% and share-of-wallet increasing by five points to 15%.
- Facebook’s market position declined between Q2 2021 and Q2 2022, with adoption dropping to 82.8% and share-of-wallet falling four points to 28%.
- Google remains the dominant advertising channel with 95% adoption and a 34% share-of-wallet, largely driven by its stability on the Android platform.
- Advertisers are increasingly diversifying into non-self-attributing solutions, as evidenced by the top-five DSPs and ad networks growing to 27% adoption.
- TikTok experienced a seven-point decline in adoption to 43.2%, while its share-of-wallet remained stagnant at 3%.
+1
AppsumerJun 2022
Report76 pages
Value Creation in the Metaverse: The Real Business of the Virtual World
The analysis evaluates the emerging economic significance of immersive digital environments, arguing that the metaverse will become a major engine of growth and societal transformation by 2030. It positions the metaverse as the next immersive iteration of the internet, driven by real‑time interactivity, user agency and eventual cross‑platform interoperability, and stresses that firms must define clear objectives, pilot test use cases, and build talent and technology capabilities now to capture value while managing ethical, security and workforce‑reskilling risks.
Investment activity surged in early 2022, with more than $120 billion flowing into the ecosystem across venture capital, private‑equity, mergers and acquisitions and corporate spend. The influx was amplified by Microsoft’s $69 billion acquisition of Activision, and corporate budgets such as Meta’s $10 billion annual allocation underscore the scale of commitment. Survey data from over 3,400 consumers and executives reveal that roughly 60 % of early‑adopter users are eager to shift daily activities—socializing, entertainment, shopping and travel—into virtual spaces, while 95 % of senior leaders anticipate a positive industry impact and project up to $5 trillion in economic value by 2030, comparable to the size of Japan’s economy.
Gaming remains the primary catalyst, supporting more than three billion users and a $200 billion market, and early adopters report higher profit margins. Across 19 industry sectors—including fashion and luxury, consumer‑packaged goods, retail, finance, utilities, manufacturing, education and government—XR‑enabled experiences are unlocking new revenue streams, with virtual‑goods sales already at roughly $40 billion and fashion brands leading digital‑identity initiatives. Executives rank cryptocurrency, artificial intelligence and AR/VR as the most important enabling technologies, yet cite uncertain ROI, lack of viable business models and insufficient managerial capability as chief barriers, while data‑privacy and cybersecurity concerns appear for over 85 % of leaders.
Geographically, the findings draw on global surveys conducted in 11 countries, encompassing 3,104 consumer respondents and 448 C‑level executives, and reflect investment trends and use‑case experimentation worldwide. The outlook projects that by 2030 more than half of live events and over 80 % of commerce could occur in virtual environments, with users spending up to six hours daily in immersive experiences. Realizing this potential will require coordinated governance, inclusive design and robust regulatory frameworks to
- Senior leaders project the metaverse will generate up to $5 trillion in economic value by 2030, a scale comparable to the economy of Japan.
- Investment in the metaverse ecosystem reached over $120 billion in early 2022, bolstered by major corporate commitments like Microsoft’s $69 billion acquisition of Activision and Meta’s $10 billion annual budget.
- Gaming serves as the primary market catalyst with three billion users and a $200 billion valuation, while virtual goods sales have already reached approximately $40 billion.
- Projections indicate that by 2030, more than 50% of live events and over 80% of commerce could shift to virtual environments, with users spending up to six hours daily in immersive experiences.
- While 95% of senior leaders anticipate a positive industry impact, over 85% express significant concerns regarding data privacy and cybersecurity.
+1
McKinsey & CompanyJun 2022
Report35 pages
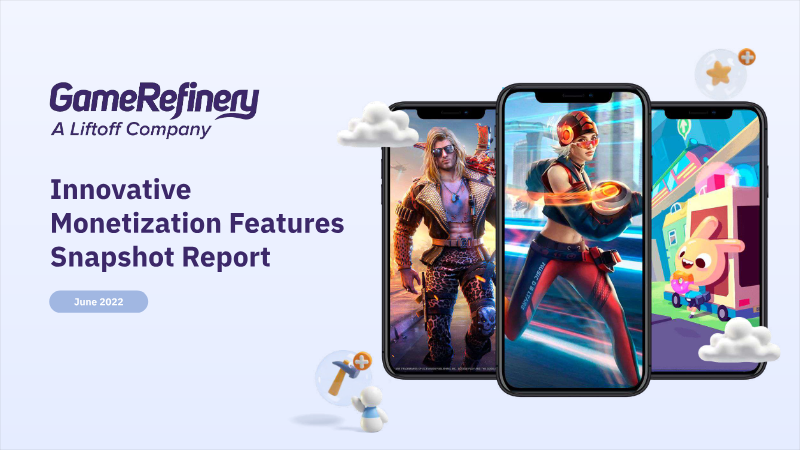
Innovative Monetization Features Snapshot Report
Modern mobile game monetization is increasingly defined by the integration of sophisticated Battle Pass systems and gacha mechanics, which serve as the primary drivers for the industry's highest-grossing titles. Gacha mechanics are nearly universal among top-tier games, appearing in 93% of the top 20% grossing titles, while Battle Passes are utilized by 60% of this same demographic. These tools have evolved from simple transactional models into complex systems that leverage social cooperation, urgency, and psychological progression. Innovations such as auto-renewing subscriptions, social gifting within guilds, and "pity" systems for gacha pools have become standard practices to ensure transparency and maintain long-term player engagement without compromising core gameplay balance.
The geographic focus remains centered on the United States mobile market, where 75% of top-grossing games now employ gacha mechanics. A significant shift is occurring in the nature of in-app purchases, moving away from direct gameplay boosters toward meta-layer content such as narrative elements and collectibles. Furthermore, progressive reward systems—which provide escalating gifts based on cumulative spending—have seen a steady two-year increase in adoption. These systems are highly correlated with financial success, as they are nearly three times more likely to be found in top-performing iOS games than in lower-grossing titles.
Ultimately, the most successful monetization strategies rely on emotional triggers and social integration rather than isolated transactions. Features like randomized "Mystery Shops" and quantity-limited community offers create a sense of scarcity and collective participation. Developers who find success in this landscape are those who look across diverse genres to adapt innovative features like piggy bank integrations and co-op progression tracks. By focusing on these sophisticated meta-layer incentives, studios can drive both retention and revenue while fostering a more committed player base.
- Gacha mechanics are the industry standard, appearing in 93% of the top 20% grossing mobile titles, while Battle Passes are utilized by 60% of that same demographic.
- In the U.S. mobile market, 75% of top-grossing games now incorporate gacha mechanics.
- Progressive reward systems, which offer escalating gifts based on cumulative spending, are nearly three times more likely to be found in top-performing iOS games than in lower-grossing titles.
- Monetization strategies are shifting away from direct gameplay boosters toward meta-layer content, such as narrative elements and collectibles.
- Industry-standard retention tools now include auto-renewing subscriptions, social gifting within guilds, and 'pity' systems for gacha pools.
+1
GameRefineryJun 2022
Report16 pages
The Highest-Grossing Mobile Games on iOS & Android: Q2 2022 Report & Infographics
This analysis examines the highest-grossing mobile games across iOS and Android platforms during the second quarter of 2022. Utilizing data from the Apptica platform across 37 countries, the study focuses on three primary industry segments: casual, casino, and mid-core games. The central thesis highlights the continued dominance of established franchises and the significant revenue-generating power of mid-core titles, which emerged as the highest-grossing genre during this period.
Key findings indicate that Rise of Kingdoms by Lilith Games was the top-earning individual title, generating over $179.5 million on iOS alone. On the Android platform, Candy Crush Saga led with revenues exceeding $122 million. When aggregating performance across multiple top-charting titles, King emerged as the highest-grossing publisher with over $264 million in revenue, followed closely by Lilith Games at $254.6 million and Playrix at $182.8 million. The data also reveals a high reliance on organic traffic for top-tier games; mid-core titles on iOS averaged 91% organic traffic, while casual games on Android maintained a lower average of 70%.
Geographically, the United States remains the primary hub for mobile game development, hosting 28.8% of the top-performing publishers' headquarters. Ireland and Israel follow as significant secondary hubs. In terms of market presence, Playrix and Playtika were the most frequent leaders in the charts, each accounting for 16.2% of the games appearing in the top-10 rankings. The analysis concludes that while the market is competitive, a small group of global publishers and established mid-core titles continue to capture the majority of mobile gaming revenue.
- Mid-core games emerged as the highest-grossing genre in Q2 2022, underscoring the sector's dominance in mobile revenue generation.
- King was the top-earning publisher for the quarter with over $264 million in aggregate revenue, followed by Lilith Games at $254.6 million and Playrix at $182.8 million.
- Rise of Kingdoms by Lilith Games led iOS revenue with over $179.5 million, while Candy Crush Saga topped Android charts with more than $122 million.
- Top-tier mobile games rely heavily on organic traffic, with mid-core titles on iOS averaging 91% organic acquisition compared to 70% for casual games on Android.
- The United States is the primary hub for mobile game development, housing 28.8% of the top-performing publishers' headquarters.
+2
AppticaJun 2022

Report32 pages
Gaming Spotlight: 2022 Review
Mobile gaming has emerged as the primary engine of the global games market, projected to reach $136 billion in 2022 and accounting for over 60% of the industry's total $222 billion valuation. This segment is expanding 3.3 times faster than the home console market, driven largely by the Asia-Pacific region and the sustained popularity of core titles such as Genshin Impact and Roblox. While macroeconomic instability and geopolitical conflict have caused localized spending declines in Eastern Europe, the broader global trend points toward a more inclusive player base. Female gamers and Gen Z cohorts are increasingly influential, serving as primary drivers of monetization and shifting the demographic focus of the industry.
The monetization landscape is undergoing a significant transformation toward hybrid models, with 42% of top-grossing U.S. games now combining in-app purchases with advertising. Although global audiences generally accept advertisements in exchange for free content, privacy concerns regarding individual tracking have intensified. In a post-IDFA environment, success depends on leveraging contextual third-party data rather than granular user tracking. Player sentiment varies significantly by format; rewarded video and playable ads enjoy the highest levels of acceptance, while standard video ads remain divisive, particularly among the high-growth female and Gen Z demographics.
Strategic intelligence for this evolving market relies on extensive global research infrastructure, utilizing data from over 1,100 analysts across 50 countries. By surveying more than 350,000 end users annually, market analysts provide the necessary framework for developers, publishers, and hardware manufacturers to navigate shifting consumer behaviors and technological transitions. This comprehensive oversight ensures that stakeholders can adapt to the rapid pace of innovation and the diversifying needs of the global gaming community.
- Mobile gaming is the dominant industry force, projected to reach $136 billion in 2022 and accounting for over 60% of the total $222 billion global market valuation.
- The mobile segment is expanding 3.3 times faster than the home console market, bolstered by the sustained popularity of core titles like Genshin Impact and Roblox.
- Hybrid monetization is becoming standard, with 42% of top-grossing U.S. games now combining in-app purchases with advertising.
- In a post-IDFA environment, developers must shift from granular user tracking to contextual third-party data to navigate intensified privacy concerns.
- Female gamers and Gen Z cohorts are the primary drivers of industry monetization and are increasingly shaping the demographic focus of the market.
+1
data.ai & IDCMay 2022
Report48 pages
Mobile Gaming Market Outlook 2022
The global mobile gaming landscape has entered a period of stabilization following pandemic-era surges, with quarterly downloads maintaining a steady baseline of 14 billion. Although total revenue experienced a 6% year-over-year decline to $21.2 billion in early 2022, the market remains significantly larger than its pre-pandemic state. Casual games continue to lead in volume, representing 80% of all downloads, yet Mid-Core titles remain the primary economic engine, generating 60% of total player spending. While the United States maintains its position as the leading consumer market, the Asia-Pacific region exerts increasing influence, evidenced by Taiwan’s rise to the fifth-largest global market and the region's dominance in high-monetization genres like MMORPGs and Card Battlers.
Strategic advertising and intellectual property integration have become essential for navigating this competitive environment. Strategy and RPG titles are increasingly prioritizing YouTube for share of voice, while the acquisition of MoPub by AppLovin has shifted the advertising landscape for strategy games. Success in the rapidly growing Card Battler sub-genre, which earns 62% of its revenue from the APAC region, is largely driven by high-performing titles like Yu-Gi-Oh! Master Duel and the effective use of Live Ops and Season Passes. Furthermore, cross-media synergies, such as the impact of the Netflix series Arcane on game downloads, demonstrate the power of multimedia IP in driving user acquisition.
The market outlook suggests a temporary correction phase with a projected return to growth by 2023. While Asian markets currently account for 80% of MMORPG revenue, Western interest is growing, as seen with the successful U.S. launch of Diablo Immortal. Similarly, the Real-Time Strategy sector is seeing a geographic shift, with China overtaking the U.S. as the top market for the sub-genre. Future expansion across these segments will likely depend on localized IP collaborations and sophisticated user acquisition strategies tailored to specific regional preferences.
- The mobile gaming market is in a stabilization phase, with quarterly downloads holding at 14 billion despite a 6% year-over-year revenue decline to $21.2 billion in early 2022.
- Casual games dominate volume at 80% of all downloads, while Mid-Core titles remain the primary revenue driver, accounting for 60% of total player spending.
- The Asia-Pacific region is a critical economic force, generating 80% of global MMORPG revenue and 62% of Card Battler revenue.
- Success in high-monetization genres like Card Battlers is increasingly driven by Live Ops, Season Passes, and high-performing titles such as Yu-Gi-Oh! Master Duel.
- Cross-media IP integration, exemplified by the impact of the Netflix series Arcane on user acquisition, has become a vital strategy for driving game downloads.
+2
Sensor TowerMay 2022
Report75 pages
Store Intelligence Data Digest: Q1 2022
Global app downloads reached 36.9 billion in the first quarter of 2022, representing a 1.4% year-over-year increase. This period marked a significant milestone for TikTok, which surpassed 3.5 billion all-time downloads to become the top global app, while Meta reclaimed its position as the leading publisher for the first time in two years. Although Google Play growth began to flatten as pandemic-era surges subsided, the mobile gaming sector showed signs of recovery with total downloads reaching 14.34 billion across both major storefronts. India remained the largest market for total downloads, while Vietnam and Pakistan emerged as high-growth regions with year-over-year increases exceeding 20%.
Market dynamics were heavily influenced by viral trends and macroeconomic shifts. The "Wordle" phenomenon revitalized the word game sub-genre, driving a 74% quarter-over-quarter increase in U.S. downloads and prompting major publishers like AppLovin and Rovio to acquire similar titles. Simultaneously, high inflation and rising fuel costs triggered a 1,500% spike in demand for gas-tracking apps like GasBuddy in the United States. In the entertainment sector, the U.S. video streaming market continued to fragment; the market share of the top three apps plummeted from 80% in 2019 to just 37% as newer platforms like HBO Max and Disney+ gained traction through major content releases and live sports.
The competitive landscape remains dominated by established giants, yet regional variations persist. While Meta and Google maintained a stronghold in Western markets, shopping apps like Shopee saw massive adoption in Asia, where Google Play shopping installs surged by 63%. In the gaming sector, Garena Free Fire maintained its global lead, particularly in Asia, while Subway Surfers experienced a notable 45% growth resurgence in Europe. These findings illustrate a maturing global app economy where growth is increasingly driven by specific regional demands, viral social trends, and shifting consumer priorities in response to economic pressures.
- Global app downloads reached 36.9 billion in Q1 2022, a 1.4% year-over-year increase, with mobile gaming accounting for 14.34 billion of those installs.
- The U.S. video streaming market has significantly fragmented, with the top three apps' market share dropping from 80% in 2019 to 37% in Q1 2022 due to the rise of competitors like Disney+ and HBO Max.
- TikTok surpassed 3.5 billion all-time downloads to become the top global app, while Meta reclaimed its position as the leading global publisher for the first time in two years.
- Viral trends and economic pressures drove specific market spikes, including a 74% quarter-over-quarter increase in U.S. word game downloads and a 1,500% surge in demand for gas-tracking apps.
- India remains the largest market for total downloads, while Vietnam and Pakistan emerged as high-growth regions with year-over-year increases exceeding 20%.
+1
Sensor TowerApr 2022
Report33 pages
Casual Gaming Trends Snapshot Report March 2022
This analysis examines the evolving landscape of the casual mobile gaming market as of March 2022, focusing primarily on the United States iOS market. The central thesis posits that the casual sector has become increasingly competitive, forcing developers to move beyond simple core gameplay by integrating sophisticated meta-elements, hybrid mechanics, and social features to maintain chart positions and drive player retention.
Key findings indicate a massive shift in the Match3 genre, where the presence of meta-elements in top-100 grossing games rose from under 10% six years ago to 70% by early 2022. Renovation and construction mechanics have emerged as the dominant trend; notably, every top-100 grossing casual game released in the two years preceding the report utilizes renovation elements. Construction features specifically appeared in 49% of top Match3 games, a significant increase from 7% in 2016. These elements are prized for providing visual progression and satisfying psychological "completionist" motivations without disrupting core game balance.
The scope of the research covers the casual genre hierarchy—including subgenres like Match3, Solitaire, and Time Management—with a specific focus on top-grossing titles on the US iOS platform. Data points highlight the stability of the top three casual games between Q4 2020 and Q4 2021, while noting that newer titles like Royal Match and Project Makeover successfully captured market share by leveraging episodic design and deep customization.
Methodologically, the insights are derived from the GameRefinery SaaS platform, utilizing a proprietary three-layered taxonomy (Category, Genre, Subgenre) developed with industry experts. The analysis concludes that successful casual games are increasingly adopting midcore-inspired features, such as social hangouts, competitive tournaments, and diverse minigames, to broaden their motivational appeal and create new monetization sinks in a post-IDFA marketing environment.
- By early 2022, 70% of top-100 grossing Match3 games incorporated meta-elements, a massive increase from less than 10% six years prior.
- Renovation and construction mechanics have become industry standard, appearing in every top-100 grossing casual game released between 2020 and 2022.
- The integration of construction features in top Match3 games surged to 49% in 2022, up from just 7% in 2016.
- Newer titles like Royal Match and Project Makeover successfully disrupted the market by utilizing episodic design and deep customization to challenge established top-grossing games.
- Casual games are increasingly adopting midcore features—such as social hangouts, competitive tournaments, and minigames—to drive retention and monetization in a post-IDFA environment.
+2
GameRefineryMar 2022
Report33 pages
Casual Gaming Trends Snapshot Report
The casual gaming landscape is undergoing a significant transformation driven by the rise of hybrid designs that blend core puzzle mechanics with complex meta-layers. This shift is most evident in the Match3 genre, where 70% of the top-grossing titles now incorporate elements such as renovation, collectibles, or RPG mechanics to enhance long-term engagement and monetization. Data indicates a dramatic pivot in player preferences over the last six years, with construction mechanics in top Match3 games surging from 7% to 49%. Currently, every top-100 casual game released within the past two years utilizes renovation elements, highlighting their role in providing visual progression and psychological satisfaction.
Beyond permanent gameplay features, developers are increasingly leveraging renovation and construction layers within limited-time events across diverse genres, including card games and puzzle RPGs. This strategy allows studios to introduce new monetization sinks and broaden motivational appeal without disrupting core gameplay balance. Furthermore, the industry is moving toward a model of digital togetherness by integrating social and competitive features into traditionally solitary experiences. Features such as guilds, chat functions, and communal hangout areas are becoming standard tools for improving player retention and fostering cooperative environments.
Competitive elements have emerged as a primary differentiator between market leaders and lower-performing titles. Top-tier games like Candy Crush Saga are successfully attracting players motivated by rivalry through the integration of leaderboards and head-to-head challenges. While the highest-grossing titles in the casual segment have aggressively adopted these social and competitive frameworks to distinguish themselves in a saturated market, underperforming titles have been slower to adapt. This evolution reflects a broader industry trend toward multifaceted gaming experiences that prioritize social connectivity and diverse motivational drivers to maintain a dominant market position.
- Every top-100 casual game released in the last two years now incorporates renovation elements to drive visual progression and player satisfaction.
- The integration of construction mechanics in top Match3 games has surged from 7% to 49% over the past six years.
- 70% of top-grossing Match3 titles currently utilize hybrid designs that blend core puzzle mechanics with complex meta-layers like RPG elements or collectibles.
- Developers are increasingly deploying renovation and construction layers within limited-time events across genres like card games and puzzle RPGs to create new monetization opportunities.
- Competitive features such as leaderboards and head-to-head challenges, exemplified by Candy Crush Saga, are now primary differentiators between market leaders and lower-performing titles.
+1
GameRefineryMar 2022
Report23 pages
Video Game Streaming Trends Report: 2022 First Quarter
The primary aim of the analysis is to map the state of global video‑game streaming in the first quarter of 2022, linking audience behavior to platform performance, game releases, and advertising potential. While overall viewership growth has begun to temper—total hours watched fell 6 % from the previous quarter—it remains 66 % higher than the same period in 2020 and 140 % above Q1 2019, underscoring the sector’s continued expansion despite pandemic stabilization.
Twitch retains overwhelming dominance, delivering roughly three‑quarters of all streamed hours and accounting for 80 % of esports viewership, which itself showed only a 0.3 % dip year‑over‑year but rose 63 % since 2019. Emerging competitors such as AfreecaTV, Trovo and NaverTV posted double‑digit growth, yet YouTube and Facebook together contributed less than 10 % of total hours. Core viewers—just 7.8 % of the audience—generated two‑thirds of watch time, averaging 276 minutes per day and proving 24 times more receptive to repeated advertising than casual viewers, who average 12 minutes daily.
Game‑level insights reveal that legacy titles like Grand Theft Auto V and League of Legends remain top‑draws, while new releases such as Elden Ring and Lost Ark captured strong core‑viewer engagement, each accounting for over half of their streaming hours. Mobile game streaming is heavily core‑oriented, with 78 % of hours coming from core fans despite casual dominance in downloads. Content creators mirror these patterns: xQcOW led live streams with 62.8 million hours, while VOD‑first creators like Rubius generated twice as many video‑on‑demand views per concurrent viewer, highlighting divergent monetization pathways.
- Twitch maintains a dominant market position, accounting for approximately 75% of all streamed hours and 80% of esports viewership.
- Total hours watched in Q1 2022 declined 6% from the previous quarter, yet remains 66% higher than Q1 2020 and 140% above Q1 2019 levels.
- A small segment of core viewers, representing only 7.8% of the total audience, generates two-thirds of all watch time and is 24 times more receptive to repeated advertising than casual viewers.
- While YouTube and Facebook combined contribute less than 10% of total streaming hours, emerging platforms like AfreecaTV, Trovo, and NaverTV are experiencing double-digit growth.
- New releases such as Elden Ring and Lost Ark successfully captured core-viewer engagement, with both titles deriving over 50% of their streaming hours from this demographic.
+1
Stream HatchetMar 2022
Report42 pages
The State of Mobile Game and App Markets: H1 2022
The mobile app and gaming landscape underwent a significant strategic pivot during the first half of 2022, characterized by a transition from high-volume advertising to a quality-focused, data-driven methodology. Faced with rising user acquisition costs and the restrictive post-ATT environment, marketers reduced the total volume of mobile game creatives by nearly 30% year-over-year. This contraction reflects a broader industry shift toward precise traffic optimization, where performance metrics like Cost Per Purchase and In-App Purchase Return on Ad Spend have superseded raw install volume as the primary indicators of success.
Geographically, the United States remains the dominant market, commanding the highest share of traffic and the most expensive advertising costs. CPMs surged significantly during this period, rising 18% for mobile games and 64% for non-gaming applications. In response to these economic headwinds and privacy-related tracking limitations, advertisers have increasingly pivoted toward the Android ecosystem, which now hosts approximately 70% of mobile game creatives. Simultaneously, growth is being sought in emerging Tier-2 and Tier-3 markets to offset the saturation and high costs found in traditional Western strongholds.
To maintain performance, publishers are diversifying their acquisition channels, moving beyond traditional social media giants to include incentive-based traffic sources and search-driven discovery. App Store Optimization and Apple Search Ads have become critical components of visibility strategies, while the adoption of predictive analytics and first-party data collection allows developers to navigate the loss of IDFA-based targeting. By prioritizing user-generated content styles and optimizing opt-in prompts, which have reached success rates as high as 51% in certain hyper-casual segments, the industry is successfully recalibrating its approach to sustain long-term growth despite a challenging macroeconomic climate.
- Marketers reduced mobile game creative volume by nearly 30% year-over-year in H1 2022, shifting focus from raw install volume to performance metrics like Cost Per Purchase and In-App Purchase Return on Ad Spend.
- Advertising costs rose significantly, with CPMs increasing 18% for mobile games and 64% for non-gaming applications.
- Advertisers are increasingly prioritizing the Android ecosystem, which now accounts for approximately 70% of all mobile game creatives.
- To mitigate high costs and market saturation in the U.S., publishers are expanding into emerging Tier-2 and Tier-3 geographic markets.
- Publishers are diversifying beyond traditional social media channels, placing greater strategic emphasis on App Store Optimization, Apple Search Ads, and search-driven discovery.
+3
AdQuantumJan 2022
Report51 pages
Global Esports & Live Streaming Market Report 2022
The global esports and live streaming industry is undergoing a period of robust expansion, with total esports revenue projected to reach $1.38 billion in 2022 and an audience base of 532 million people. This growth trajectory is expected to continue, with market valuations potentially hitting $1.86 billion by 2025. While sponsorship remains the dominant revenue stream, accounting for nearly 60 percent of total earnings, the industry is actively diversifying its financial models. Organizations are increasingly pivoting toward direct-to-fan strategies, including digital merchandise, loyalty programs, and educational initiatives, to mitigate risk and transition toward sustainable, lifestyle-oriented business models.
The live streaming sector serves as a critical pillar of this ecosystem, with its audience projected to grow to 1.41 billion by 2025. Market dominance is currently split between major platforms like Twitch, YouTube Gaming, and Facebook Gaming, each leveraging distinct regional strengths. Twitch maintains a stronghold in Western PC and console markets, whereas YouTube and Facebook are capitalizing on the rapid proliferation of mobile gaming in emerging economies. These platforms are further evolving by integrating non-gaming content and interactive features to enhance user retention and broaden monetization opportunities.
Despite the positive outlook, the industry must navigate potential volatility stemming from shifting media consumption habits, evolving publisher investment strategies, and the lingering economic effects of the pandemic. Nevertheless, the sector remains highly attractive to stakeholders due to its core demographic of young, high-income professionals. As the market matures, the integration of co-streaming and the expansion into emerging regions—supported by localized platforms—will be essential for maintaining long-term growth and fostering deeper engagement with a global, digitally native audience.
- Global esports revenue is projected to reach $1.38 billion in 2022, with a total audience of 532 million, and is expected to grow to $1.86 billion by 2025.
- Sponsorship currently accounts for nearly 60% of total esports revenue, though organizations are shifting toward direct-to-fan models like digital merchandise and loyalty programs to improve financial sustainability.
- The live streaming audience is forecast to reach 1.41 billion by 2025, driven by the integration of non-gaming content and interactive features to boost user retention.
- Market dominance in live streaming is split between Twitch, which leads in Western PC and console markets, and YouTube Gaming and Facebook Gaming, which are capturing growth in mobile-first emerging economies.
- The industry remains highly attractive to stakeholders due to its core demographic of young, high-income professionals.
+3
NewzooJan 2022
Report18 pages
Consumer Insights: Games and Esports 2022
The Consumer Insights: Games and Esports 2022 report provides a comprehensive analysis of global gaming behaviors, motivations, and market engagement. The primary purpose of the research is to equip game developers, publishers, and industry stakeholders with actionable data to benchmark titles, understand player demographics, and identify growth opportunities across 36 diverse international markets. By examining over 100 key performance indicators, the analysis offers a granular view of how players interact with PC, console, and mobile platforms.
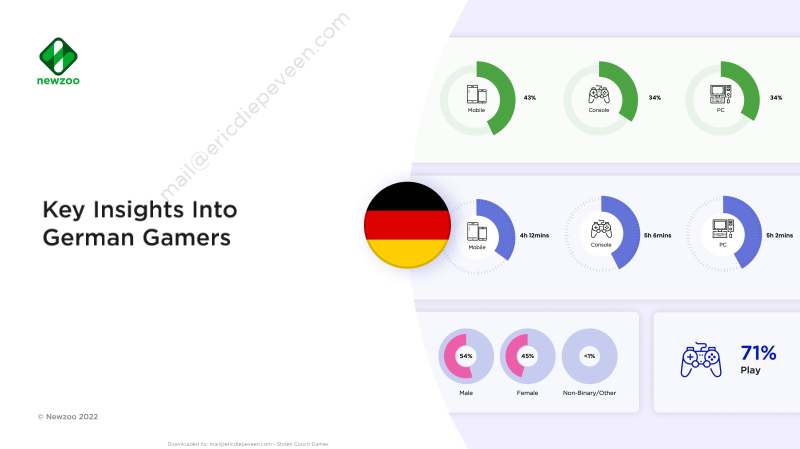
The research is underpinned by a robust methodology, drawing on survey data from over 75,000 consumers worldwide. The findings highlight distinct engagement patterns, such as the prevalence of specific gaming personas—notably Time Fillers and Mainstream Gamers—and the interplay between playing and viewing habits. For instance, data from the German market indicates that while playing remains the dominant activity, a significant portion of the population also engages with gaming video content and esports. Furthermore, the report identifies key drivers for consumer spending, noting that price sensitivity, the desire for exclusive content, and social connectivity are primary motivators for financial investment in games.
Covering a broad geographic scope that includes North America, Europe, Latin America, the Middle East, and the Asia-Pacific region, the report serves as a strategic tool for navigating the complex global gaming landscape. By synthesizing metrics such as monthly active users, daily active users, and lifetime player value, the analysis facilitates a deeper understanding of the motivations driving player behavior. Ultimately, the findings emphasize that a nuanced approach to audience segmentation and platform-specific engagement is essential for companies seeking to reach and retain diverse gaming populations in an increasingly competitive entertainment market.
- The research is based on a global dataset of over 75,000 consumers across 36 international markets, covering North America, Europe, Latin America, the Middle East, and the Asia-Pacific region.
- Consumer spending is primarily driven by three factors: price sensitivity, the desire for exclusive content, and the need for social connectivity.
- Gaming engagement is categorized into distinct personas, with 'Time Fillers' and 'Mainstream Gamers' identified as the most prevalent segments.
- Player behavior analysis utilizes over 100 key performance indicators, including monthly active users (MAU), daily active users (DAU), and lifetime player value (LPV).
- Engagement patterns in markets like Germany demonstrate that gaming video content and esports are significant activities that complement traditional gameplay.
+5
NewzooJan 2022
Report30 pages
Games, Esports, Live Streaming, Cloud and the Metaverse: 2022 Trends to Watch
The global gaming industry is currently undergoing a structural transformation characterized by the integration of emerging technologies and a pivot toward cross-platform accessibility. Central to this evolution is the expansion of cloud gaming, which serves as a critical bridge to overcome hardware constraints, allowing publishers to reach broader audiences on mobile devices and legacy consoles. Simultaneously, the metaverse is maturing into a robust commercial ecosystem, fueled by significant venture capital investment, the proliferation of virtual real estate, and the integration of digital fashion. These developments signal a broader industry shift toward enhanced creator-viewer interactivity and the adoption of Web3.0 business models.
Monetization strategies are diversifying as companies experiment with blockchain-based player trading and fan engagement tools, despite notable consumer resistance toward non-fungible tokens. This period is also defined by a surge in high-quality cross-media intellectual property adaptations and a crowded release calendar, which intensifies competition for consumer attention. Furthermore, regulatory and consumer pressures are forcing a transition toward more open app store ecosystems, challenging traditional distribution gatekeepers.
Within the esports sector, organizations are actively diversifying revenue streams by prioritizing mobile-first titles and leveraging co-streaming to maximize viewership reach. These trends, observed throughout 2022, reflect a strategic effort to sustain growth across global markets. By synthesizing market intelligence and tracking key performance metrics, the industry continues to navigate the complexities of digital transformation, balancing the pursuit of innovative monetization with the necessity of maintaining user trust in an increasingly interconnected virtual landscape.
- Cloud gaming is driving industry growth by bypassing hardware limitations, enabling publishers to deliver high-end experiences to mobile devices and legacy consoles.
- The metaverse is evolving into a commercial ecosystem supported by significant venture capital, virtual real estate markets, and digital fashion integration.
- Monetization models are shifting toward Web3.0 and blockchain-based player trading, despite ongoing consumer resistance to non-fungible tokens.
- Regulatory and consumer pressure is forcing a transition away from traditional app store gatekeepers toward more open distribution ecosystems.
- Esports organizations are prioritizing mobile-first titles and utilizing co-streaming strategies to diversify revenue and expand global viewership.
+5
NewzooJan 2022