Skip to main content
Game Industry
Library
Library
Search
Ask AI
News
Connect your AI
Browse
The Catch Up
Topics
Collections
Writers
Help
Subscribe
Game Industry
Library
Library
Search
Ask AI
Saved
Library
790 reports matching your filters
All Types
Reports
Articles
Presentations
Whitepapers
Financial
Legal
Other
Search
Global
Market Analysis
Mobile
Monetization
Marketing
User Acquisition
PC
Game Publishing
Investment
Game Development
Player Behavior
Console
Advertising
Steam
Game Design
AI
Mergers & Acquisitions
Streaming
Clear
Filters
1
Global
Recently added
Newest first
Oldest first
Title A–Z
Title Z–A
Report
46 pages
Global State of Game Publishing & Marketing 2025 Industry Report
The global game publishing market is projected to grow from $117.4 billion in 2025 to $150.7 billion by 2030, driven by cross-platform development and the democratization of publishing tools.
Digital sales now account for 95% of total revenue, signaling a near-total transition away from traditional retail channels.
Subscription-based revenue models are forecasted to grow at a 12.2% CAGR, reaching $21.6 billion by 2030, while the premium one-time purchase market experiences only marginal growth.
Market Analysis
Marketing
Global
+1
Epic Games
Jan 2025
Report
22 pages
Creative Analytics
Video-centric content now dominates the mobile advertising landscape, accounting for 80% of all creatives in Q3 2023, up from 69% in the previous quarter.
Total mobile advertisers declined 7% year-over-year to 54,900, though the gaming, entertainment, and lifestyle verticals bucked this trend with continued growth.
Android remains the primary platform for ad distribution, hosting 68% of the 15.2 million total creatives compared to 32% on iOS.
Marketing
Advertising
In-Game Advertising
+2
Apptica
Jan 2025
Report
16 pages
Fighting Game Live Streaming Report
Street Fighter 6 dominates the fighting game genre with 204 million hours watched, accounting for 71% of total viewership and averaging 40 million hours per quarter since its launch.
Japanese streamers and VTubers lead the market, with fps_shaka and Kuzuha generating 6.4 million and 6.3 million hours watched respectively.
YouTube Gaming has captured over 25% of total quarterly fighting game viewership, largely driven by the popularity of Japanese content creators.
Streaming
Fighting
Global
Stream Hatchet
Jan 2025
Report
29 pages
Game Developer Survey 2025
Unity remains the dominant engine, but studios are increasingly planning to move away from the platform following a 25% enterprise license price hike and the introduction of a $2,200 per-seat fee for pro users.
Open-source engines like Godot and Defold are gaining significant traction as alternatives to traditional engines, while ProBuilder and Houdini have become the fastest-growing 3D modeling tools for studios with fewer than 100 employees.
Mixpanel has seen a 120% surge in interest among developers, driven by a new startup-focused pricing tier that offers over $150,000 in value.
Market Analysis
Game Engines
Game Development
+2
Konvoy
Jan 2025
Report
36 pages
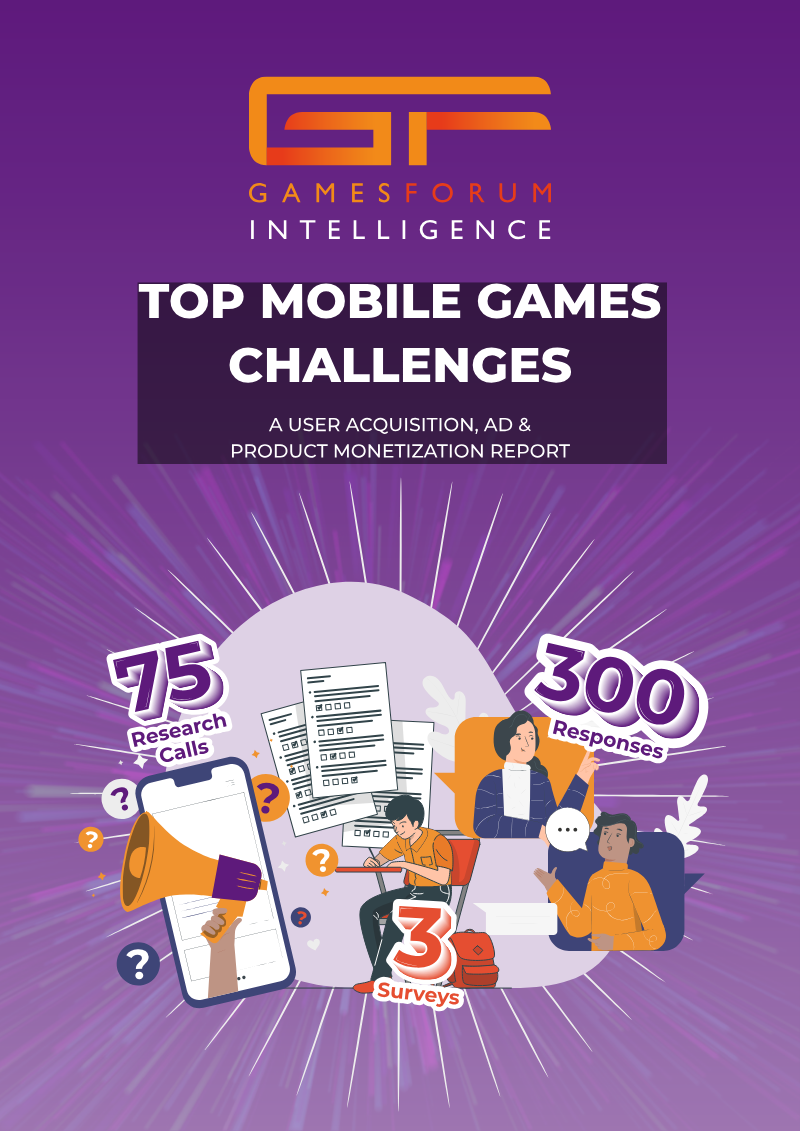
Intelligence Top Mobile Games Challenges: A User Acquisition, Ad & Product Monetization Report
Market saturation and rising costs per installment are the primary obstacles for 41% of user acquisition managers, driven by intense competition from non-gaming entities.
Product managers are prioritizing LiveOps as their most significant challenge, with nearly 30% ranking it above traditional concerns like game economy balancing or prototyping.
The industry is shifting away from high-volume acquisition toward sustainable growth models that prioritize long-term user retention and lifetime value maximization.
Monetization
User Acquisition
In-Game Advertising
+2
AppLovin
Jan 2025
Report
65 pages
The State of AAA Game Advertising: A Look Back on the Biggest Launches and Trends of the Past Year
AAA advertising shifted heavily toward new title launches in 2023, which accounted for 50% of total ad spend compared to just 20% in the previous year.
YouTube remains the dominant advertising channel at 35% of total spend, though marketing budgets are increasingly diversifying into TikTok, Instagram, and OTT services to leverage short-form video engagement.
High-budget marketing is no longer the sole path to success, as titles like Lethal Company and PalWorld achieved millions of sales through viral gameplay and creator-driven interest with minimal ad investment.
Advertising
Market Analysis
Global
+2
Sensor Tower
Jan 2025
Report
8 pages
Dynamics of Gaming Deals
Global gaming VC investment peaked at $5.3 billion across 186 deals in 2021 before contracting sharply to $874 million in 2023.
The decline in total capital was primarily driven by a scarcity of Series A-plus growth-stage funding, even as early-stage financing remained relatively stable.
A modest market rebound is underway in 2024, supported by the entry of new funds and expectations for higher returns despite ongoing user-acquisition challenges.
Investment
Funding
Market Analysis
+1
The Games Fund
Jan 2025
Report
29 pages
InvestGame Q4'24 Report (Unknown Time)
The gaming industry is shifting toward long-term, objective-driven transactions, evidenced by a strong Q4 2024 M&A market and a 22% year-over-year increase in private investment funding.
Venture capital is pivoting away from game development studios in favor of platform and technology startups, forcing corporate venture arms to become the primary source of studio financing.
The work-for-hire sector is seeing major consolidation, underscored by the $2.8 billion buyout of Keywords.
Market Analysis
Mergers & Acquisitions
Investment
+1
InvestGame
Jan 2025
Report
37 pages
The Intrinsic In-Game Advertising Key Trends Report H1 2025
Intrinsic in-game advertising (IIGA) delivers 2,957 attentive seconds per thousand impressions, nearly triple the performance of Facebook Infeed.
Adopting IIGA drives a 20-point lift in ad recall and a 21% lower cost per acquisition (CPA) compared to standard digital benchmarks.
Mobile platforms provide 25 times the scale of impressions and greater audience diversity, while PC and console platforms offer superior immersion through longer session lengths.
In-Game Advertising
Market Analysis
Monetization
+1
Anzu
Jan 2025
Report
37 pages
Starfield: How It Achieved 10M Players
Starfield reached 10 million players at launch, marking the largest release in Bethesda’s history despite a competitive RPG market.
The marketing campaign utilized a $21.2 million advertising budget, the second-highest in the RPG category for 2023.
Over one-third of the total advertising budget was allocated to Over-the-Top (OTT) streaming services, reflecting a strategic shift toward high-impact digital distribution.
Market Analysis
Player Demographics
Marketing
+2
Sensor Tower
Jan 2025
Report
37 pages
Trends Report 2025
In-game advertising delivers high efficiency, with conversion costs averaging 21% below established goals and brand recall increasing by 20 points.
North American advertising costs drop by over 25% in the first quarter, providing a cost-effective window for brands to reach highly active players.
Mobile gaming offers twenty-five times the impression scale of PC and console platforms, while PC and console environments provide deeper immersion with average session lengths of 107 minutes.
In-Game Advertising
Monetization
Market Analysis
+1
Anzu
Jan 2025
Report
26 pages
Newzoo Puzzle Games Report: Mobile Game Genre Insights
The United States is the world's largest mobile puzzle market, followed by Japan and China.
Western puzzle games rely heavily on in-app advertising (IAA) and simple economies, while Eastern titles—especially in Japan—prioritize deep character collection and gacha mechanics to drive higher in-app purchase (IAP) revenue.
Western players demonstrate a higher tolerance for frequent ad breaks, whereas Japanese players prefer longer, uninterrupted sessions and show a greater willingness to pay for aesthetic enhancements and additional functions.
Market Analysis
Player Demographics
Global
+2
Newzoo
Jan 2025
Report
8 pages
Tower Defense Games - Industry Snapshot
Top-tier Tower Defense games achieve a 3.83% conversion rate and an ARPDAU of $1.66, significantly outperforming Idlers, Platformers, and Board Games.
The genre sustains a highly committed player base with an Average Revenue Per Paying User (ARPPU) of $83 and an average daily playtime of 130 minutes.
China is the most lucrative market for the genre, reaching a conversion rate of 8.7%, while France leads in engagement with 210 minutes of daily playtime.
Market Analysis
Player Behavior
Tower Defense
+2
GameAnalytics
Jan 2025
Report
28 pages
Newzoo Hypercasual Mobile Game Genre Report: Eastern vs Western Markets
Hypercasual games accounted for 36 of the top 100 most downloaded mobile games in 2021, though the sector is highly volatile with only eight of the top 36 titles from 2020 remaining in the top rankings the following year.
Standard hypercasual titles struggle with retention, typically seeing less than 10% of players return by the seventh day, which is driving a strategic shift toward hybrid-casual models that incorporate meta-features and live operations.
Runner and racing games became the most downloaded subgenres in 2021, surpassing the previously dominant simulation and puzzle categories.
Market Analysis
Player Demographics
Hypercasual
+1
Newzoo
Jan 2025
Report
33 pages
Power of Play: 2025 Global Video Games Report
Video games provide measurable professional benefits, with gamers outperforming non-gamers in robotic surgery, emergency response, and retail simulations due to improved cognition, decision-making speed, and attentional control.
Organizations including NASA, the U.S. Air Force, and elite sports teams have integrated game-based platforms into their training pipelines to reduce error rates and improve return on investment.
Mobile devices are the primary gaming platform globally, accounting for 60–96% of all play sessions.
Market Analysis
Player Demographics
Player Behavior
+1
Video Games Europe
Jan 2025
Report
71 pages
State of AI Apps Report 2025
Generative AI applications experienced explosive growth in H1 2025, reaching 1.6 billion downloads and $1.2 billion in in-app purchase revenue.
Revenue growth significantly outpaced adoption, with a 200 percent increase in in-app purchase revenue and a 67 percent rise in downloads compared to H2 2024.
The user base is heavily skewed toward younger males, with approximately 60 percent of users being male and nearly 70 percent under the age of 35.
Market Analysis
AI
Monetization
+2
Sensor Tower
Jan 2025
Report
66 pages
Insights into Global Mobile Game Marketing Trends for H1 2025
AI-driven creative production has become the industry standard, with generative tools and AI-enhanced playable ads compressing development cycles to under one week.
Europe leads in market participation with over 43,000 monthly advertisers, while North America maintains the highest creative density at approximately 119 assets per advertiser.
Casino games have emerged as the second-largest spending category, recording a 14.5% year-over-year increase in market share.
Market Analysis
Advertising
In-Game Advertising
+2
SocialPeta
Dec 2024
Report
3 pages
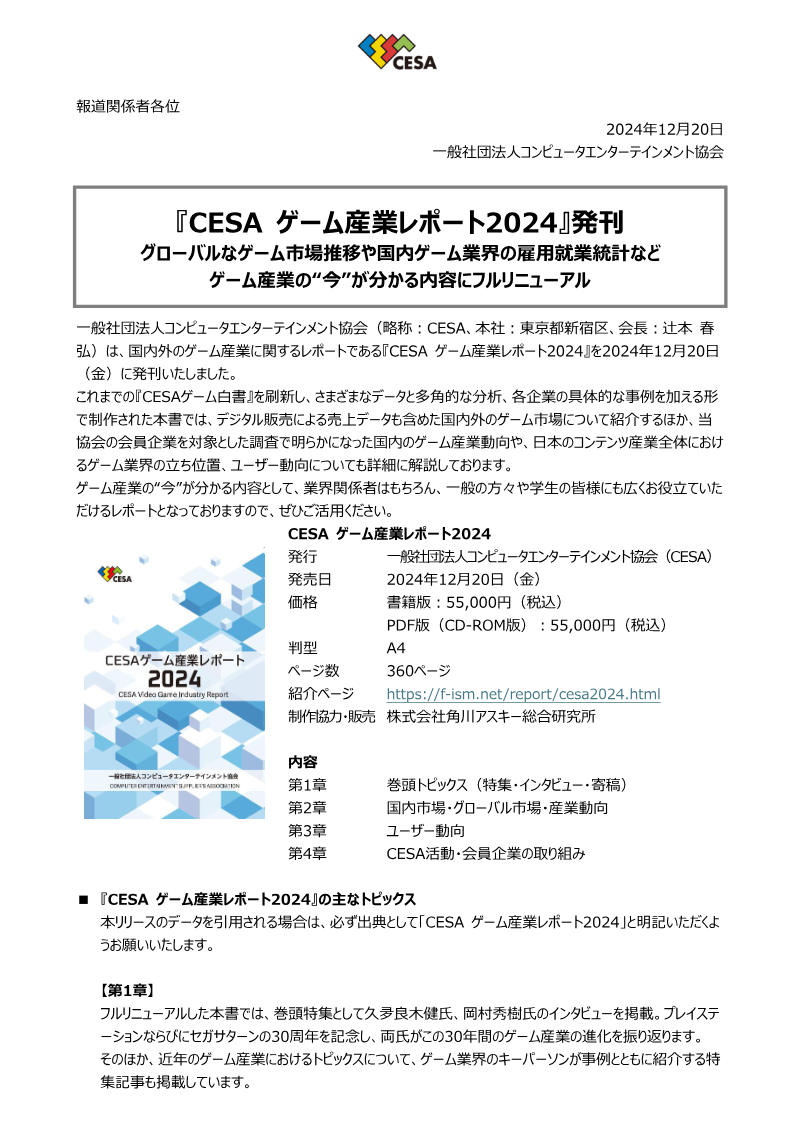
CESA Game Industry Report 2024
The global game-content market reached approximately ¥30 trillion in 2024, nearly doubling from the ¥20 trillion recorded in 2020.
Mobile gaming remains the dominant global platform, accounting for approximately 60% of total revenue, while console and PC sectors each hold roughly 20% shares.
Japanese game exports generate approximately ¥2.82 trillion, representing about 60% of the country's total ¥4.7 trillion content industry exports.
Market Analysis
Employment
Global
一般社団法人コンピュータエンターテインメント協会 (Computer Entertainment Supplier’s Association)
Dec 2024
Report
74 pages
2024 Global Mobile Games Marketing Trends & Insights
The top 50 publishers now control 70% of total global mobile gaming revenue, driving a market-wide shift toward hybrid-casual models that combine ad-based revenue with in-app purchases.
Advertising activity surged by 60% year-over-year in 2024, with 250,000 advertisers deploying 46.2 million creative assets despite a decline in new market entrants.
Short-form video has become the dominant engagement driver, accounting for up to 81% of impressions in the Puzzle and Simulation genres.
Market Analysis
Advertising
In-Game Advertising
+2
SocialPeta
Dec 2024
Report
46 pages
Digital Market Index: Q4 2024
Global in-app purchase revenue reached a record $39.4 billion in Q4 2024, bolstered by a 28.2% year-over-year surge in non-game application spending.
TikTok became the first application to surpass $6 billion in annual revenue, highlighting the massive monetization potential of non-game platforms.
The iOS ecosystem captured 70% of total revenue, while Google Play maintained its dominance in scale by facilitating nearly 75% of the 34.1 billion global downloads.
Market Analysis
Global
Mobile
+1
Sensor Tower
Dec 2024
Previous
1
…
19
20
21
…
40
Next