The Amusement
Game
Documents about The Amusement

Square Enix Holdings Three-Month Period Ended June 30, 2017: Reference Materials
Square Enix Holdings reported strong financial growth for the first quarter of the fiscal year ending March 31, 2018, covering the period from April 1 to June 30, 2017.
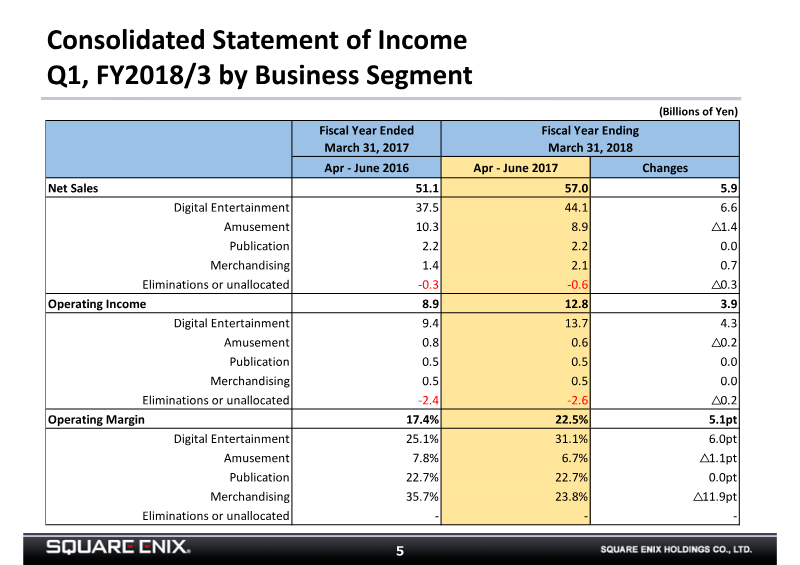
- Square Enix Holdings posted Q1 FY2018 (April 1–June 30, 2017) consolidated net sales of 57.0 billion yen, up 5.9 billion yen year over year.
- Operating income rose to 12.8 billion yen from 8.9 billion yen in the prior-year quarter, lifting operating margin to 22.5%.
- Digital Entertainment was the main driver, contributing 44.1 billion yen in net sales and 13.7 billion yen in operating income, which exceeds the company's consolidated operating income of 12.8 billion yen.
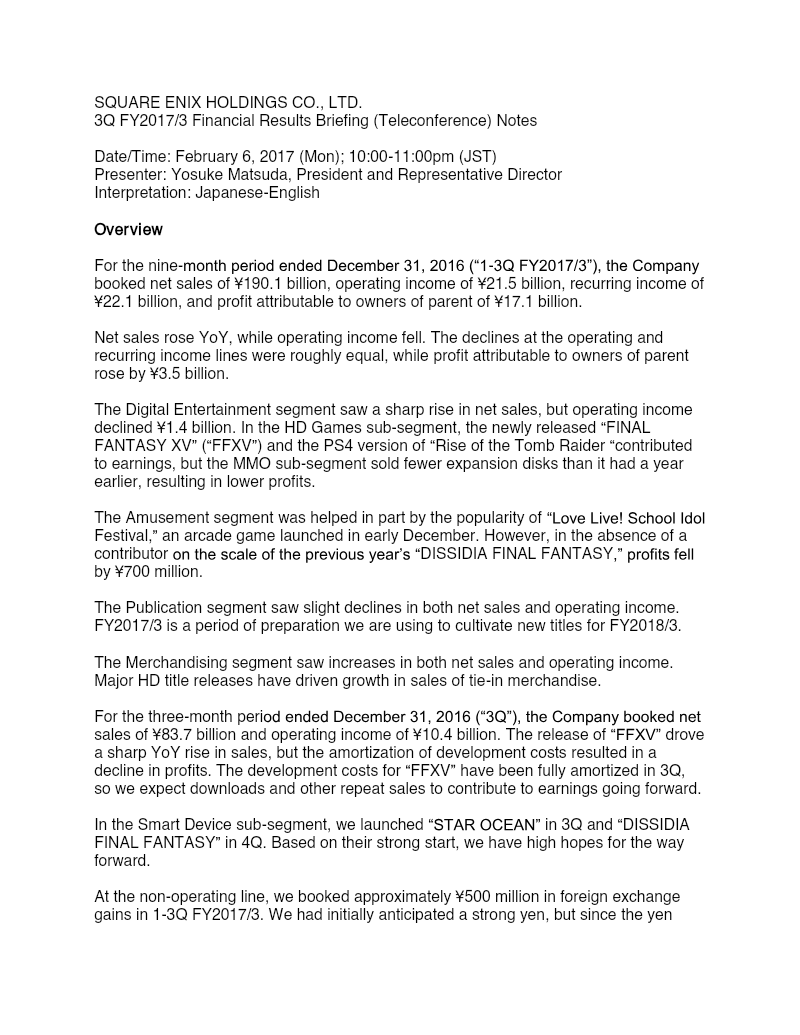
Square Enix Holdings 3Q FY2017/3 Financial Results Briefing
Square Enix Holdings reported financial results for the nine-month period ending December 31, 2016, reflecting a period of high-profile releases balanced by significant development cost amortization.
- Square Enix reported 1-3Q FY2017/3 net sales of ¥190.1 billion and operating income of ¥21.5 billion, with operating income declining year-over-year despite a sharp rise in Digital Entertainment sales.
- Final Fantasy XV reached 6 million units in shipments by early 4Q, with development costs fully amortized in 3Q, allowing future downloads and repeat sales to contribute directly to earnings.
- The Digital Entertainment segment experienced a ¥1.4 billion decline in operating income due to lower MMO expansion disk sales compared to the previous year and the heavy amortization of FFXV development costs.
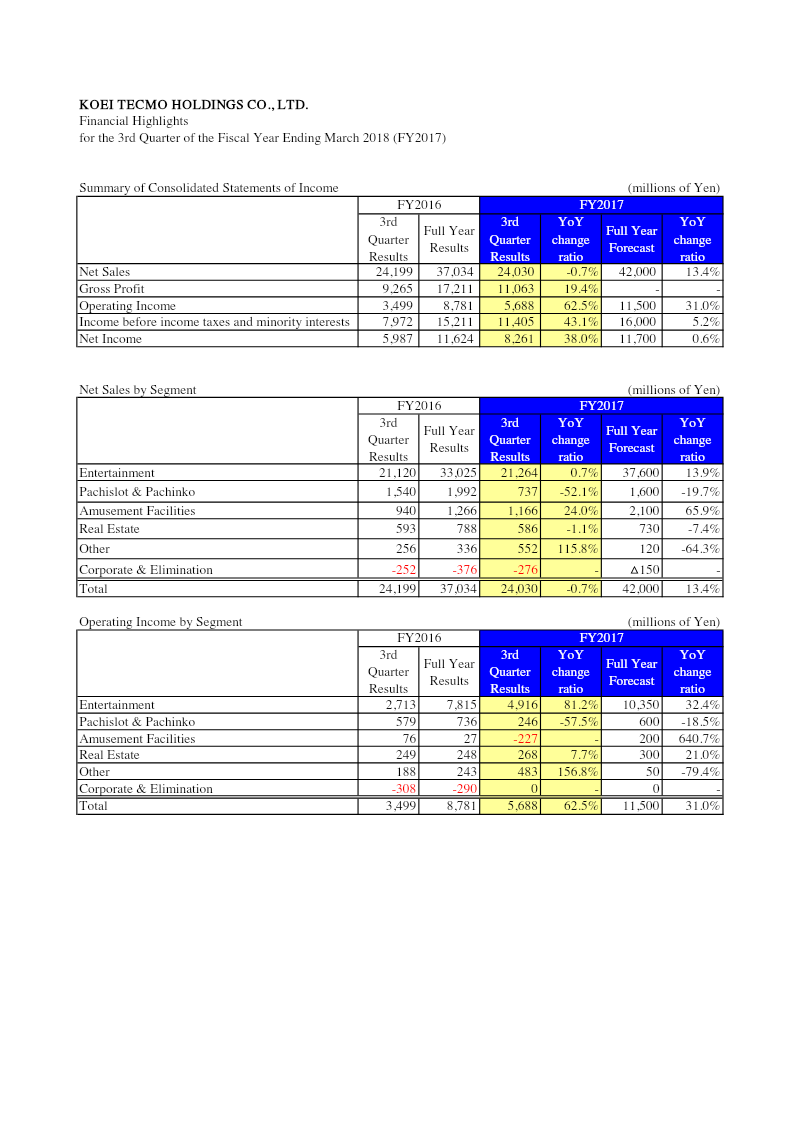
Financial Highlights for the 3rd Quarter of the Fiscal Year Ending March 2018 (FY2017)
Koei Tecmo Holdings reported strong profitability growth for the third quarter of the fiscal year ending March 2018, despite a slight softening in top-line revenue.
- Koei Tecmo Holdings achieved significant profitability growth in Q3 FY2017, with operating income rising 62.5% to 5.69 billion yen and net income increasing 38.0% to 8.26 billion yen, despite a marginal 0.7% decline in net sales.
- The Entertainment segment is the company's primary profit engine, generating 21.26 billion yen in sales and a substantial 81.2% year-over-year increase in operating income to 4.92 billion yen.
- The Pachislot & Pachinko segment underperformed significantly, suffering a 52.1% decline in sales and a 57.5% drop in operating income.
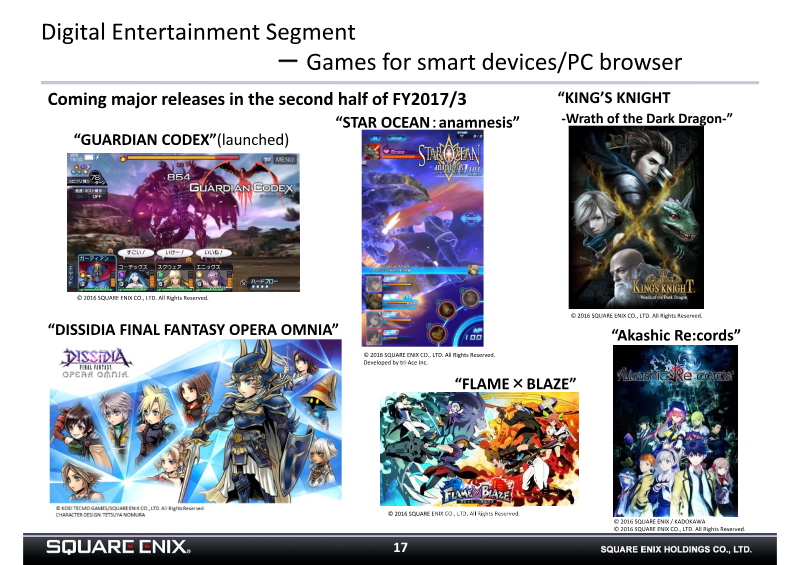
Square Enix Holdings Financial Results: Six-Month Period Ended September 30, 2016
Square Enix Holdings reported financial results for the six-month period ending September 30, 2016, highlighting a period of significant top-line growth alongside a contraction in operating profitability.
- Square Enix reported net sales of 106.3 billion yen for the six-month period ended September 30, 2016, a significant increase from 86.4 billion yen in the same period of the previous year.
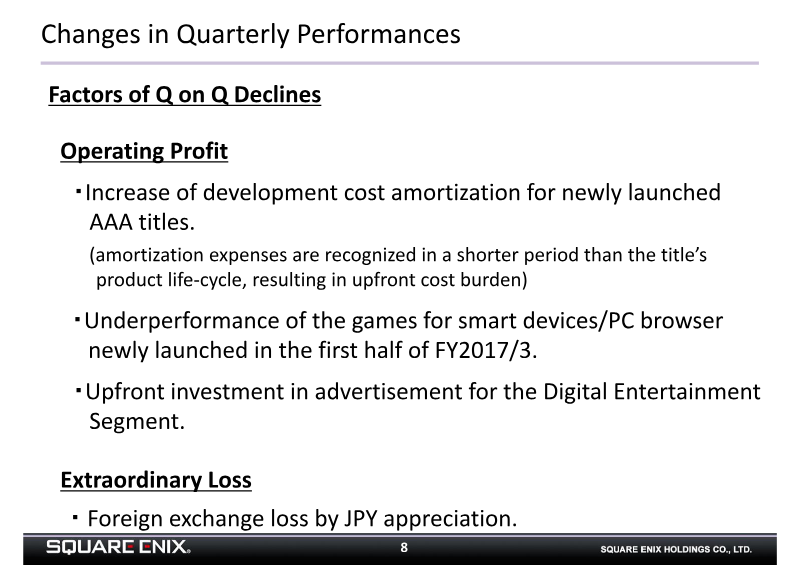
- Operating income for the first half of FY2017/3 was 11.1 billion yen, a decrease from 12.6 billion yen in the prior year, driven by higher amortization costs for new AAA titles and underperformance of new smart device and PC browser games.
- The Digital Entertainment segment remains the primary revenue driver, contributing 78.3 billion yen in net sales, though its operating margin compressed from 21.5% to 15.5% year-over-year.
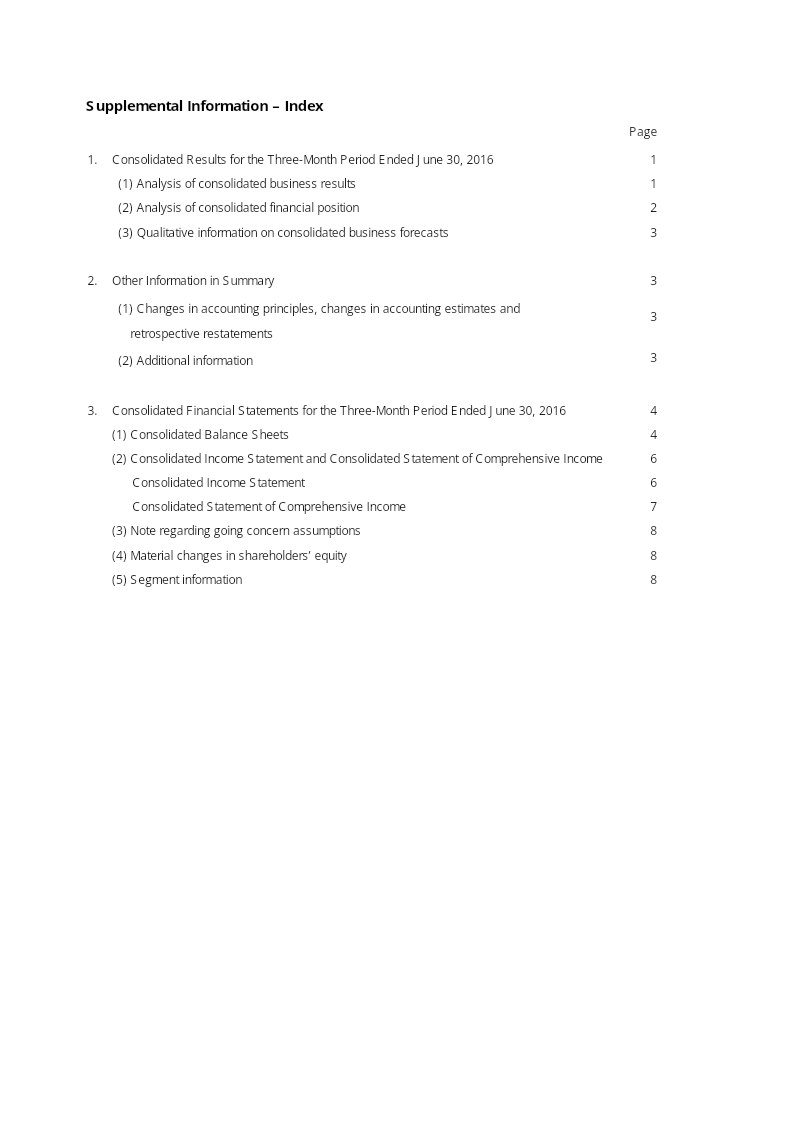
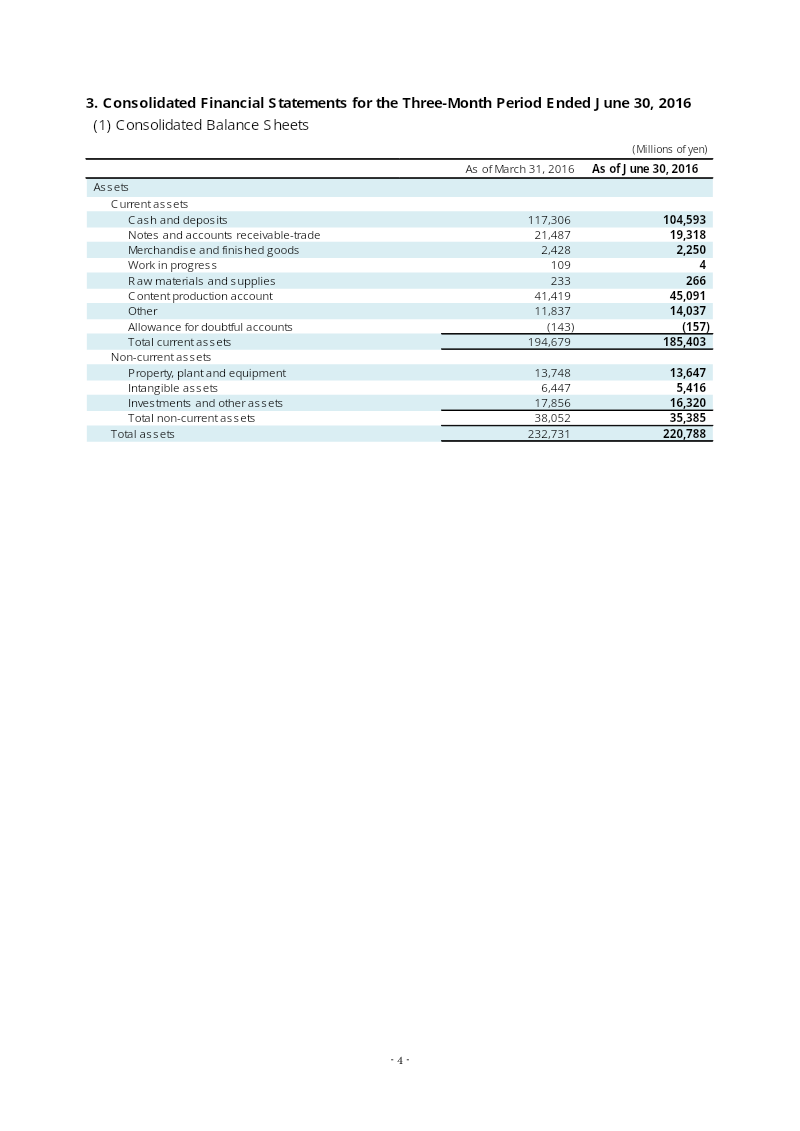
Square Enix Holdings Consolidated Financial Results: Three-Month Period Ended June 30, 2016
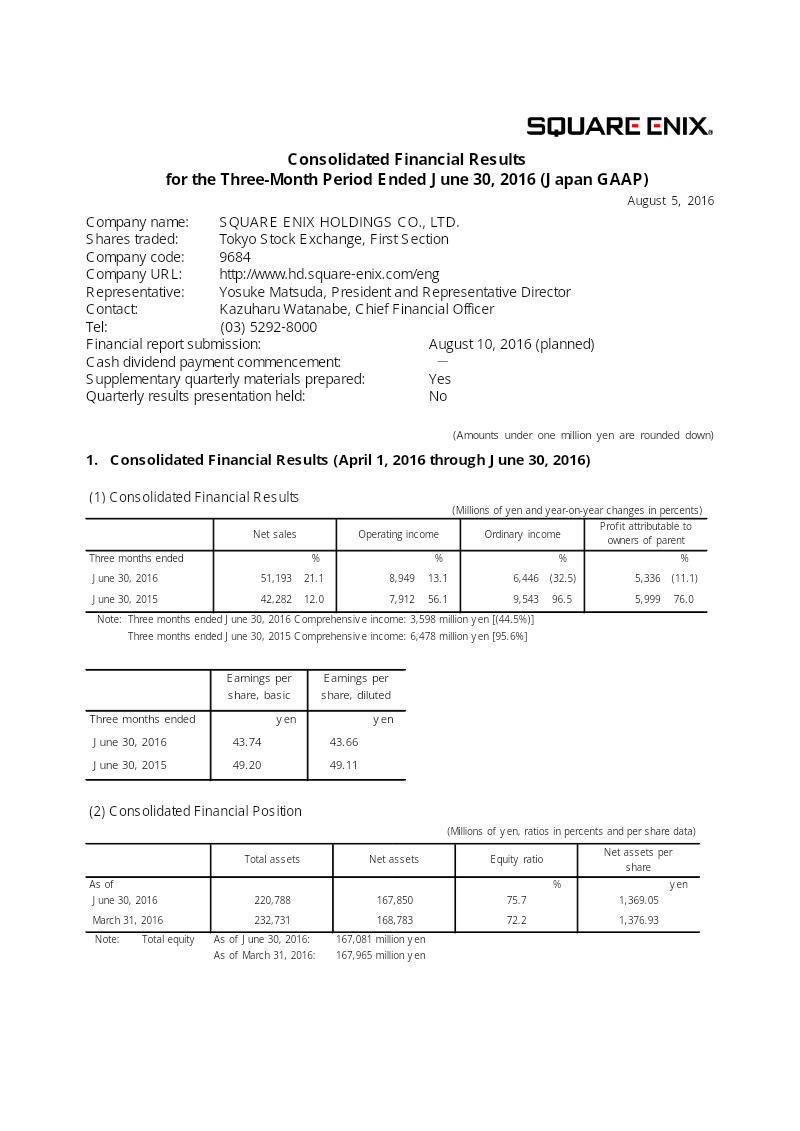
Square Enix Holdings reported its consolidated financial results for the three-month period ending June 30, 2016, demonstrating strong top-line growth despite a decline in bottom-line profitability.
- Square Enix reported consolidated net sales of ¥51,193 million for the quarter ended June 30, 2016, a 21.1% increase year-on-year, while operating income rose 13.1% to ¥8,949 million.
- The Digital Entertainment segment, the company's primary revenue driver, saw net sales grow 23.9% to ¥37,541 million and operating income rise 15.6% to ¥9,472 million, fueled by strong performance in smart device, PC browser, and console titles.
- Ordinary income fell by 32.5% to ¥6,446 million, largely impacted by ¥2,520 million in foreign exchange losses compared to the prior year's gains.
Square Enix Holdings Financial Results: Fiscal Year Ended March 31, 2016
Square Enix Holdings reported strong financial growth for the fiscal year ended March 31, 2016, driven by a robust performance in its Digital Entertainment segment.
- Square Enix reported strong fiscal year 2016 growth, with net sales rising 27.5% to 214.1 billion yen and net income increasing 102.3% to 19.9 billion yen compared to the previous year.
- Operating income grew 58.4% to 26.0 billion yen in fiscal 2016, with the company projecting further growth to 30.0 billion yen for the fiscal year ending March 31, 2017.
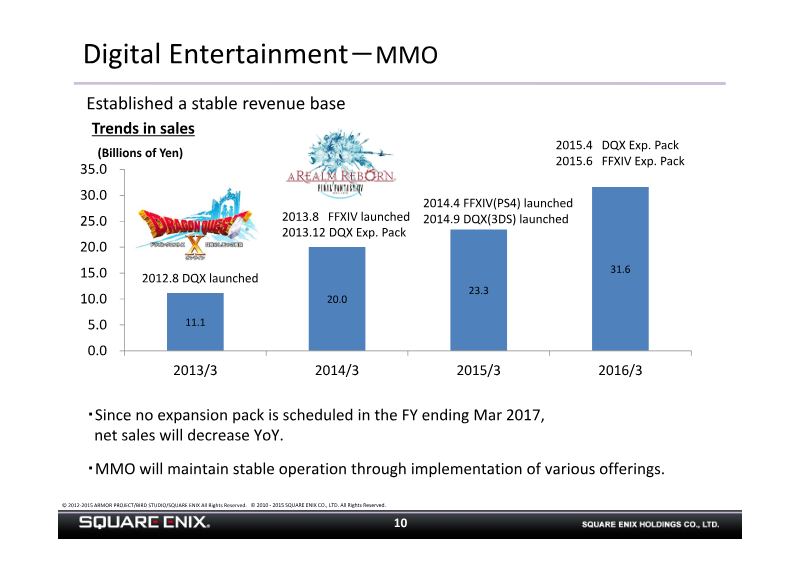
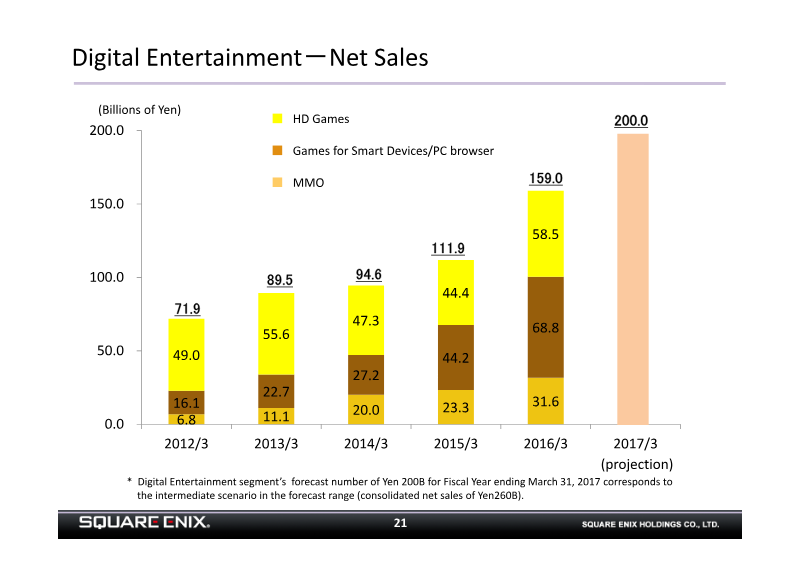
- The Digital Entertainment segment remains the primary revenue driver, contributing 159.0 billion yen in sales in 2016 with a projected increase to 200.0 billion yen for 2017.

Capcom Financial Highlights: Fiscal Year Ended March 31, 2016
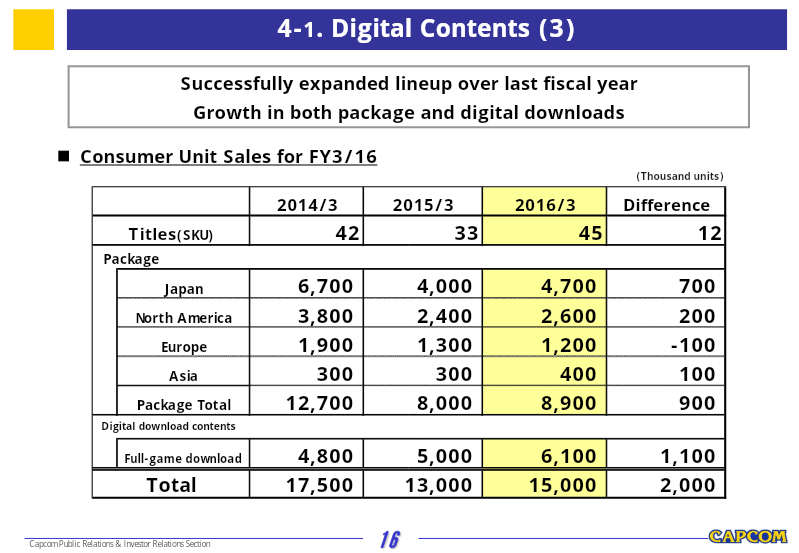
Capcom’s financial results for the fiscal year ended March 31, 2016, demonstrate a period of growth driven primarily by the strong performance of its Digital Contents business.
- Capcom achieved net sales of ¥77.02 billion and an operating income of ¥12.03 billion for the fiscal year ended March 31, 2016, marking year-over-year growth of approximately 20% and 14% respectively.
- The Consumer sub-segment drove growth with 15 million total unit sales, led by Monster Hunter X (3.3 million units) and Street Fighter V (1.4 million units).
- Digital downloads accounted for 26% of total consumer unit sales, highlighting the increasing importance of digital distribution to the company's revenue mix.

Square Enix Holdings Nine-Month Period Financial Results: Nine-Month Period Ended December 31, 2015
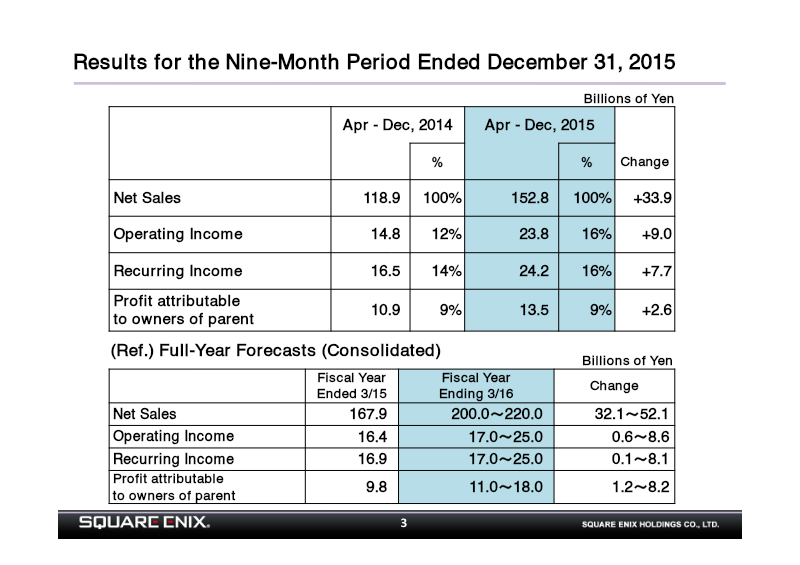
Square Enix Holdings experienced significant financial growth during the nine-month period ending December 31, 2015, driven primarily by strong performance in its Digital Entertainment segment.
- Square Enix reported strong growth for the nine-month period ending December 31, 2015, with net sales rising to 152.8 billion yen, a 33.9 billion yen increase compared to the same period in 2014.
- Operating income grew significantly by 9.0 billion yen year-over-year, reaching 23.8 billion yen for the nine-month period.
- The Digital Entertainment segment was the primary driver of growth, contributing 110.1 billion yen in net sales and 23.1 billion yen in operating income, an increase of 34.7 billion yen and 9.0 billion yen respectively over the prior year.
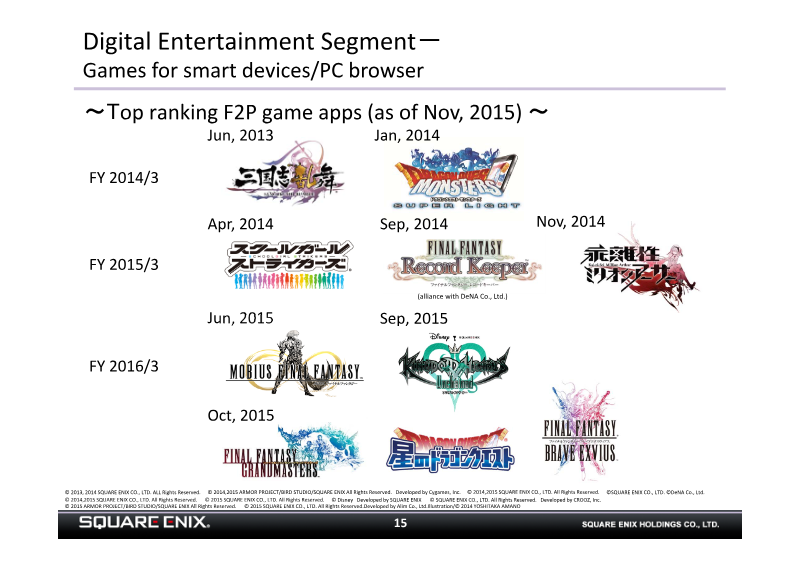
Square Enix Holdings Financial Results: Six-Month Period Ended September 30, 2015
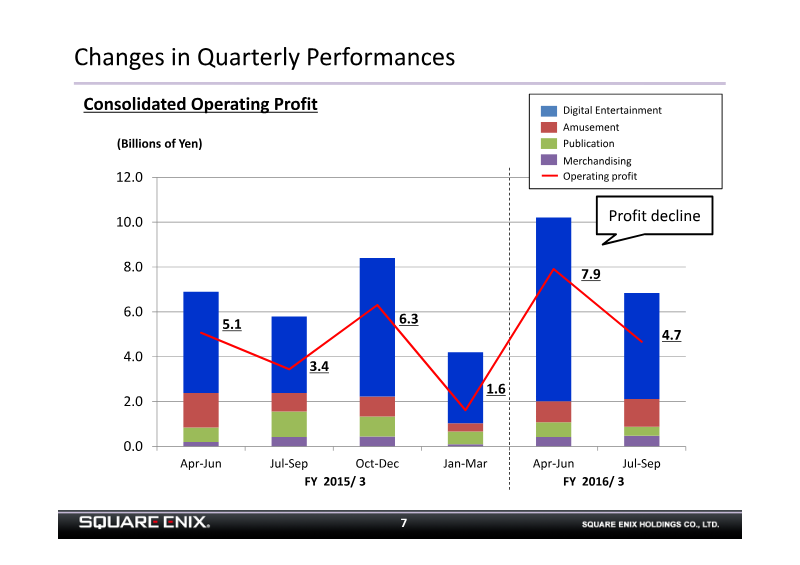
Square Enix Holdings reported strong financial growth for the six-month period ending September 30, 2015, driven primarily by the performance of its Digital Entertainment segment.
- Square Enix reported consolidated net sales of 86.4 billion yen and an operating income of 12.6 billion yen for the six-month period ended September 30, 2015, representing a year-over-year increase of 13.2 billion yen in sales and 4.1 billion yen in operating income.
- The Digital Entertainment segment remains the primary revenue driver, contributing 60.2 billion yen in net sales and 12.9 billion yen in operating income, with an operating margin of 21.5%.
- Quarter-over-quarter operating profit declined due to a reactionary drop in MMO expansion disc sales, losses on the evaluation of smart device and PC browser game content, and increased advertising expenses for HD games.
Capcom Consolidated Financial Results: 6 Months of FY2015
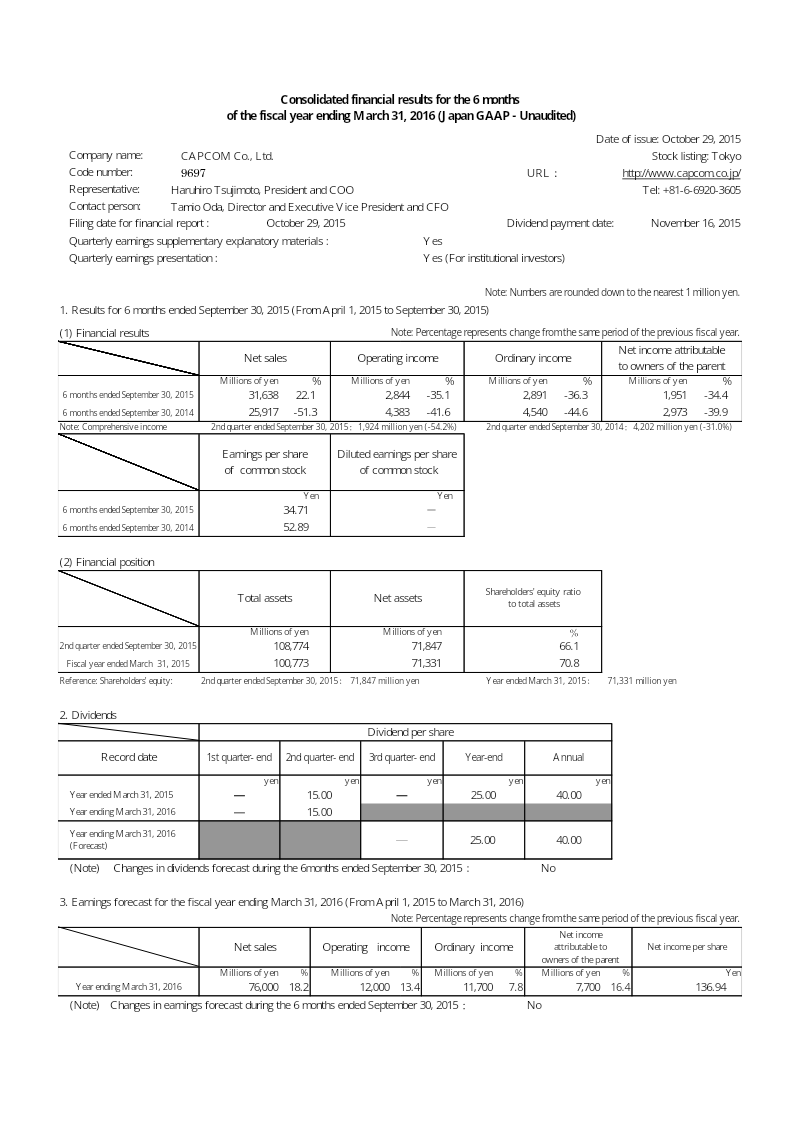
Capcom’s consolidated financial results for the six-month period ending September 30, 2015, reflect a period of revenue growth tempered by significant declines in profitability.
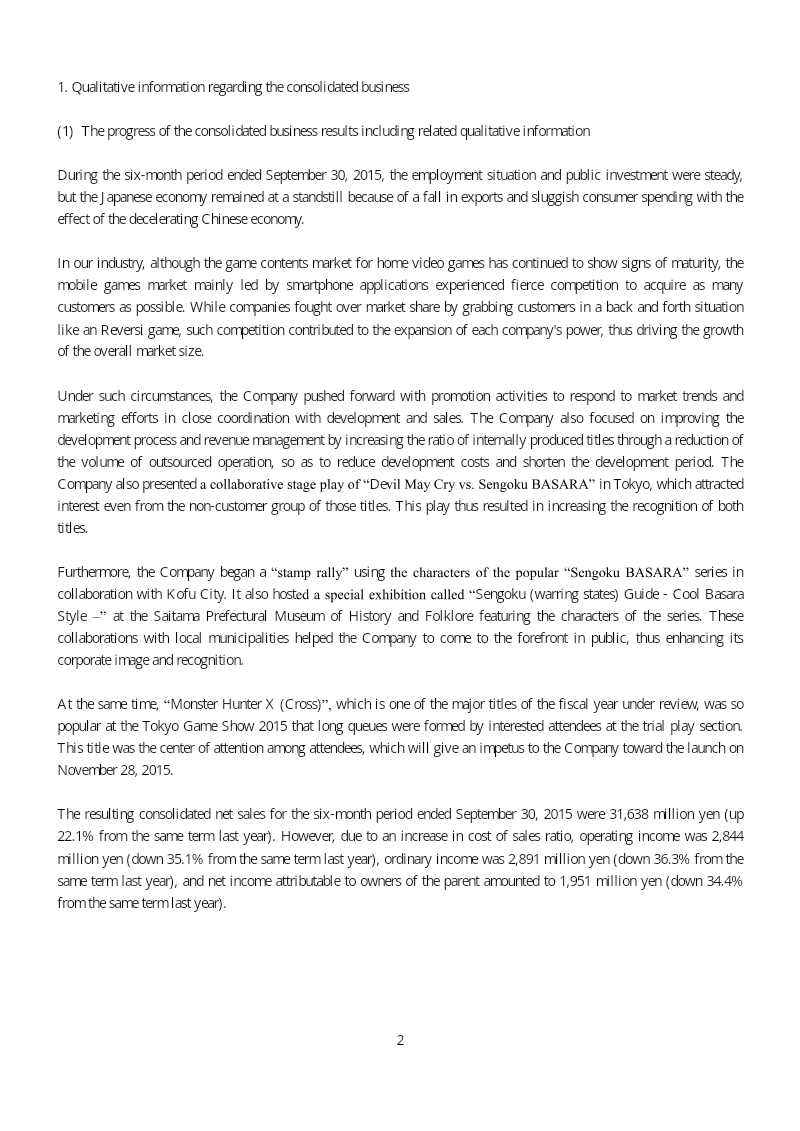
- Capcom reported a 22.1% increase in net sales to 31,638 million yen for the six months ending September 30, 2015, but net income fell 34.4% to 1,951 million yen due to a higher cost of sales ratio.
- The Amusement Equipments segment was the primary growth driver, with sales surging 76.3% to 12,132 million yen, largely fueled by the success of the Resident Evil 6 pachislo machine.
- Digital Contents, the company's core segment, saw a modest 6.2% sales increase but suffered a 28.7% decline in operating income.
Capcom Consolidated Financial Results: 3 Months Ended March 31, 2016
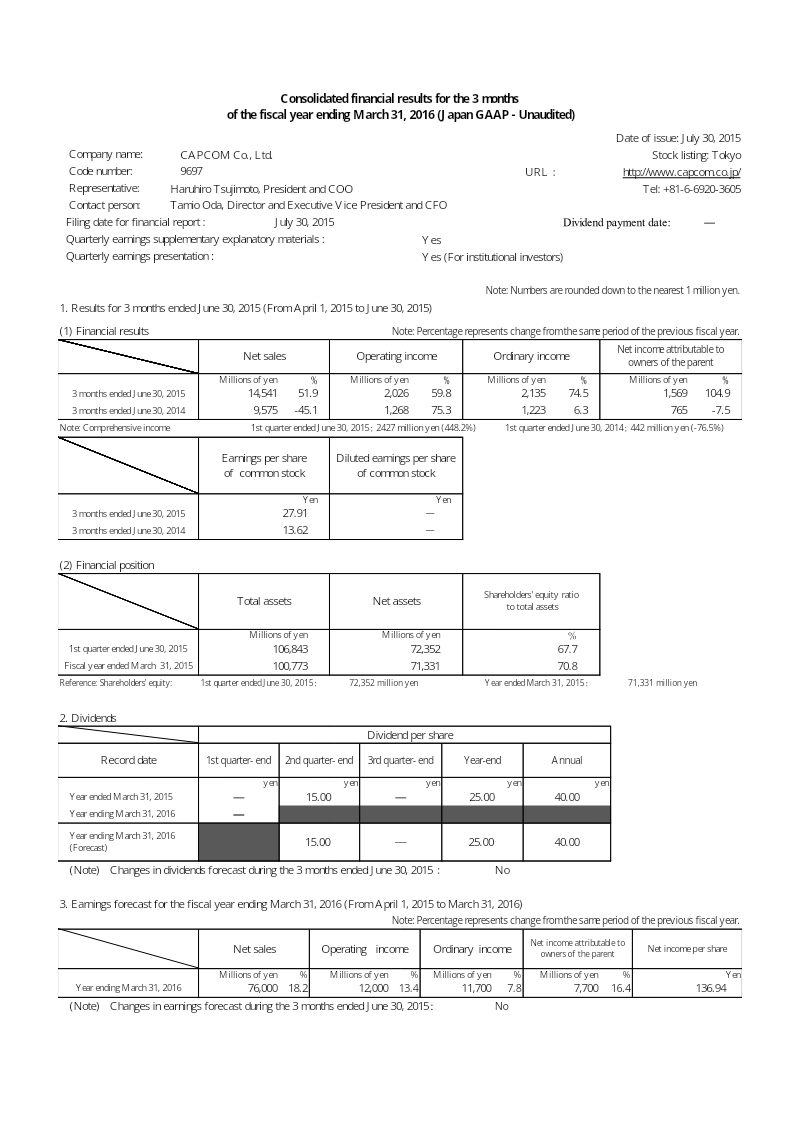
Capcom’s consolidated financial results for the first quarter of the fiscal year ending March 31, 2016, reflect a period of significant growth driven by strong performance in the amusement equipment sector.
- Capcom achieved strong Q1 growth for the fiscal year ending March 31, 2016, with net sales rising 51.9% to 14,541 million yen and net income increasing 104.9% to 1,569 million yen.
- The Amusement Equipments segment was the primary driver of financial performance, reporting a 303.2% surge in sales to 6,042 million yen, largely fueled by the launch of the Resident Evil 6 pachislo machine.
- Digital Contents sales grew 14.3% to 6,294 million yen, bolstered by the release of Devil May Cry 4 Special Edition, though the segment experienced a 2.2% decline in operating income.

Capcom Financial Highlights: Fiscal Year Ended March 31, 2015
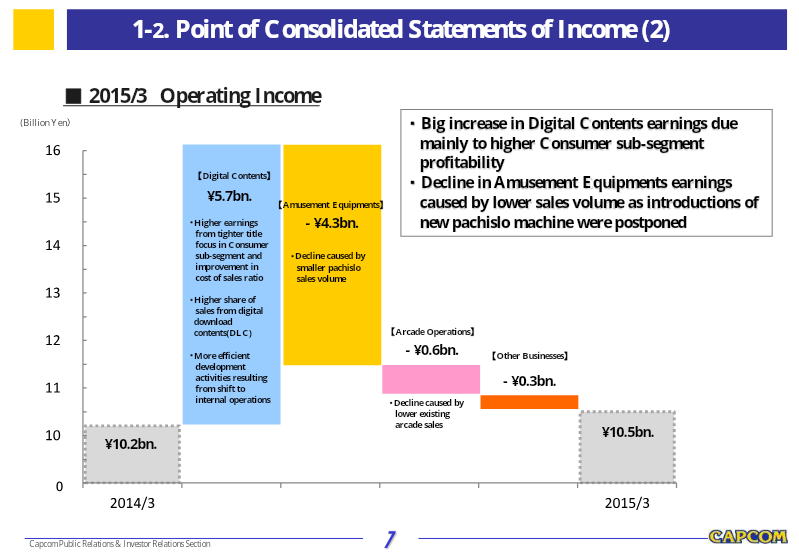
Capcom’s financial results for the fiscal year ended March 31, 2015, demonstrate a strategic pivot toward higher profitability through cost-reduction measures and an increased focus on digital distribution, despite an overall decline in net sales.
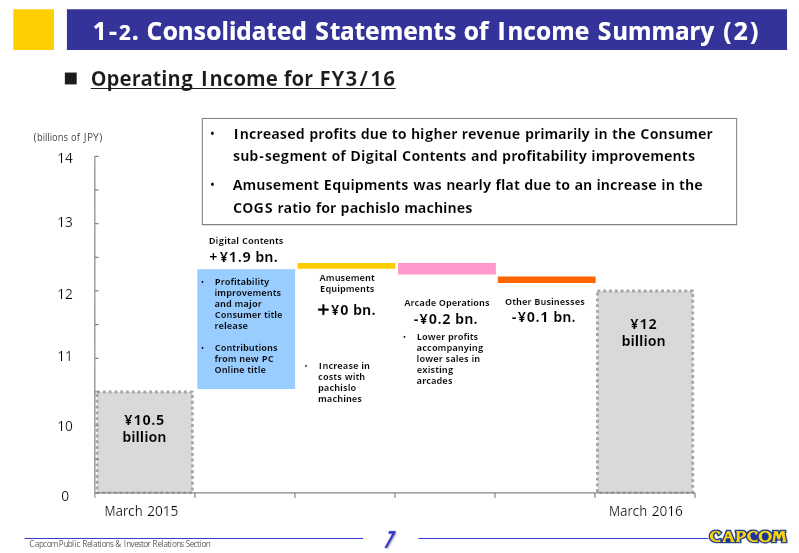
- Capcom achieved an operating income of 10.5 billion yen for the fiscal year ended March 31, 2015, despite net sales falling to 64.2 billion yen from 102.2 billion yen the previous year.
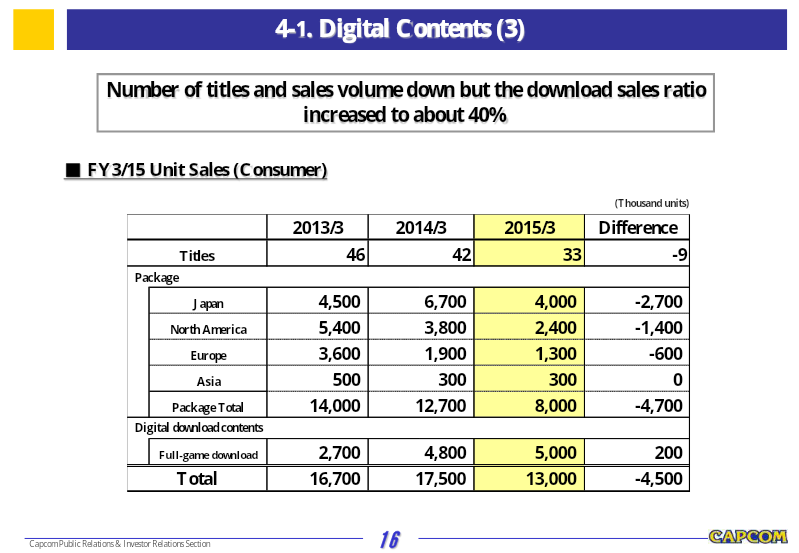
- The Digital Contents segment drove profitability through a shift toward digital distribution, with digital downloads accounting for 25% of consumer title sales and 40% of total unit volume.
- Core franchises including Monster Hunter and Resident Evil remained the primary earnings drivers, helping to offset the lack of major new mobile hits.
Companies behind it
As the documents state it.