#6 THE 12m 9m Drama Studios
Source: From Volatility to Stability: Q3 2024 Gaming Deals Report#1 BITKRAFT 50m 39m Jabali, Stoke Games
Source: From Volatility to Stability: Q3 2024 Gaming Deals Report#4 U $28m - Brain Jar Games, Stoke Games
Source: From Volatility to Stability: Q3 2024 Gaming Deals Report#5 THE 5 4 Drama Studios, #5 Transcend. 18m 18m Brain Jar Games
Source: From Volatility to Stability: Q3 2024 Gaming Deals Report#8 Transcend. 4 4 Brain Jar Games
Source: From Volatility to Stability: Q3 2024 Gaming Deals ReportResearch and development 1,597
Interest income 94
Source: Gravity Co., Ltd. Form 20-F: Fiscal Year Ended December 31, 2005at an initial conversion rate of 20.4526 shares of common stock per $1,000 principal amount of 2027 Notes, which is equivalent to an initial conversion price of approximately $48.89 per share of our common stock.
Source: Unity 10‑Q: Q3 FY2023The provided image is a screenshot of a document containing text and some graphical elements, specifically charts or graphs
The figure illustrates the results of a study on the impact of different types of attacks on the performance of a system, specifically focusing on the number of requests and responses per second
The figure illustrates the results of a study on the performance of different models in predicting the next word in a sequence, specifically focusing on the impact of context and model architecture
The figure illustrates the results of a study on the effectiveness of different methods in detecting and classifying fake news
The figure illustrates the distribution of various types of websites in Poland, categorized by their domain categories
The figure provided is a visualization of the results from the paper "A Survey on the Use of Deep Learning for Network Intrusion Detection
The analysis examines venture capital activity in the gaming sector from 2020 to early 2024, focusing on whether investment priorities are shifting from traditional content creation and publishing toward technology‑driven startups. Data show that, across all stages, content creators and publishers continue to dominate VC allocations, representing over half of both capital deployed (≈$1.76 billion) and the number of deals in early‑, mid‑, and late‑stage rounds. However, a closer look at seed and Series A financing reveals a notable trend: PC and console studios now secure more funding than mobile startups, indicating a pivot toward higher‑budget, platform‑centric projects. In the last twelve months, gaming‑focused VC funds have increased their exposure to technology and platform companies. Capital deployed by select funds such as VENTURES, BEHOLD Venture, and Lightspeed Lvp. rose from roughly $1.3 billion in early 2020 to over $2.4 billion by H1 2024, while the number of rounds led by these funds grew from 67 to 289. This shift is evident across multiple funds, with several moving a larger share of their capital into tech‑centric ventures rather than pure content studios. Geographically, the data encompass global markets with a concentration in North America and Europe, covering all major gaming segments—mobile, PC, console, and emerging platform technologies. The methodology aggregates publicly disclosed VC‑led rounds from 2020 through H1 2024, using capital deployed and round counts as primary metrics. The findings suggest that while content remains the core focus, gaming VCs are progressively allocating more resources to technology and platform innovations, reflecting an evolving investment landscape in the industry.
The analysis examines venture capital activity directed toward studios founded by former Activision Blizzard employees between 2020 and 2024. It identifies 30 such startups that secured a total of approximately $0.7 billion across 45 VC‑led funding rounds, compared with 27 alumni studios from Riot Games that raised $0.5 billion in 38 rounds. Funding is concentrated in early‑stage rounds, with an average check size of $15.8 million for ex‑Activision studios versus $13.1 million for ex‑Riot ventures, and a notable skew toward PC & console and multiplatform projects. Web3 gaming represents a smaller share of the portfolio. The study highlights a “first‑round momentum” effect: ex‑Activision studios are roughly twice as likely to secure a second round of financing within the same calendar year as other VC‑backed gaming startups. In 2021, 43 % of ex‑Activision studios raised a subsequent round versus only 9 % of peers; by 2023 the gap narrowed to 33 % versus 8 %. This pattern suggests stronger investor confidence in alumni teams during the 2021‑2022 peak. Key investors include gaming‑focused funds such as GRIFFIN, PARTNERS COLLECTIVE, and SSSU, which together accounted for more than half of the capital deployed. Notable portfolio companies include Mythical Games (Series C, $262 million), Second Enap (Series B, $100 million), and TheoryCraft (Series A, $87.5 million). While many projects remain in development, releases such as Marvel Snap and Stormgate demonstrate commercial viability, whereas titles like Lightforge’s Project O.R.C.S. were shut down due to lack of traction. Overall, the report underscores a robust investment climate for studios led by former Activision Blizzard talent, driven by early‑stage funding success and a higher likelihood of follow‑on rounds compared to broader gaming startup cohorts.
The analysis demonstrates that corporate venture capital (CVC) has become the dominant force in gaming investment from 2020 to 2024, accounting for more than half of all capital raised in the sector. CVC‑led rounds total $4.0 billion across 93 deals, while VC‑only and joint VC‑CVC rounds raise $3.5 billion in 80 deals, indicating a strategic shift toward co‑investment models that spread risk and access higher‑profile startups. Geographic focus is heavily weighted toward Asian strategics, with South Korean and Japanese firms such as Riot, NetEase, and Gigaom leading the pack; these investors collectively completed 105 deals worth $1.8 billion, surpassing Western peers in volume but not always in value. The largest disclosed CVC‑led investments target mature gaming studios and multiplatform developers, with EPIC Games securing $2.0 billion in April 2022 and Roblox raising $150 million in February 2020. In contrast, VC‑CVC co‑investments concentrate on platform and technology (“picks and shovels”) startups, exemplified by GreenOak’s $500 million Series I in September 2021 and Samsung‑backed CENVID’s $113 million Series C in July 2021. Mobile segments have seen a decline, with CVC interest shifting toward PC and multiplatform titles; mobile deals now represent only 10–15 % of total CVC activity. Methodologically, the study aggregates public funding announcements from 2020‑2024, categorizing deals by investor type (CVC only, VC only, or joint), segment (studio, platform/tech, mobile, PC/console), and geographic origin. Deal counts and capital raised are sourced from press releases, regulatory filings, and secondary databases, providing a comprehensive view of investment flows. The findings suggest that corporates are increasingly willing to share risk with traditional VCs, enabling larger funding rounds for gaming studios while maintaining strategic alignment and access to emerging technologies.
The analysis examines the evolution of mobile gaming investment and M&A activity from 2020 through the first half of 2025. Mobile platforms have dominated the sector, accounting for 61 % of total gaming deal value (excluding ATVI) and nearly all first‑half 2025 volume, driven by strategic and private‑equity deals. Venture capital enthusiasm peaked in 2021 with 137 rounds totaling $2.2 B, but post‑2021 the focus shifted toward profitability and sustainable unit economics, leading to a sharp decline in mid‑core deals—from 49 in 2021 to only eight by H1 25—while casual studios captured 65 % of all deals due to faster iteration and broader audience reach. Geographically, Turkey led casual gaming with 27 % of deals, whereas Europe and Asia dominated mid‑core, contributing 66 % of transactions in 4X, RPGs, and shooters. Early‑stage activity remained steady at pre‑seed/seed levels, yet Series A and later rounds became rarer as scaling challenges intensified. Median early‑stage check sizes hovered around $10 M, with notable large rounds such as Spyke’s $55 M seed and Scopely’s $340 M Series E. Strategic buyers intensified their presence, executing $7 B in mobile M&A across six deals within a year. The largest acquisitions include Af’s $12.7 B purchase of 2yga (casual) and Scopely’s $4.9 B takeover of GamesGroup (mid‑core). Overall, the data illustrate a market shift from VC‑led growth to strategic consolidation, with casual titles and recurring revenue models becoming the primary drivers of investment value.
Mobile gaming has rebounded from the downturn of 2022‑23, with a projected compound annual growth rate of 5.0% from 2020 to 2025, driven largely by a 16.2% rise in in‑app advertising and the continued popularity of casual puzzle titles. The sector’s resilience is underpinned by AI‑powered ad tech, rewarded advertising platforms, multiplatform releases that bypass app‑store fees, and strategic IP licensing collaborations. Despite this growth, venture capital remains cautious; VC deployments in mobile studios have plateaued while high‑profile exits such as King, Zynga, and Playtika illustrate that capital is still scarce. Mature studios reinvest roughly one‑third of revenue into user acquisition (UA), yet only a minority secure the $30 million+ funding needed to sustain such spend, and smaller studios often allocate 70% or more of net revenue to marketing. PvX Partners’ cohort‑based UA financing addresses this gap by providing credit secured against future cohort revenues. The model offers up to 80% of monthly customer acquisition costs, recovers 80% of net revenues until repayment, and imposes a modest interest rate tied to Net Return on Ad Spend (ROAS). Case studies show that studios receiving this financing can increase monthly spend by 16–38% while boosting cash balances, achieving accelerated growth and faster exits—examples include Playtika’s acquisition of a $2 billion‑valued studio within 35 months. Overall, the analysis suggests that cohort‑based UA financing can unlock scalable growth for mobile studios that lack traditional VC backing, potentially expanding the market’s total UA spend from $143 billion to an additional $3.2 billion by 2027, while maintaining equity and IP control for founders.
The analysis demonstrates that private equity (PE) has increasingly positioned itself as a decisive force in the gaming sector, channeling more than $21 billion into acquisitions and growth investments from 2018 through the first half of 2025. Annual deal values consistently exceeded $1 billion, underscoring the industry’s institutional maturity and attracting a broad spectrum of PE participants. Control acquisitions dominate, accounting for roughly 60 % of total capital deployed, with notable deals such as Scopely’s $4.9 billion purchase of Games Group and ESL’s $1.5 billion takeover of Facet Games Group. Minority stake purchases, while smaller in dollar terms, remain significant for content and ecosystem players, exemplified by Vungle’s $0.8 billion control of an ecosystem firm. Geographically, the focus is global but heavily weighted toward North America and Europe, with a growing presence in mobile and PC/console segments. The data reveal that content creation—particularly studios with strong IP portfolios—is the most attractive segment, receiving 42 of the 68 PE‑led deals. Ecosystem investments, including platform and service providers, constitute a substantial share of growth capital, reflecting PE’s strategy to build scalable ecosystems around core IP. Methodologically, the study aggregates publicly disclosed transactions from 2018 to mid‑2025, classifying deals by type (control acquisition, minority stake, growth investment, add‑on) and segment. Deal values are sourced from press releases, SEC filings, and reputable financial databases, with exit returns estimated where available. The findings illustrate a shift toward platform‑building and ecosystem consolidation as the default PE playbook, positioning financial investors as key enablers of scale in a structurally fragmented gaming market.
The report examines global venture capital activity in the gaming sector through Q2 2025, highlighting a pronounced contraction in deal volume and value compared with the prior year. Total venture capital raised fell to $904.6 million across 113 closed rounds, a 27.2% QoQ decline and 47.6% YoY drop; the run‑rate projects a 31.1% annual pullback, marking the steepest deceleration since 2023. Deal concentration remains high, with late‑stage and venture‑growth rounds accounting for nearly 40% of transactions despite a historic low in early‑stage activity, which now represents just 61.1% of deals. Median deal size rose 19% to $5 million, while pre‑money valuations climbed 41.7%, reaching $29.9 million YTD. Content development continues to dominate, capturing half of all deals and two‑thirds of exit value; it raised $261.5 million in Q2 versus $512.6 million for gametech/SaaS startups, yet exits remain sparse with only $347.7 million in VC‑ and PE‑backed deals YTD, the lowest run‑rate observed. Geographic focus shifted toward emerging markets—India, Singapore, Argentina, Brazil—where content studios secured multi‑million rounds. Methodologically, data derive from PitchBook’s proprietary database, covering global transactions as of June 30 2025. The analysis aggregates quarterly and trailing‑12‑month figures, disaggregating by stage, segment, and geography to illustrate shifting investor sentiment amid rising development costs, saturated content supply, and regulatory pressures on platform fees.
The analysis maps a $9 billion investment wave in user‑generated content (UGC) gaming from 2020 to 2025, covering roughly 80 companies and titles. Early‑stage rounds (pre‑seed to Series A) account for $0.5 billion, while late‑stage and corporate deals bring the total to $8.9 billion, including major platform names such as Roblox, Epic Games (Fortnite), Linden Lab, and Sandbox. Corporate venture capital and strategic investors contribute $3.5 billion, with notable commitments from Sony/Kirkbi ($2 billion in 2022) and Disney ($1.5 billion in 2024). Modding ecosystems—overwolf, mod.io, CurseForge—receive $0.4 billion in VC or M&A activity. The report tracks engagement metrics, noting Roblox’s 73.5 billion logged hours in 2024 and a peak concurrent user base of 21 million, while Fortnite Creative stabilizes around 1.3 million concurrent users. Creator payouts have risen sharply, with Roblox and Fortnite together disbursing approximately $1.5 billion to developers in 2024, and quarterly earnings showing a 38 % increase from Q2 23 to Q3 23. Funding follows a classic hype cycle: an initial surge during Roblox’s IPO and metaverse buzz (2020‑21), a pullback in 2022, and renewed strategic investment from incumbents in 2023‑24. Early‑stage rounds remain steady, averaging 12–15 deals per year, targeting “next Roblox/Fortnite” platforms and infrastructure. The largest early‑stage investments include $50 million raised by YAHAHA in 2020 and multiple $15–40 million Series A rounds for platforms such as ZAllbaba, Manticore, and Lighforge. Overall, the data illustrate a mature UGC ecosystem that has evolved from hobbyist modding to professionalized creator economies, with sustained capital inflows and growing monetization pathways for both platforms and individual creators.
The analysis demonstrates that Sweden’s gaming sector has evolved into a $19 billion capital ecosystem, with 1,100 companies and 202 firms engaging in tracked transactions since 2014. Sweden contributes roughly 20 % of Steam’s projected 2025 gross revenue, and its developers produced five of the platform’s global top‑10 bestsellers in 2024–25. Capital flows have shifted from early‑stage seed rounds to late‑stage growth and acquisition deals, reflecting a maturation of the pipeline. Private investment rebounded in 2024 after a pullback; late‑stage rounds now dominate, with Aonic’s $157 million growth round and Arrowhead’s $80 million investment illustrating investor preference for studios with proven commercial traction. Early‑stage deal counts have normalized from 2021’s peak, indicating a steady but active pipeline. M&A activity peaked in 2021–22, with ESL’s $1.05 billion sale to Savvy marking the cycle’s apex; subsequent deals have become more selective. Three transactions—King ($5.9 billion), Mojang ($2.5 billion), and ESL ($1.05 billion)—account for 93 % of total M&A value, underscoring the premium paid by global acquirers for Sweden’s IP and engineering talent. Public market activity has shifted from equity‑fueled growth to defensive debt financing; Embracer’s $4.4 billion raised through fixed income and PIPE in 2020–22 exemplifies this trend. Capital concentration is high, with the top ten private rounds comprising over $495 million of an $811 million total. The data, sourced from InvestGame and market‑cap records through December 2025, cover Sweden’s entire gaming industry—mobile, PC & console, VR/AR, esports, and platforms—from 2014 to the present. Methodology includes tracking VC rounds, public offerings, PIPEs, and M&A transactions across all segments. The findings illustrate a resilient ecosystem that has transitioned from early‑stage bootstrapping to mature, high‑value capital flows driven by proven studios and strategic consolidation.
The guide outlines a non‑dilutive financing model designed to fund mobile studios’ user acquisition (UA) campaigns by leveraging cohort performance data. It argues that the global UA spend reached $78 billion in 2025, rising 13% year‑on‑year, and that studios typically allocate 50–70 % of revenue to paid UA while financing through equity. The proposed solution offers capital without equity dilution, with repayment tied directly to user revenue and a lock‑step mechanism that scales cash flow alongside UA spend. The repayment schedule follows the cohort’s return on ad spend (ROAS) curve, beginning when ROAS reaches 100 %. Eligibility criteria focus on predictability rather than speed of payback. Studios must demonstrate at least six months of clean ROAS curves, a history of trending toward transaction data, and an average monthly payback around $100 k attributable to predictable cohorts. The financing partner evaluates whether recent cohorts mirror historically profitable ones, using a benchmark tool that compares a studio’s cohort against over 5,000 mobile app cohorts. Key metrics include cohort margin of safety, tail risk, payer retention, volatility, and scalability. The methodology involves sharing cohort data from platforms such as Appsflyer, Adjust, GCP, or Snowflake. Underwriters then size a facility, allowing studios to draw up to 80 % of their monthly UA spend per cohort. Repayment proceeds once the ROAS curve reaches breakeven, with downside shared if cohorts underperform. The guide targets mobile studios worldwide operating in 2026, offering a structured pathway to unlock growth capital while preserving equity.
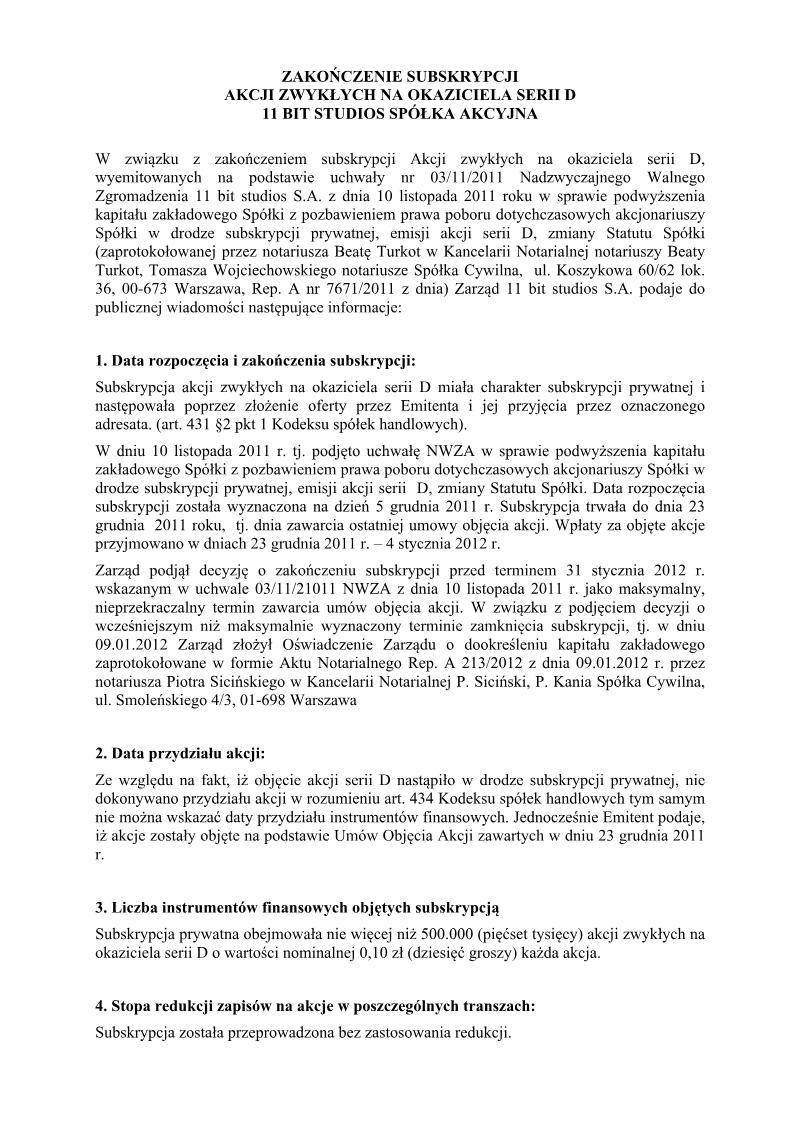
The notarized act dated January 9, 2012 records the formal approval by 11 Bit Studios’ board—Grzegorz Miechowski, Bartosz Brzostek, Przemysław Marszal, and Michał Drozdowski—of a capital increase for the Warsaw‑based public limited company. The board, empowered by Extraordinary General Meeting resolutions of November 10, 2011 (notary file A 7671/2011), authorized the issuance of up to 500,000 new ordinary shares (Series D) at a nominal value of PLN 0.10 each, raising the share capital from PLN 187,076.10 to a maximum of PLN 237,076.10. The resolution also amended the company’s statute to reflect a new share structure: 1,000,000 Series A shares, 494,200 Series B shares, 376,561 Series C shares, and up to 500,000 Series D shares. By December 31, 2011 the board confirmed that 10 subscription agreements had been executed for a total of 40,938 Series D shares, amounting to PLN 4,093.80 in subscription proceeds. The act further specifies that the capital increase was fully paid in cash, with shares deposited into the company’s account before registration. It outlines provisions for voluntary share cancellation and issuance of utility certificates, as well as the allocation of costs: notarial fees, VAT at 23 %, and a civil‑law transaction tax. The document is limited to Warsaw, Poland, covering the period from the November 2011 resolutions through the January 2012 notarization. It relies on statutory provisions under Polish commercial law (articles 431 §7, 310 §2, and related tax statutes) to validate the corporate actions. The act concludes with notarized signatures and fee details, confirming compliance with legal formalities for the capital increase.
The announcement details the conclusion of a private subscription for ordinary bearer shares Series D issued by 11 Bit Studios S.A. The subscription, authorized on 10 November 2011 by a special general meeting to increase capital without existing shareholders’ subscription rights, commenced on 5 December 2011 and closed early on 9 January 2012, ahead of the originally stipulated 31 January deadline. The subscription capped at 500 000 shares, each with a nominal value of 0.10 zł. A total of 40 938 shares were actually subscribed and issued on 23 December 2011, at an emission price of 9.00 zł per share. The offering attracted 64 investors, but only ten entered into subscription agreements on the closing date; no sub‑emission arrangements were made. The transaction incurred total costs of 46 722 zł, comprising 41 722 zł for preparation and execution (including notarial fees), 5 000 zł for advisory and informational documentation, with no remuneration paid to sub‑emitters or promotion expenses. These costs are recorded as interim expenses and will be expensed upon registration of the capital increase in accordance with Polish accounting regulations. The report is confined to Poland, covering a single fiscal period (late 2011–early 2012) and the ordinary share segment of 11 Bit Studios. It follows statutory disclosure requirements under Polish corporate law and the Alternative Trading System regulations, providing a concise overview of subscription dates, share numbers, pricing, investor participation, and cost allocation.