June's Journey
Game
Documents about June's Journey
Playtika Holding Corp. Third Quarter 2022 Financial Results
Playtika Holding Corp. reported its financial results for the third quarter of 2022, highlighting a period of strategic portfolio growth despite a slight decline in overall net income.
- Playtika reported Q3 2022 revenue of $647.8 million, a 1.9% increase year-over-year, while net income declined to $68.2 million from $80.5 million in the prior year period.
- The company's casual gaming portfolio grew 14.4% year-over-year and now accounts for 54.9% of total revenue, while the social casino portfolio declined by 10.2%.
- Key casual titles showed strong growth, with June’s Journey up 32.5%, Bingo Blitz up 14.7%, and Solitaire Grand Harvest up 14.3%, contrasting with a 12.7% revenue decline for Slotomania.
Playtika Holding Corp. Reports Second Quarter 2022 Results
Playtika Holding Corp. reported its financial results for the second quarter of 2022, highlighting a period of operational resilience and strategic growth despite a challenging economic environment.
- Playtika reported Q2 2022 revenue of $659.6 million, remaining effectively flat compared to $659.2 million in the prior year period.
- Net income declined significantly to $36.4 million in Q2 2022, down from $90.0 million in Q2 2021, while Adjusted EBITDA fell to $238.9 million from $264.4 million.
- The company's Casual game portfolio grew 10.0% year-over-year and now accounts for 53.3% of total revenue.
Playtika First Quarter 2022 Earnings Presentation
The Playtika first quarter 2022 earnings presentation outlines the company’s financial performance and strategic shift toward casual gaming.
- Playtika reported Q1 2022 revenue of $639 million, representing a 6.0% year-over-year increase, while net income rose significantly to $83.2 million from $35.7 million in Q1 2021.
- The company is shifting its revenue mix toward casual gaming, which grew 20.7% year-over-year and now accounts for 52.5% of total revenue, up from 45.8% in the prior-year period.
- Direct-to-Consumer (DTC) platform revenue grew 31.5% year-over-year, increasing its share of total revenue to 22.5% compared to 18.1% in Q1 2021.
Playtika Holding Corp. Q1 2022 Earnings Results
Playtika Holding Corp.’s first-quarter 2022 financial results demonstrate steady growth in the mobile gaming sector, characterized by a strategic shift toward casual gaming portfolios and enhanced monetization efforts.
- Playtika reported Q1 2022 revenue of $676.9 million, representing a 6.0% year-over-year increase and a 4.3% sequential growth.
- Net income rose significantly to $83.2 million in Q1 2022, compared to $35.7 million in the same period of 2021.
- The casual gaming portfolio grew 20.7% year-over-year and now accounts for 52.5% of the company's total revenue.

Fireside Chat: Ad Monetisation - Best Practices with Wooga
This discussion outlines best practices for mobile ad monetization, emphasizing the strategic balance between revenue generation and user experience.
- Prioritize user engagement and retention over aggressive ad tactics to ensure long-term success in free-to-play titles.
- Target an engagement rate where 80% to 90% of daily active users interact with at least one ad.
- Implement a robust mediation strategy using three to five ad networks from the start to maximize fill rates and eCPMs.

Rewarded Video Ad-placements: Interesting Implementations From Across the Market
The mobile gaming industry is increasingly adopting hybrid monetization models, integrating rewarded video advertisements into titles traditionally reliant on in-app purchases (IAP).
- Rewarded video ads are increasingly integrated into top-grossing IAP-focused titles, such as competitive shooters and 4X strategy games, to diversify revenue streams despite industry shifts like post-IDFA targeting challenges.
- Call of Duty: Mobile incentivizes ad engagement by offering double weapon XP for the next match and utilizing a milestone system that rewards players for cumulative ad views.
- Dragon City Mobile utilizes a dedicated 'Dragon TV' building to host various ad placements, including premium currency rewards and live events that allow players to redeem ad-earned coins for exclusive characters.

June's Journey Monetization Model: Here's Why It Works
June’s Journey maintains a dominant position within the hidden object genre, having secured over $480 million in lifetime revenue through a sophisticated integration of core puzzle mechanics, world-building elements, and narrative-driven meta-layers.
- June’s Journey has generated $480 million in lifetime revenue since its 2017 launch, with over 63 million total downloads.
- The game utilizes a hybrid monetization model that prioritizes in-app purchases (IAP) for engaged players while using rewarded video ads to monetize the non-paying audience, aiming for a 30% contribution from ad revenue.
- The economy is built on two currencies—diamonds and coins—with diamond packs priced from $1.99 to $99.99, aligning with industry standards to facilitate speed-ups for construction timers.
Casual Puzzle Category Review 2021
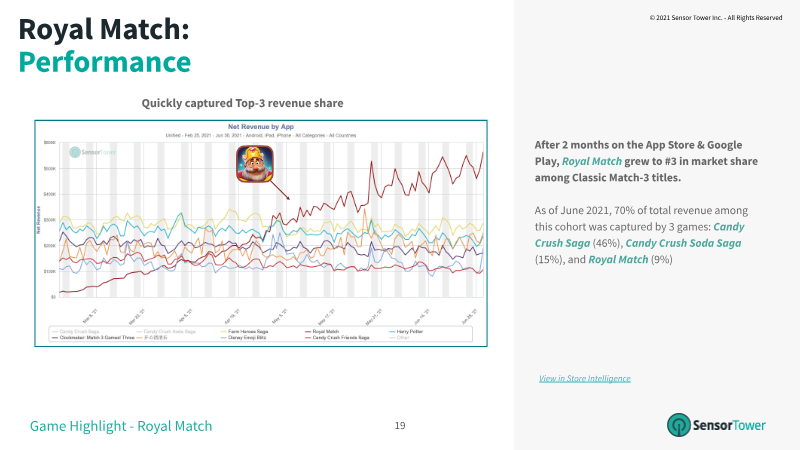
The casual puzzle market experienced a period of significant expansion and structural transformation between 2020 and mid-2021, characterized by a 17% increase in monthly revenue and a surge in successful new releases.
- The Puzzle & Decorate sub-genre has overtaken Classic Match-3 as the primary revenue driver, led by titles like Project Makeover and Royal Match that utilize narrative-driven 3D customization.
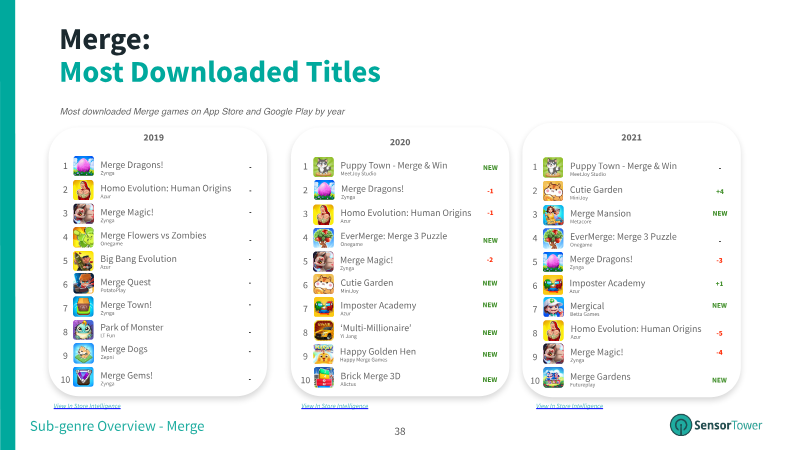
- The Merge sub-genre is the fastest-growing segment, achieving a 498% four-year compound annual growth rate and a 44% revenue increase over 18 months.
- Market consolidation remains high in the Puzzle & Decorate segment, where Playrix and AppLovin control 88% of total downloads and revenue.

2020 Predictions: Prepare to Crown the New King of Puzzle Games
The mobile puzzle game sector stands as a dominant force in the digital economy, currently generating $4.5 billion in annual in-app purchase revenue.
- The mobile puzzle genre generated $4.5 billion in in-app purchase (IAP) revenue in 2019, with Match-3 games accounting for $3.4 billion of that total.
- Playrix is positioned to overtake King as the leader in the Match-3 category, driven by the shift toward 'Puzzle & Decorate' sub-genres and aggressive user acquisition spending that resulted in 308 million annual downloads.
- Marketability has become the primary gatekeeper for scalability in the puzzle genre, forcing companies to prioritize vertical integration and M&A to secure traffic and audience fit.
Mobile game live ops: Using proper frameworks
Effective live operations in mobile gaming require structured frameworks to move beyond high-level key performance indicators and address fundamental gameplay issues.
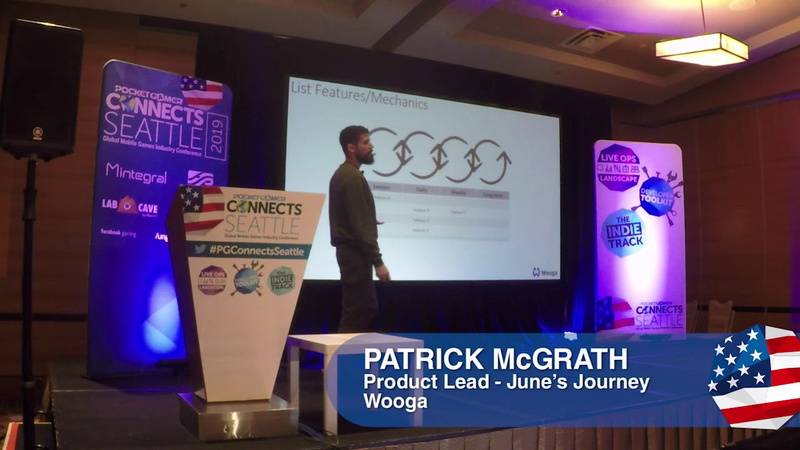
- Integrating player life cycles with compulsion loops allows developers to move beyond high-level KPIs and systematically identify specific gameplay engagement gaps.
- Mapping player competence levels against feedback loops enables teams to deploy targeted features, such as task-based challenge systems, to address session-length deficiencies.
- In the hidden-object game June’s Journey, the implementation of a multi-layered challenge system targeting session, daily, and weekly loops resulted in a 1.3 percentage point increase in day-seven retention.


Playtika Holding Corp. Second Quarter 2025 Results
Playtika Holding Corp. reports second-quarter 2025 results, highlighting a revenue of $696 million that fell 1.4% sequentially but rose 11.0% year-over-year, driven by a mix of direct-to-consumer (DTC) and third-party platform sales.
- Playtika’s Q2 2025 revenue reached $696 million, marking an 11.0% year-over-year increase despite a 1.4% sequential decline.
- Profitability faced significant pressure as GAAP net income dropped 61.7% year-over-year to $33.2 million, and adjusted net income plummeted 91.4% to $6.5 million.
- The flagship title Slotomania experienced a sharp downturn, with revenue falling 22.7% sequentially and 35.4% year-over-year.