2015
Company
Documents about 2015



Annual Report of 11 bit studios S.A. for 2015
The 2015 fiscal year marked a transformative period for 11 bit studios S.A., characterized by record-breaking financial performance and a formal transition to International Financial Reporting Standards (IFRS).
- 11 bit studios achieved record financial performance in 2015, with sales revenue increasing to 22.7 million PLN from 15.6 million PLN in 2014 and net profit reaching 12.8 million PLN.
- The company’s cash reserves tripled during the fiscal year, rising from 7.64 million PLN to 22.93 million PLN.
- Financial growth was primarily driven by the sustained global commercial success of the title This War of Mine across Steam, Apple, and Google platforms.
Turtle Beach Form 10-Q: Q1 2016
Turtle Beach Corporation’s financial performance for the first quarter of 2016 reflects a period of revenue growth tempered by persistent net losses and significant structural challenges.
- As of March 31, 2016, Turtle Beach reduced its total outstanding debt to $32.4 million, down from $64.8 million at the end of 2015, primarily through significant net payments on its revolving credit facilities.
- The company operates two distinct business segments: Turtle Beach, which provides gaming headsets for consoles and PCs, and HyperSound, a directional audio technology business that recently entered the hearing healthcare market with the HyperSound Clear 500P.
- Turtle Beach faces significant liquidity risks, noting that any failure to comply with financial covenants under its credit facilities with Bank of America and Crystal Financial could lead to the immediate acceleration of debt repayment.

Ubisoft Full-Year 2015-16 Sales and Earnings Figures
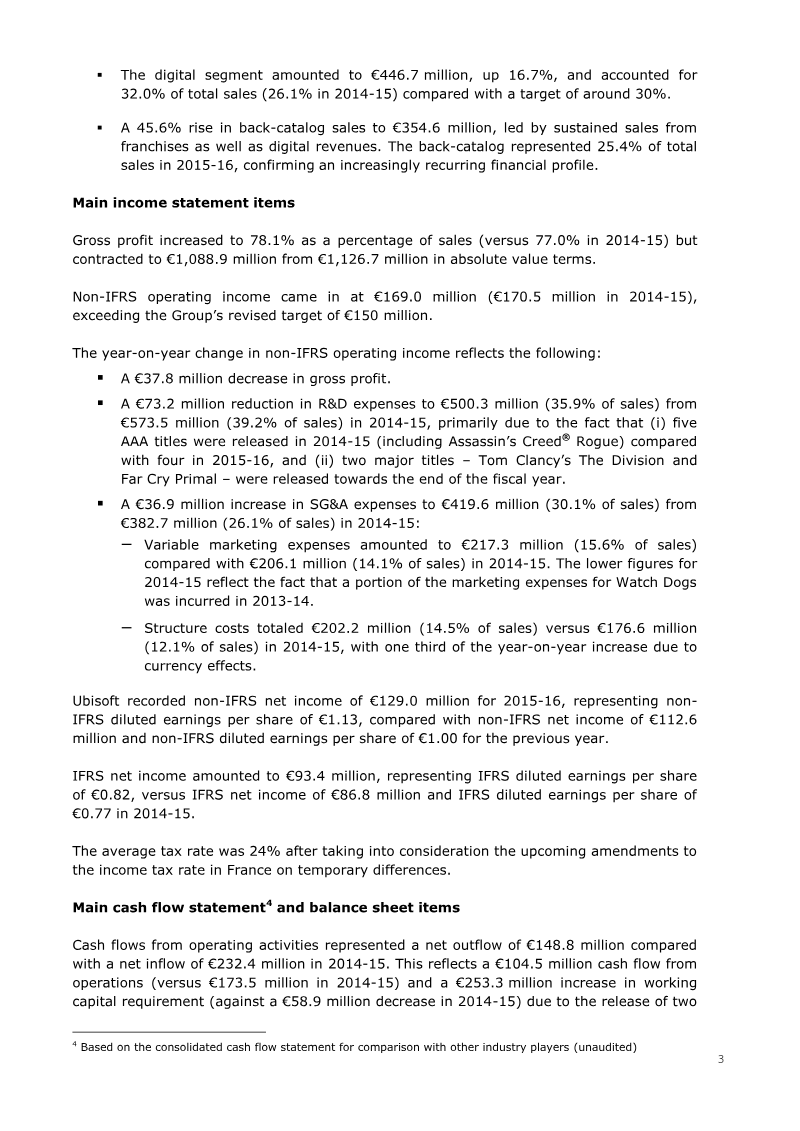
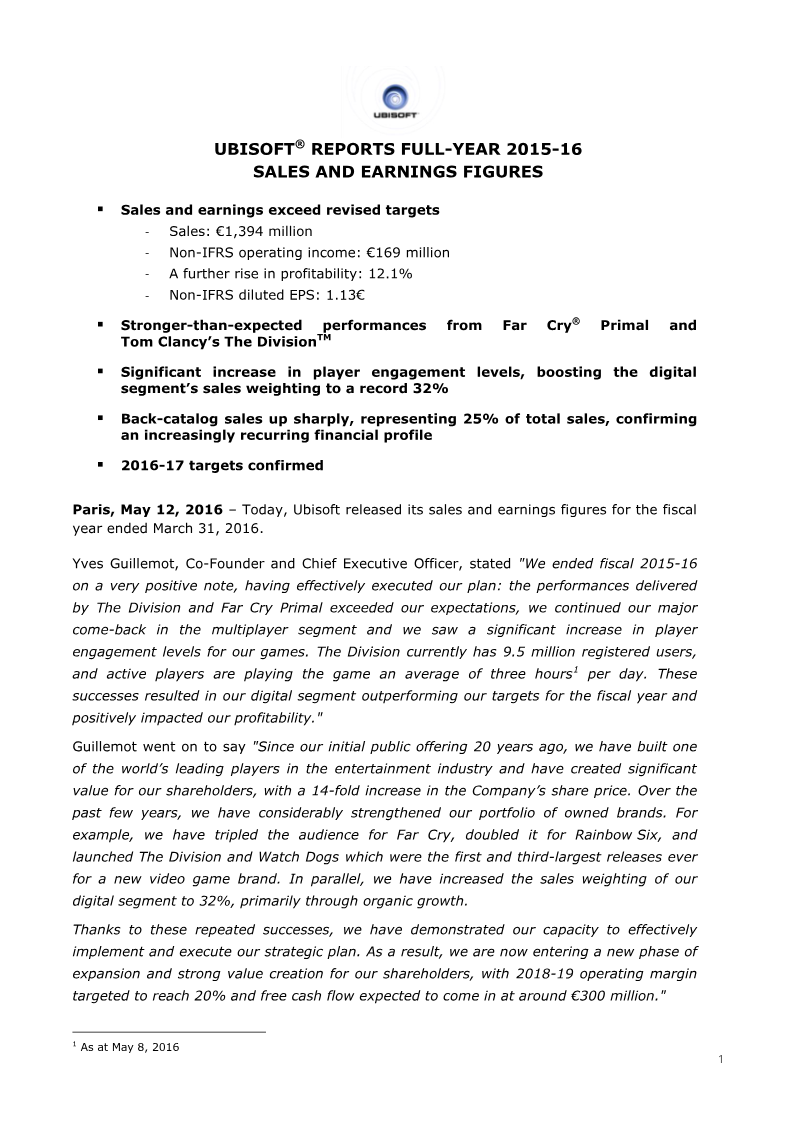
Ubisoft’s fiscal year 2015-16 financial results demonstrate a period of strong operational performance, characterized by the successful execution of a strategy focused on high-engagement multiplayer titles and digital growth.
- Ubisoft reported total fiscal year 2015-16 sales of €1,394 million and a non-IFRS operating income of €169 million, representing a 12.1% profitability margin.
- Digital revenue reached a record 32% of total sales, driven by a 45.6% increase in back-catalog sales which now account for 25.4% of total revenue.
- The company’s focus on high-engagement multiplayer titles was validated by the performance of Tom Clancy’s The Division, which reached 9.5 million registered users, and Rainbow Six Siege.
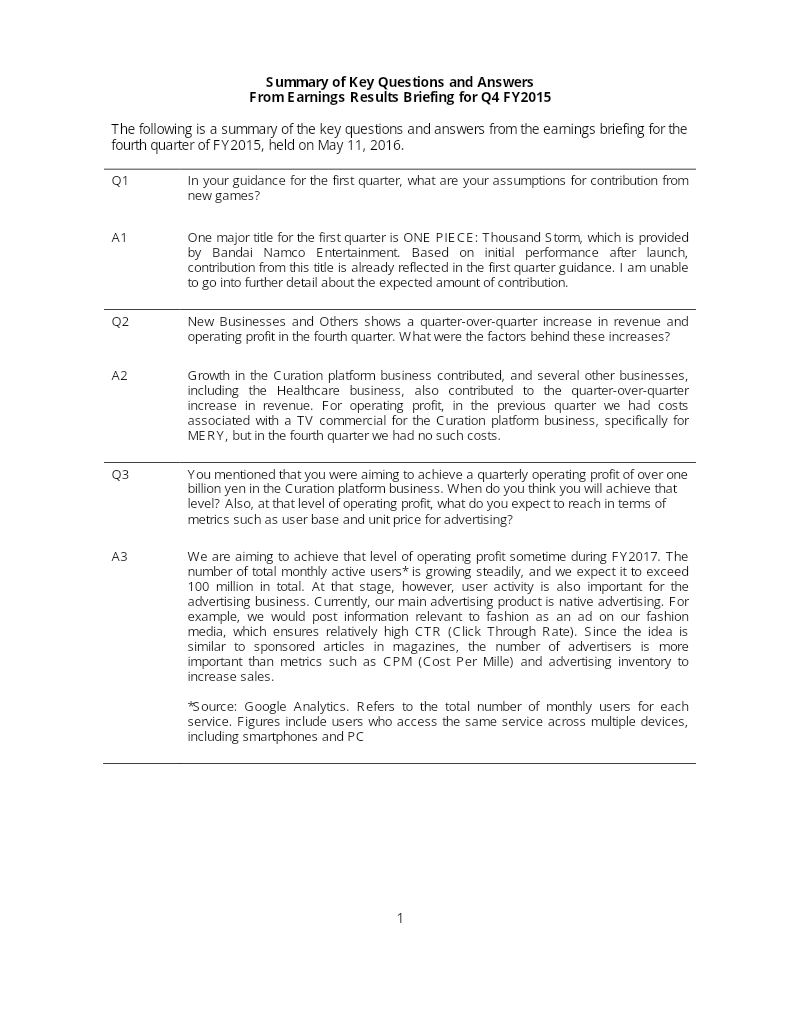
DeNA Q4 FY2015 Earnings Results Briefing: Q&A Summary
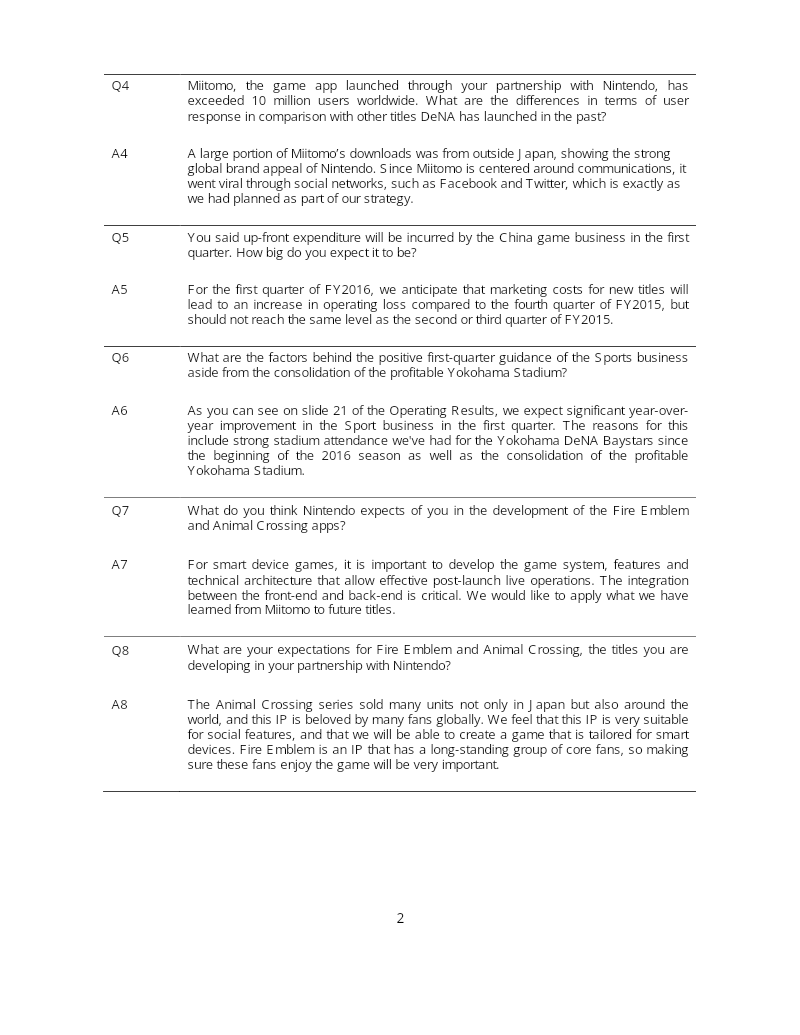
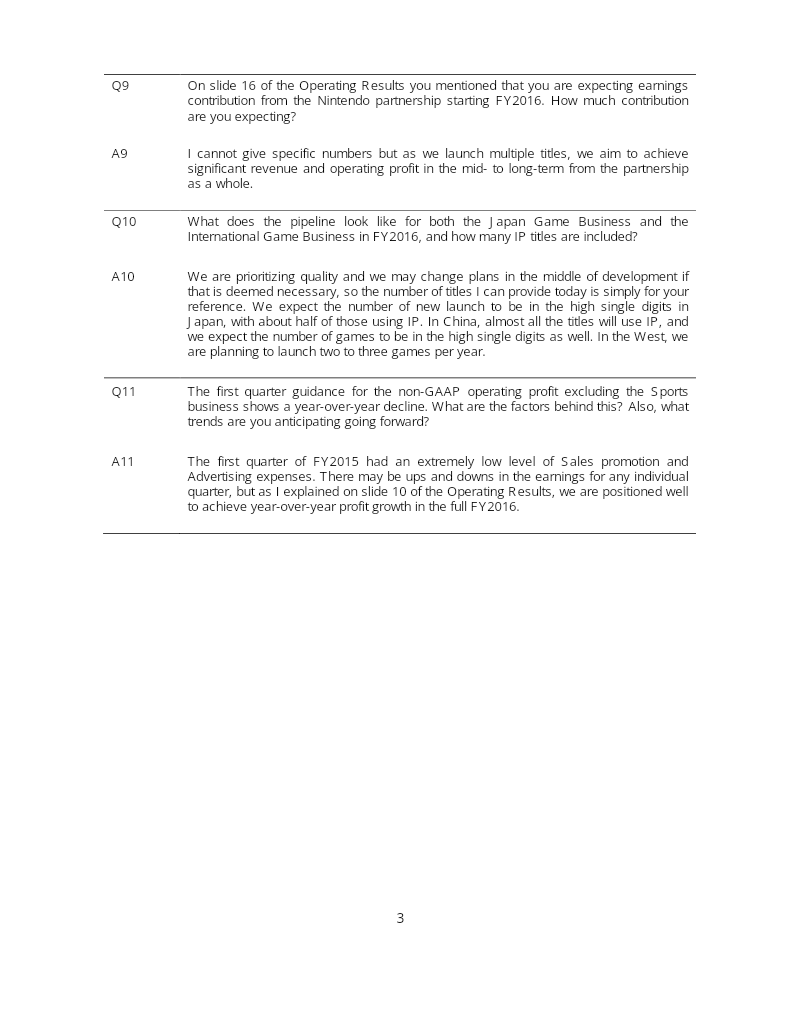
DeNA’s fiscal year 2015 fourth-quarter earnings briefing provides a strategic overview of the company’s diversified business model, focusing on mobile gaming, curation platforms, and sports operations.
- DeNA is targeting over one billion yen in quarterly operating profit for its curation platform business by fiscal year 2017.
- The curation platform strategy aims to scale to over 100 million monthly active users, shifting focus toward native advertising and advertiser acquisition.
- The Nintendo partnership remains a primary mid- to long-term revenue driver, with insights from the Miitomo launch informing upcoming Fire Emblem and Animal Crossing titles.
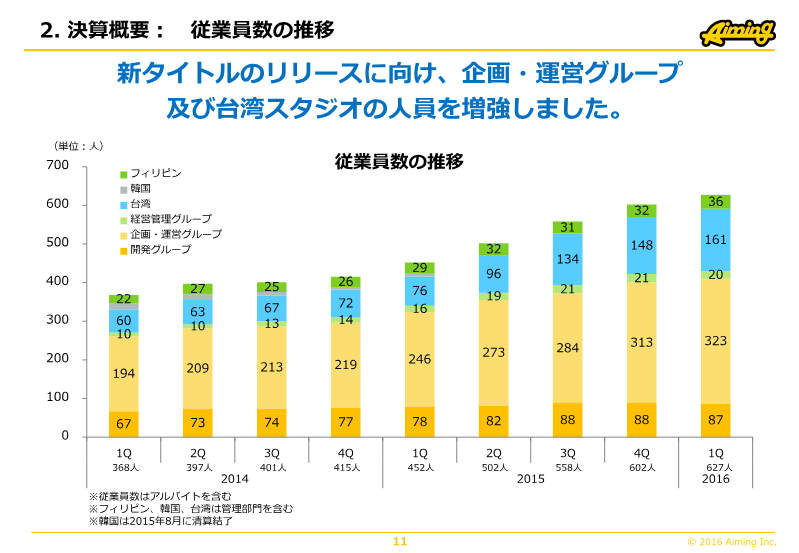

Aiming FY2016 Q1 Financial Results Presentation
Aiming experienced a period of financial contraction during the first quarter of fiscal year 2016, characterized by a year-over-year decline in both revenue and profit.
- Aiming experienced a year-over-year decline in revenue and profit in FY2016 Q1, primarily due to the end of major promotions and contract projects.
- Despite the decline, Aiming exceeded its internal operating profit forecast for FY2016 Q1, achieving 101.9% of its projection.
- The company is currently developing 11 new titles, with a strong focus on the MMO genre, using both proprietary development and licensed IP.
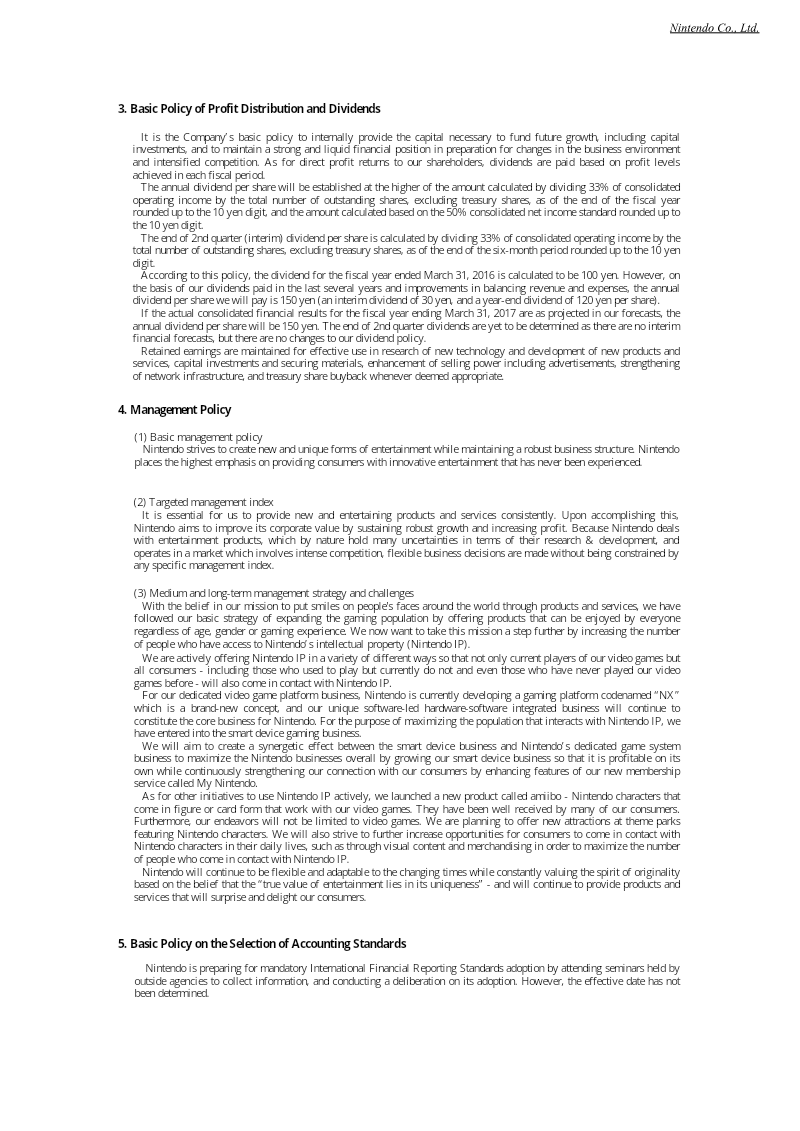
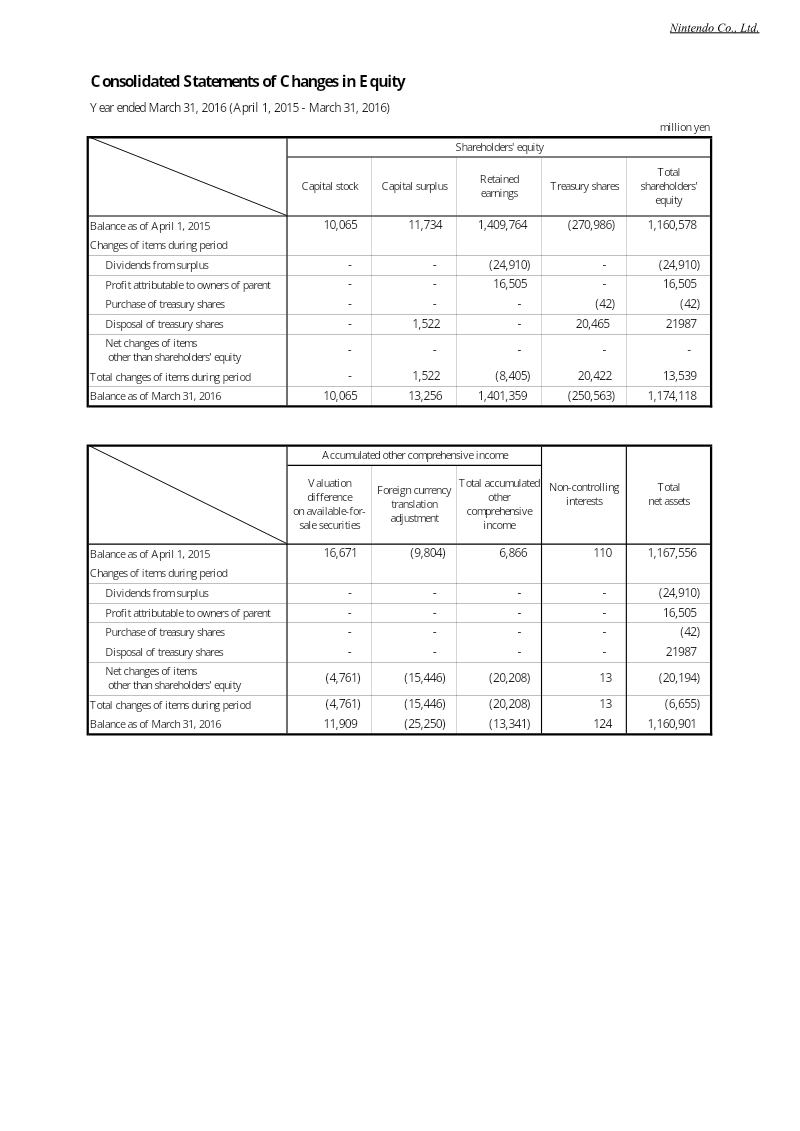
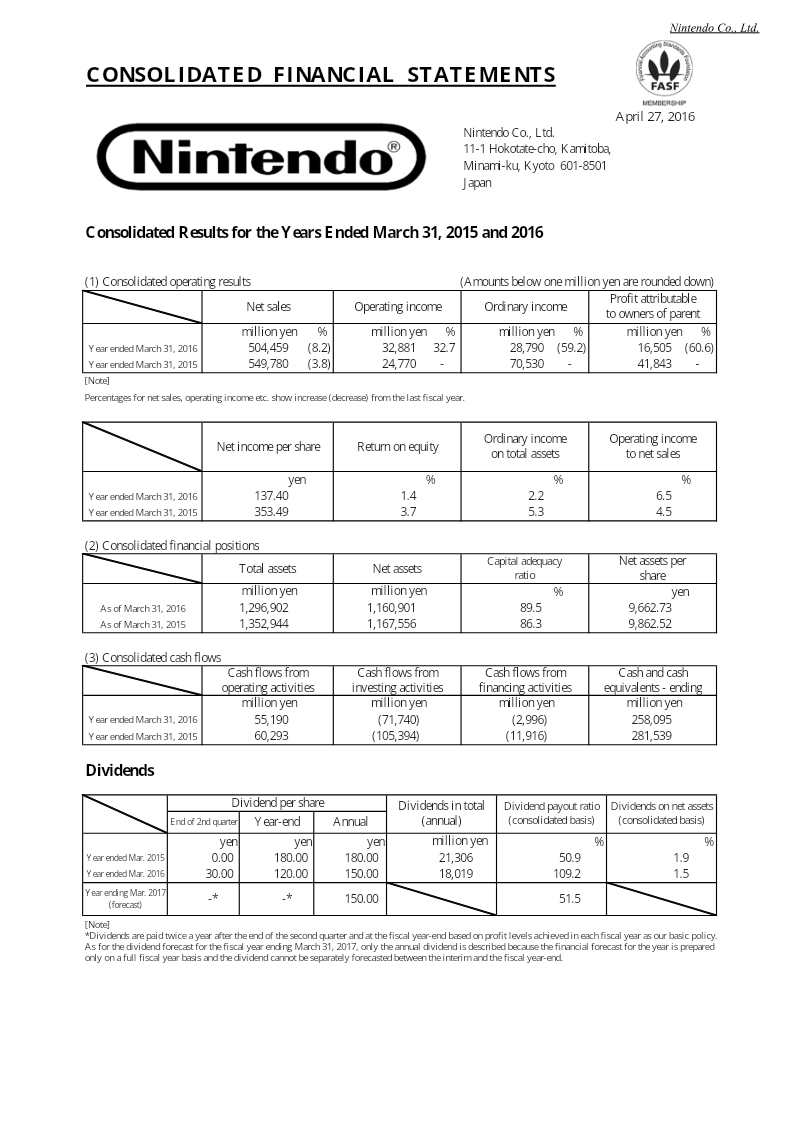
Nintendo Consolidated Results for the Years Ended March 31, 2015 and 2016
Nintendo’s financial performance for the fiscal year ending March 31, 2016, reflects a period of transition characterized by a decline in core hardware and software sales.
- Nintendo's consolidated net sales for the fiscal year ended March 31, 2016 fell to 504.5 billion yen from 549.8 billion yen the prior year, a decline of about 8%, with operating income at 32.8 billion yen.
- The decline is attributed mainly to a lack of major software releases for the 3DS and Wii U, which the company frames as a cyclical lull in its traditional gaming business.
- Nintendo is diversifying beyond dedicated consoles, with an aggressive push into the smart device gaming market and wider use of its intellectual property portfolio.

Gravity Co., Ltd. 20‑F Annual Report for Fiscal Year Ended December 31, 2015
Gravity Co., Ltd. filed a U.S. SEC 20-F for fiscal year 2015, reporting a sharp decline in profitability and revenue concentration around its flagship online title, Ragnarok Online.
- Gravity Co., Ltd. faces significant revenue concentration risk, with 41% of total revenue derived from the aging flagship title Ragnarok Online, which is currently experiencing declining user numbers.
- Despite a 12% decline in total revenue to US$57.5 million, the company reported a net income of US$12.8 million in 2015, reversing a US$20.5 million loss from the previous year.
- Operating losses widened to KRW 17,229 million due to a 29% increase in operating expenses and a KRW 5,849 million impairment loss on intangible assets.
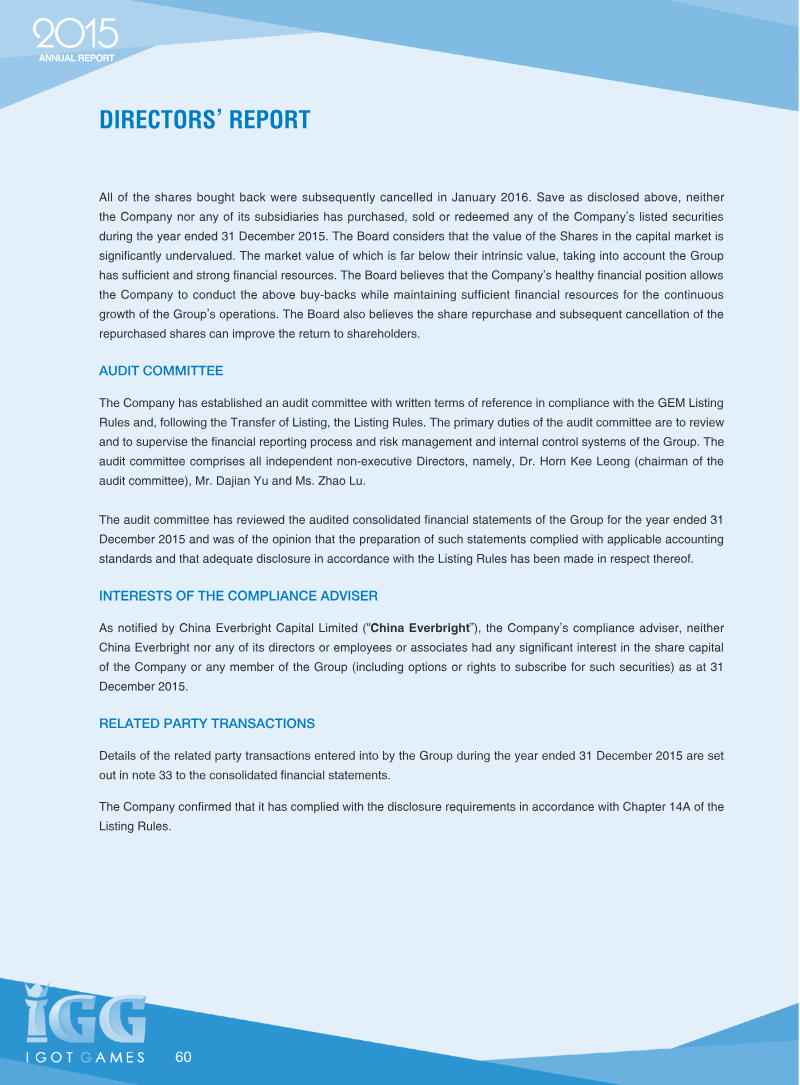
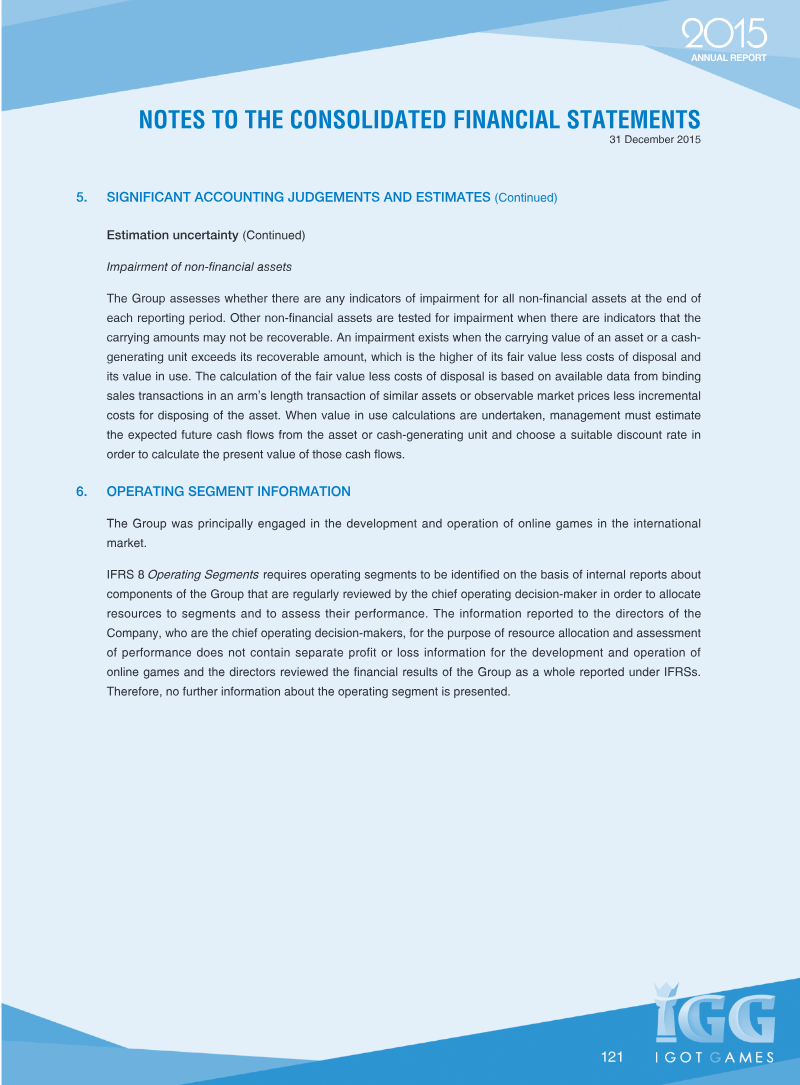
IGG Inc. Annual Report 2015
The 2015 Annual Report for IGG Inc. details a pivotal year of transition and consolidation as the company successfully migrated its listing from the Growth Enterprise Market to the Main Board of the Hong Kong Stock Exchange.
- IGG Inc. successfully transitioned its listing from the Growth Enterprise Market to the Main Board of the Hong Kong Stock Exchange in 2015.
- Mobile gaming became the company's core revenue driver, accounting for 94% of total annual revenue.
- Annual revenue remained stable at US$202.5 million, while net profit declined to US$41.2 million from US$66.4 million due to higher R&D, administrative costs, and new tax regulations.
CD PROJEKT Group: 2015 Financial Results and Business Strategy
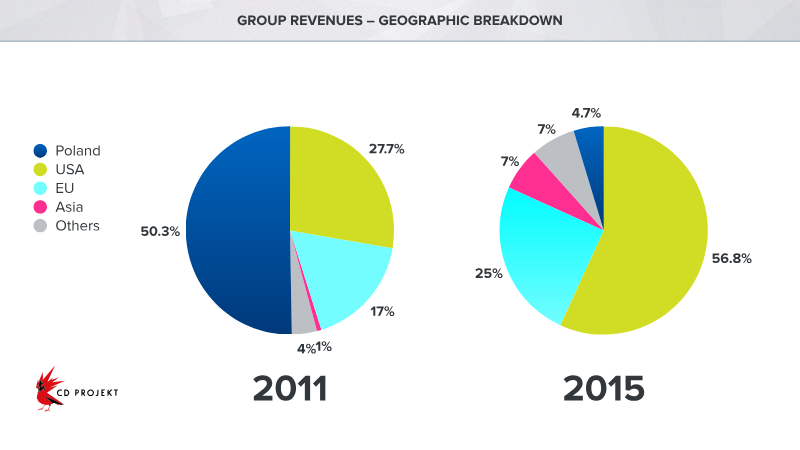
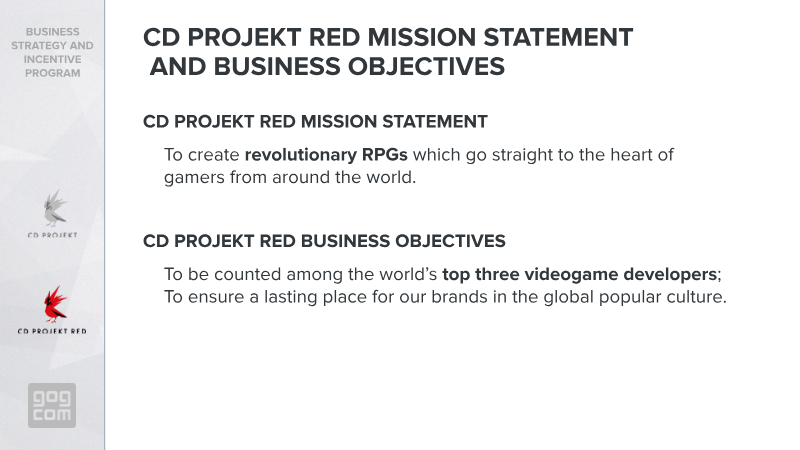
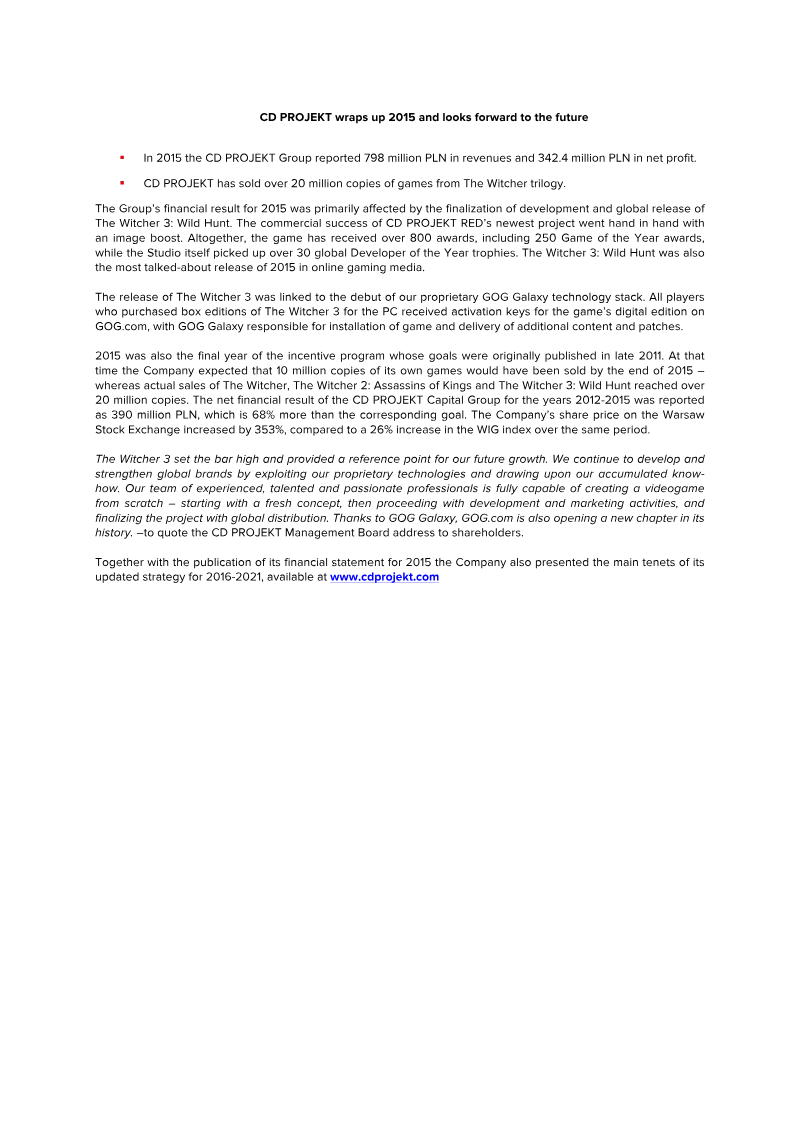
The CD PROJEKT Group’s 2015 financial summary and 2016–2021 business strategy outline the company’s transition from a successful single-franchise developer to a multi-project global entity.
- CD PROJEKT reported a 2015 net profit of 342.4 million PLN and a year-end cash position of 393.6 million PLN, largely driven by the commercial success of The Witcher 3: Wild Hunt.
- The 2016–2021 strategic roadmap centers on scaling the company into a multi-project developer capable of supporting simultaneous AAA releases, including Cyberpunk 2077 and a second major RPG.
- Digital distribution accounted for 68.4% of total revenue in 2015, signaling a permanent shift in the company's sales model.
CD PROJEKT FY 2015 Financial Results
The 2015 fiscal year represented a transformative period for the CD PROJEKT Group, driven primarily by the global launch and commercial success of The Witcher 3: Wild Hunt.
- CD PROJEKT recorded 798 million PLN in total revenue and 342.4 million PLN in net profit for fiscal year 2015, driven by the launch of The Witcher 3: Wild Hunt.
- The Witcher trilogy surpassed 20 million cumulative units sold, doubling the company's initial 10-million-unit sales projection established in 2011.
- CD PROJEKT’s share price on the Warsaw Stock Exchange increased by 353% between 2012 and 2015, significantly outperforming the 26% growth of the broader WIG index.
Management Board Report on CD PROJEKT S.A. Activities: 2015
The year 2015 marked a transformative period for CD PROJEKT S.A., characterized by unprecedented financial growth and the global elevation of its brand.
- CD PROJEKT S.A. achieved record 2015 financial results with 698.2 million PLN in sales revenue and a consolidated net profit of 336.2 million PLN, driven by the launch of The Witcher 3: Wild Hunt and its expansion.
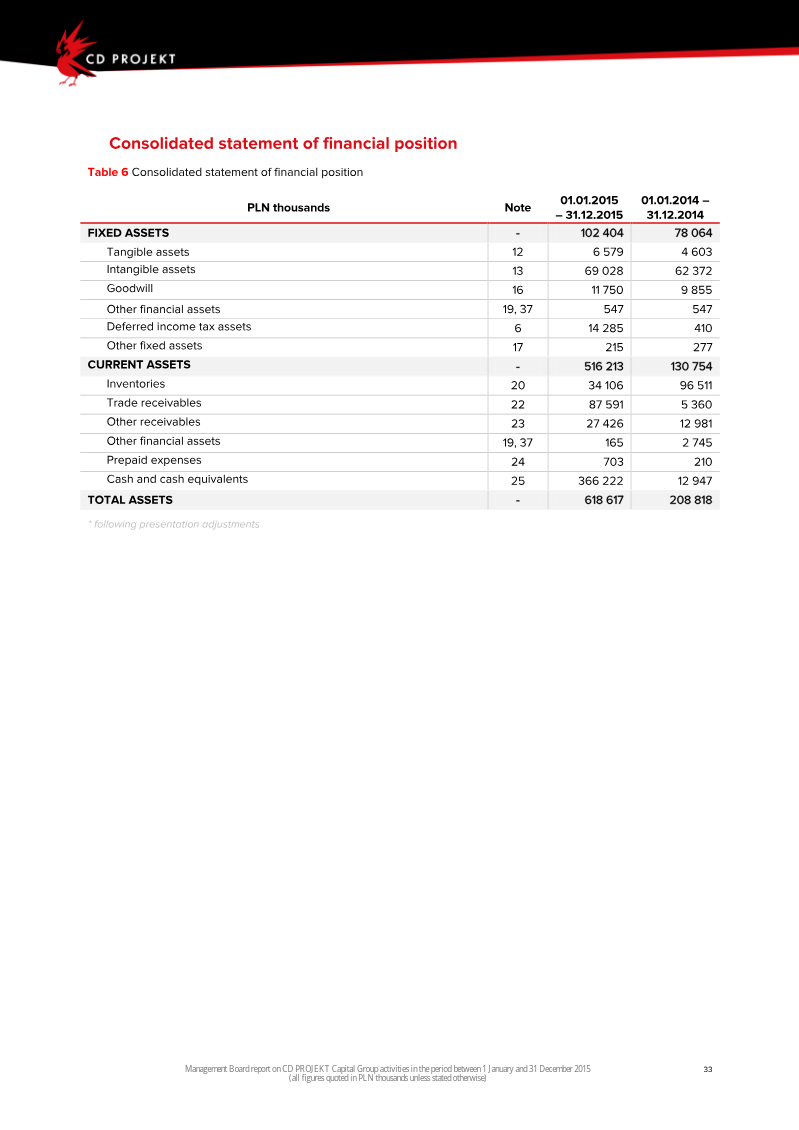
- The company ended 2015 with a robust cash position of 366.2 million PLN, zero outstanding debt, and a market capitalization exceeding 2.1 billion PLN, leading to its inclusion in the WIG30 index.
- The organization has transitioned to a two-franchise development model, prioritizing the long-term production of Cyberpunk 2077 alongside its established role-playing game portfolio.
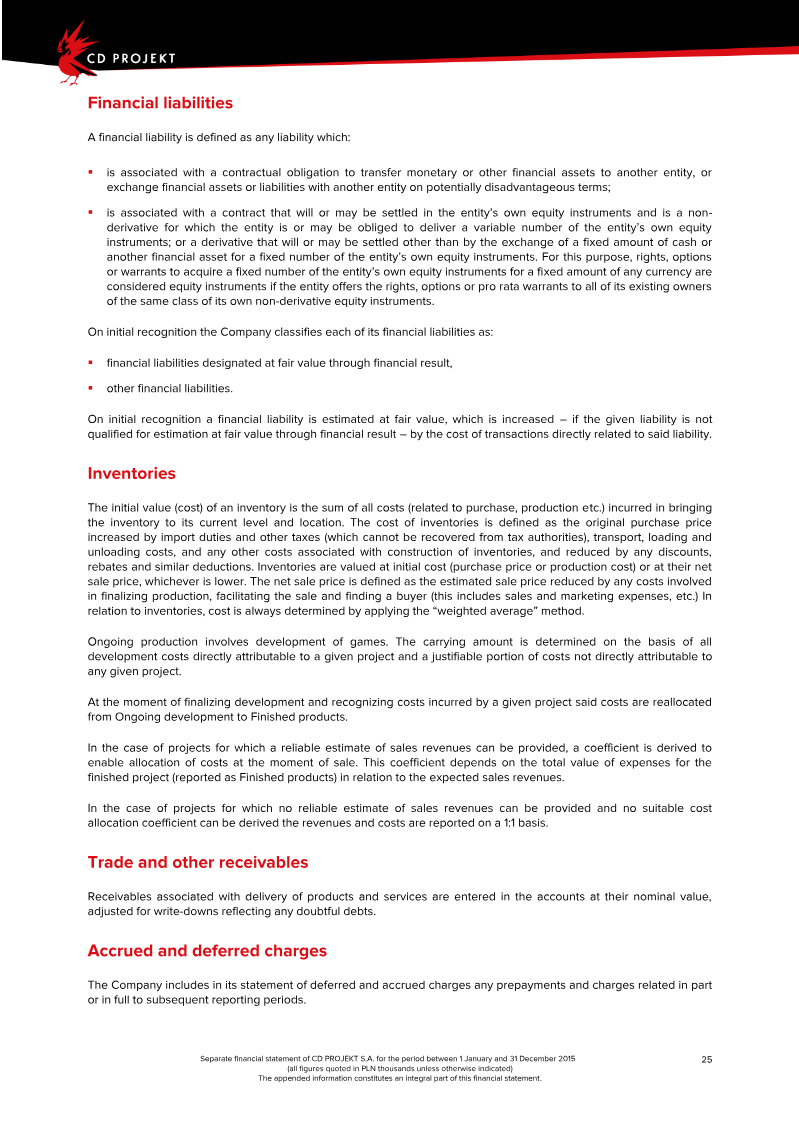
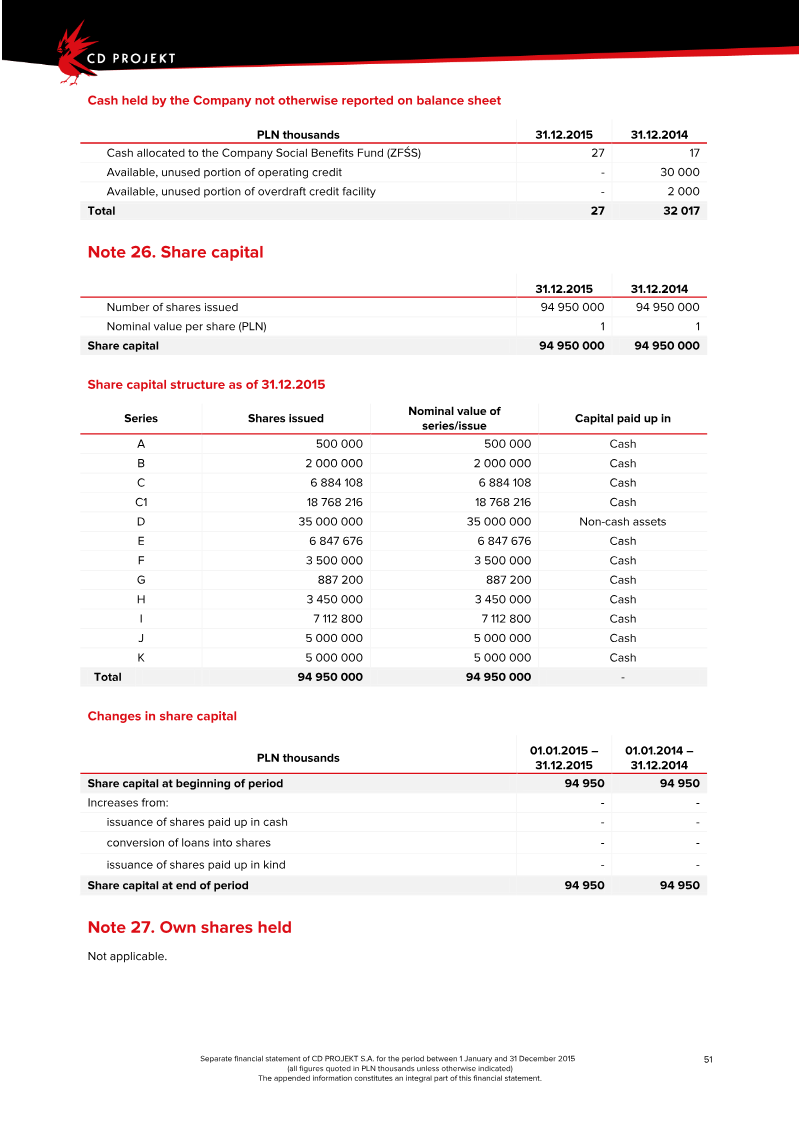
Financial Statement of CD PROJEKT S.A. for the Fiscal Year 2015
The 2015 fiscal year marked a period of profound financial transformation for CD PROJEKT S.A., characterized by a shift from a net loss of 12.4 million PLN in 2014 to a robust net profit of 336.2 million PLN.
- CD PROJEKT S.A. achieved a significant financial turnaround in 2015, moving from a 12.4 million PLN net loss in 2014 to a 336.2 million PLN net profit.
- Annual sales revenue surged to 715.9 million PLN, supported by total assets valued at 618.6 million PLN.
- The company eliminated all outstanding bank credit and loan obligations by the end of 2015, maintaining a liquidity position of 366.2 million PLN in cash and cash equivalents.