2015
Company
Documents about 2015



Fiscal Year Ending March 2016: 1st Half Financial Results
Koei Tecmo Holdings presents a financial analysis for the first half of the fiscal year ending March 2016, highlighting a period of strategic transition toward digital and global expansion.
- Koei Tecmo exceeded profit forecasts for the first half of fiscal year 2016, with operating profit reaching 2,477 million yen (45.7% above projections) and net income rising 3.4% to 4,061 million yen.
- Despite a 5.9% year-over-year decline in net sales to 15,159 million yen, profitability was bolstered by high-margin digital download sales and increased royalty revenue from collaboration titles.
- The Asian market emerged as a key growth driver, recording a 75.9% increase in sales and a 132.6% rise in unit volume, even as Japan remained the primary market at 74.9% of total sales.
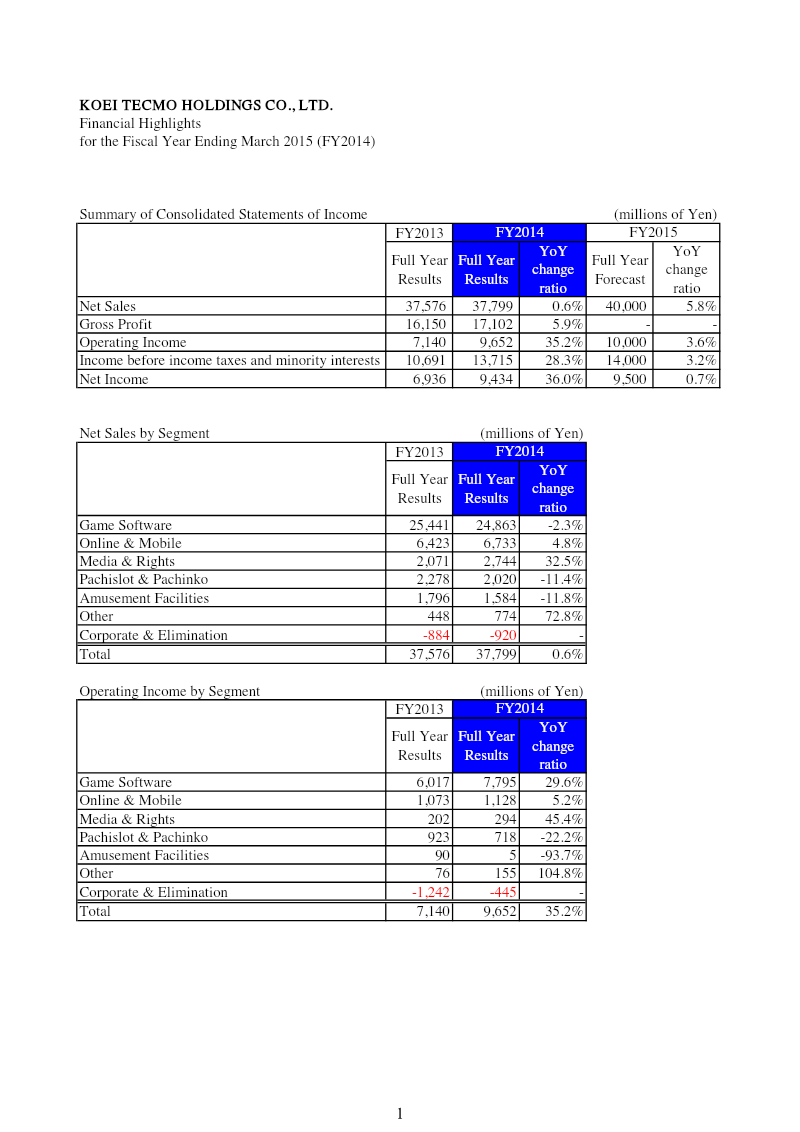
Financial Highlights for the Fiscal Year Ending March 2015 (FY2014)
Koei Tecmo Holdings achieved significant profitability growth during the fiscal year ending March 31, 2015, despite relatively flat top-line revenue.
- Koei Tecmo Holdings achieved a 35.2% surge in operating income to 9.65 billion yen and a 36% increase in net income to 9.4 billion yen for the fiscal year ending March 2015, despite net sales remaining nearly flat at 37.8 billion yen.
- The game software division, while seeing a 2.3% decline in revenue to 24.9 billion yen, improved its operating income by nearly 30% due to a more profitable product mix or reduced development costs.
- The media and rights division demonstrated strong growth with a 32.5% increase in sales, contributing to the company's overall shift toward higher-margin business activities.
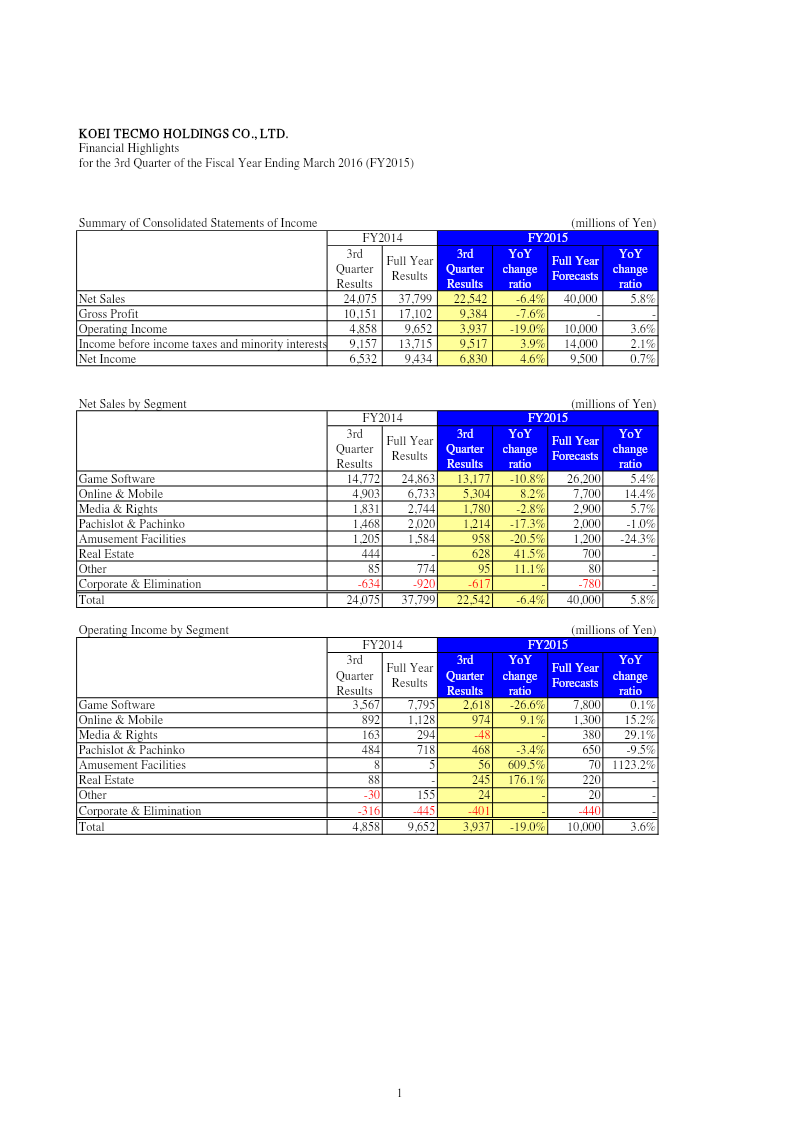
Financial Highlights for the 3rd Quarter of the Fiscal Year Ending March 2016 (FY2015)
Koei Tecmo Holdings reported its financial results for the third quarter of the fiscal year ending March 2016, revealing a period of mixed performance characterized by declining top-line revenue but improved net profitability.
- Koei Tecmo reported a 4.6% increase in net income to 6.83 billion yen for the nine-month period ending December 31, 2015, despite a 6.4% decline in net sales to 22.54 billion yen.
- Operating income fell 19.0% year-over-year to 3.94 billion yen, as the company relied on strong non-operating figures to bolster its bottom line.
- The core Game Software division struggled with a 10.8% drop in sales and a 26.6% decline in operating income.
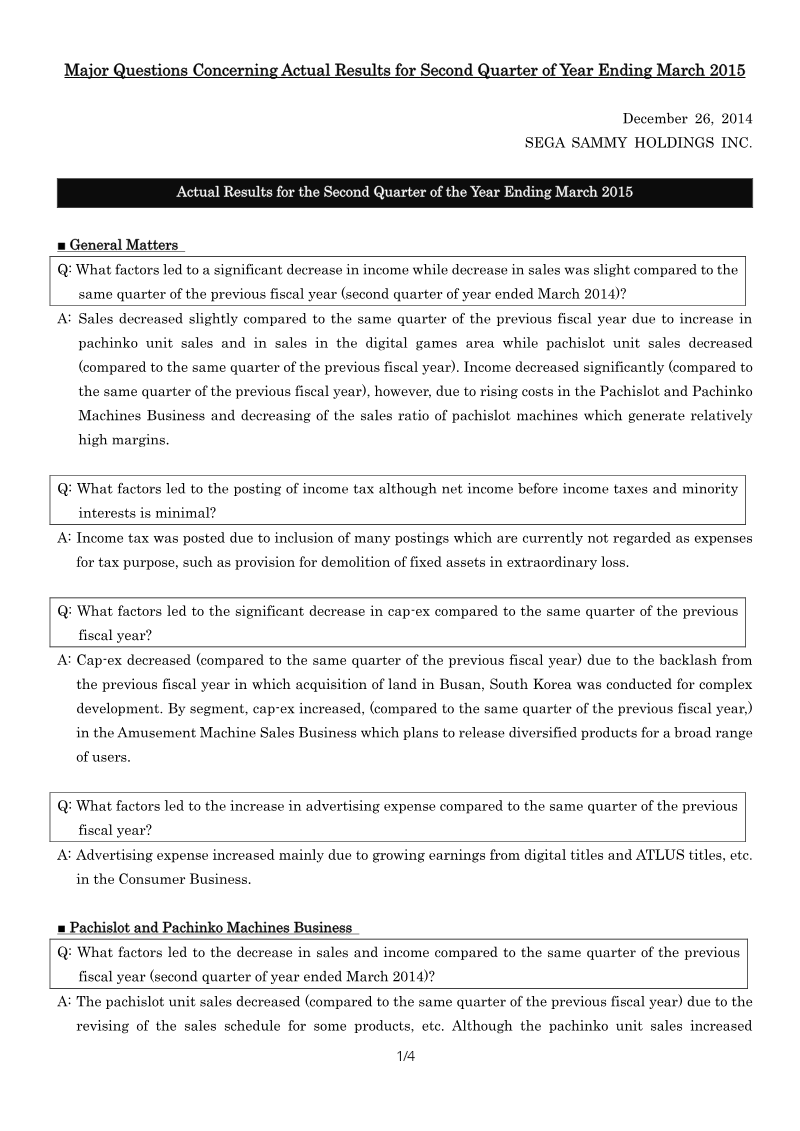
Sega Sammy Holdings: Actual Results for the Second Quarter of the Year Ending March 2015
Sega Sammy Holdings’ financial results for the second quarter of the fiscal year ending March 2015 reveal a period of significant income contraction despite relatively stable sales.
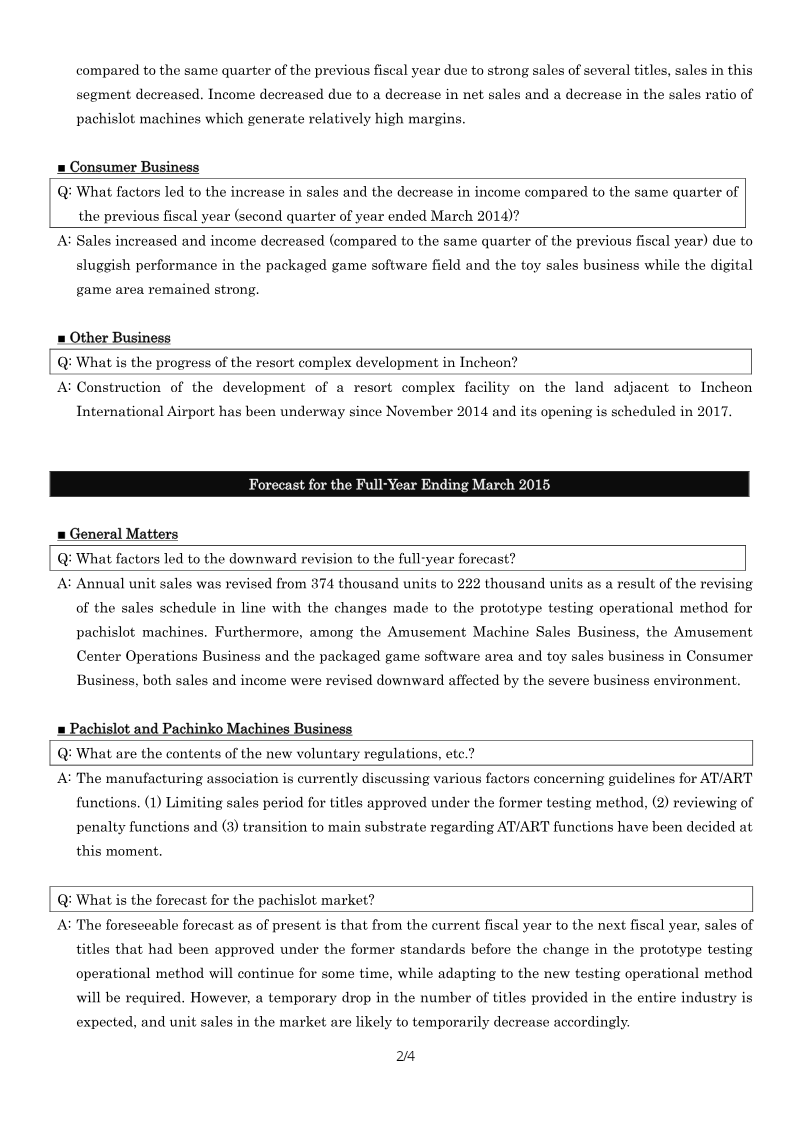
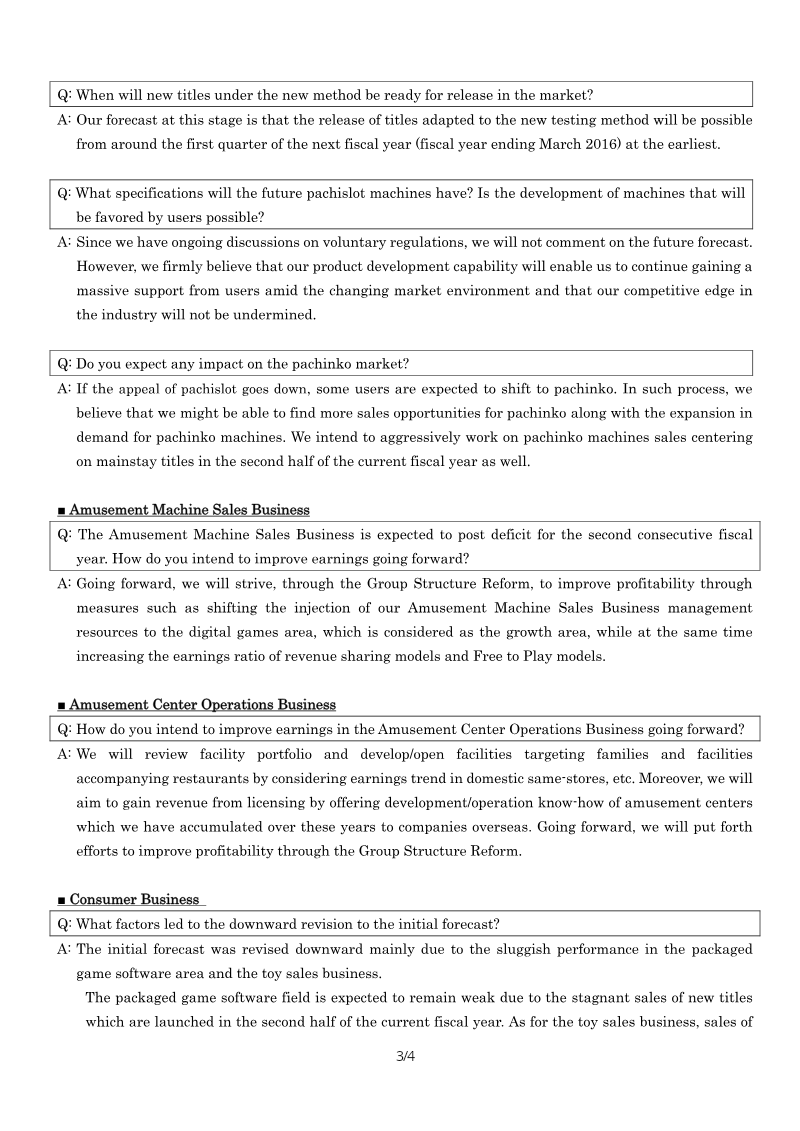
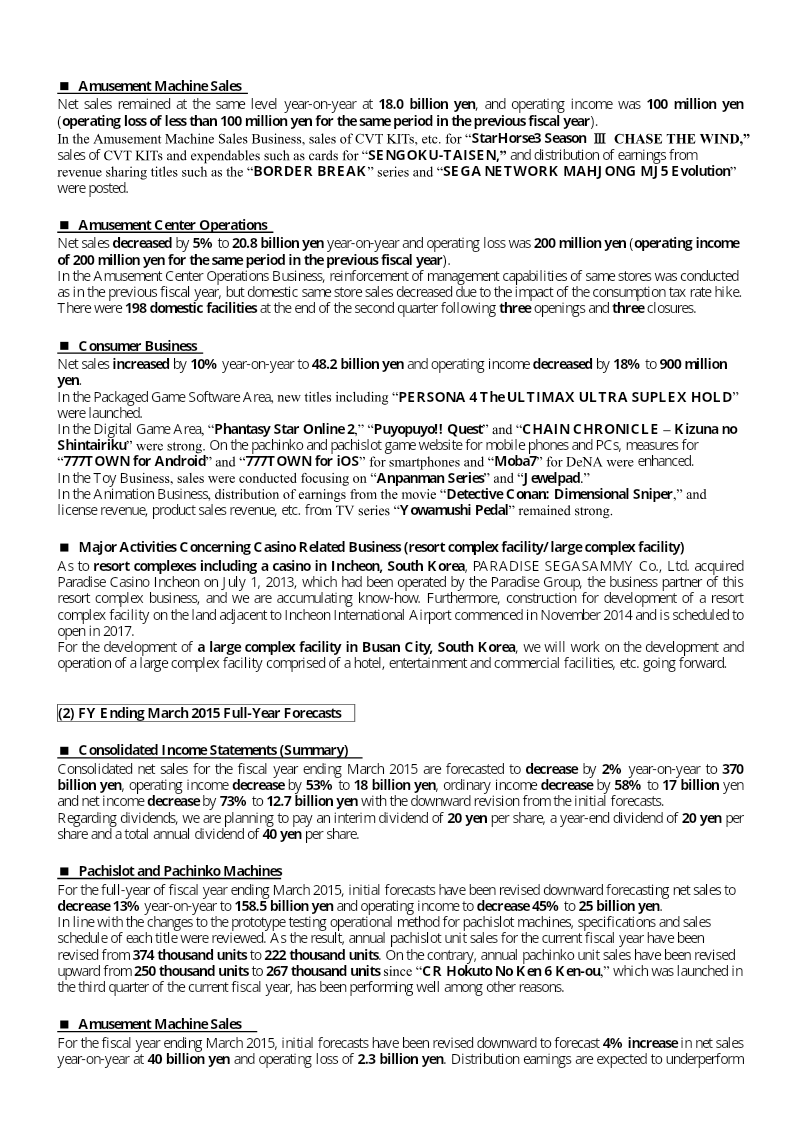
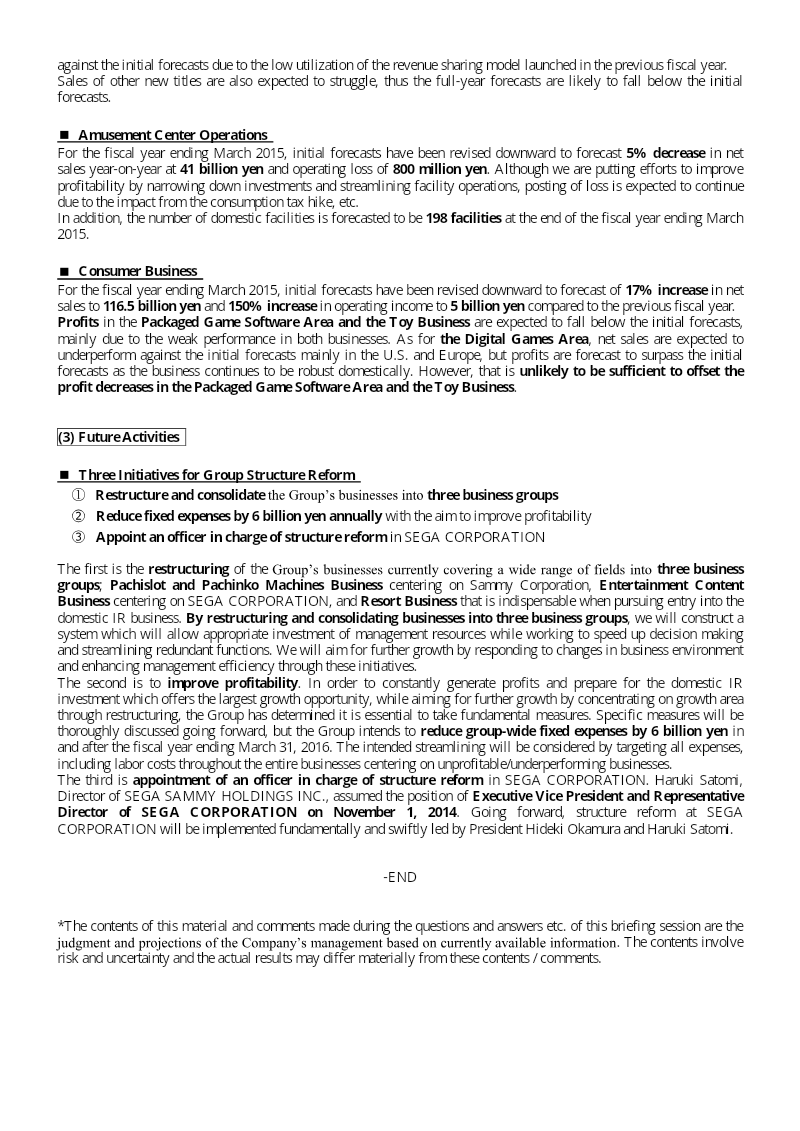
- Sega Sammy Holdings has significantly lowered its full-year sales forecast for pachislot machines from 374,000 to 222,000 units due to regulatory changes in prototype testing.
- The company is launching a Group Structure Reform targeting a 6 billion yen reduction in fixed expenses across all business segments to combat declining profitability.
- New pachislot titles compliant with updated voluntary regulations regarding AT/ART functions are not expected to reach the market until the first quarter of the following fiscal year.
Sega Sammy Holdings Q2 FY Ending March 2015 Results: Summary of Results
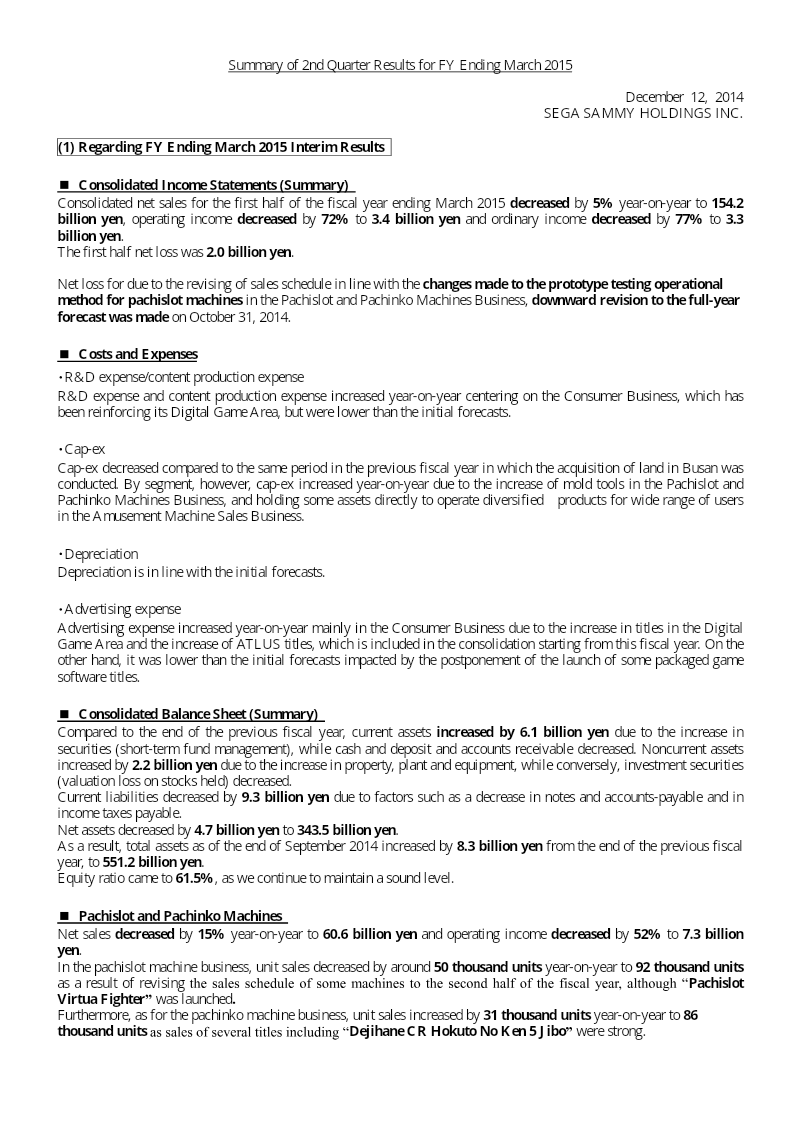
Sega Sammy Holdings reported a challenging first half for the fiscal year ending March 2015, characterized by a 5% year-on-year decline in consolidated net sales to 154.2 billion yen and a significant 72% drop in operating income to 3.4 billion yen.
- Sega Sammy reported a net loss of 2.0 billion yen for the first half of FY2015, driven by a 5% decline in net sales to 154.2 billion yen and a 72% drop in operating income.
- Pachislot and Pachinko segment sales fell 15%, forcing a major downward revision of annual pachislot unit sales projections from 374,000 to 222,000 units due to regulatory testing changes.
- The company is initiating a group-wide restructuring to consolidate operations into three core pillars: Pachislot and Pachinko, Entertainment Content, and Resort Business.

Marvelous Inc. First Half Results Briefing Materials: Fiscal Year Ending March 31, 2015
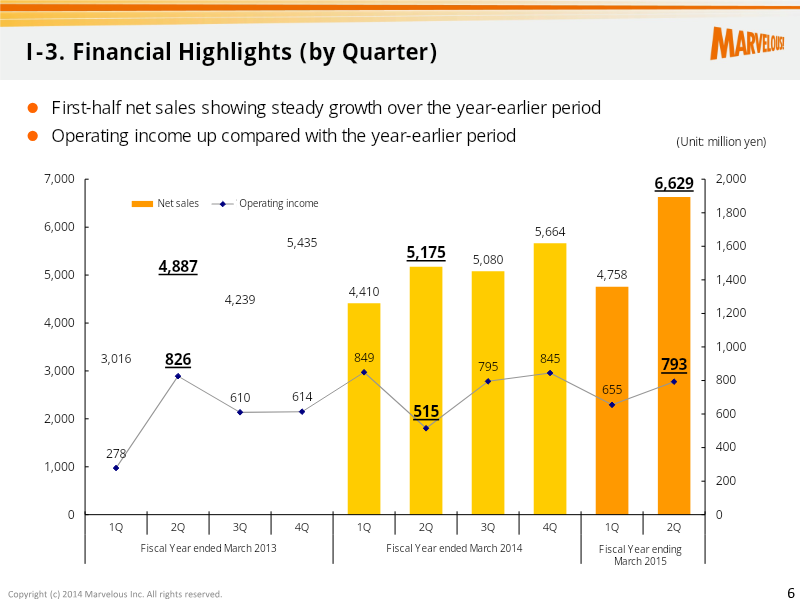
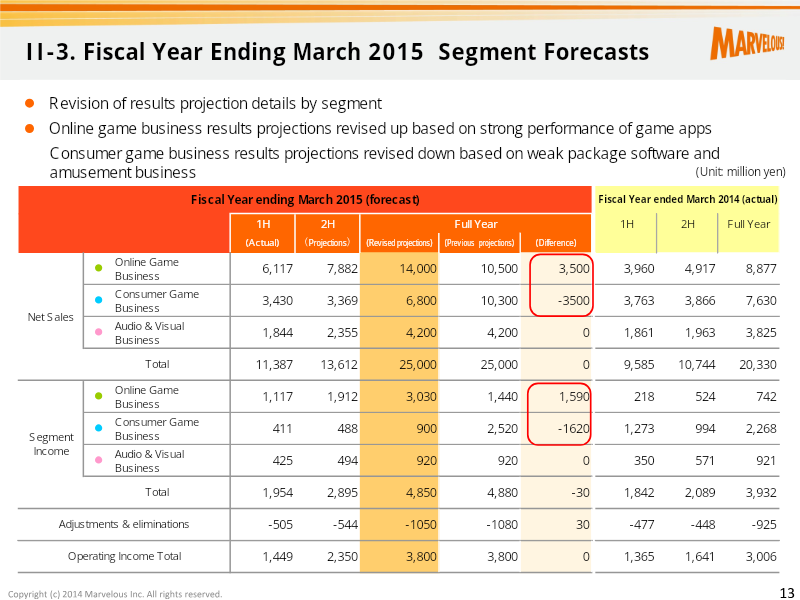
Marvelous Inc.’s first-half results for the fiscal year ending March 31, 2015, demonstrate a period of strategic transition characterized by robust growth in digital gaming offset by contraction in traditional consumer software.
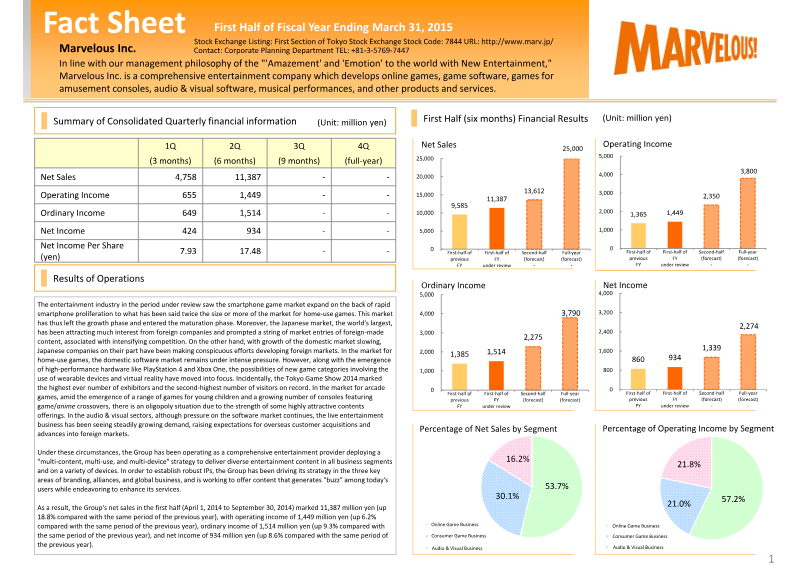
- Marvelous Inc.'s first-half results for the fiscal year ending March 31, 2015 showed net sales up 18.8% to 11,387 million yen and operating income up 6.2% to 1,449 million yen year over year.
- The online game business was the main growth engine, with segment sales up 154% to 6,117 million yen, driven by native mobile applications.
- The mobile title "Logres of Swords and Sorcery: Goddess of Ancient" reached four million downloads during the period and was the key driver of online growth.
Marvelous Inc. Financial Results: First Half of Fiscal Year Ending March 31, 2015
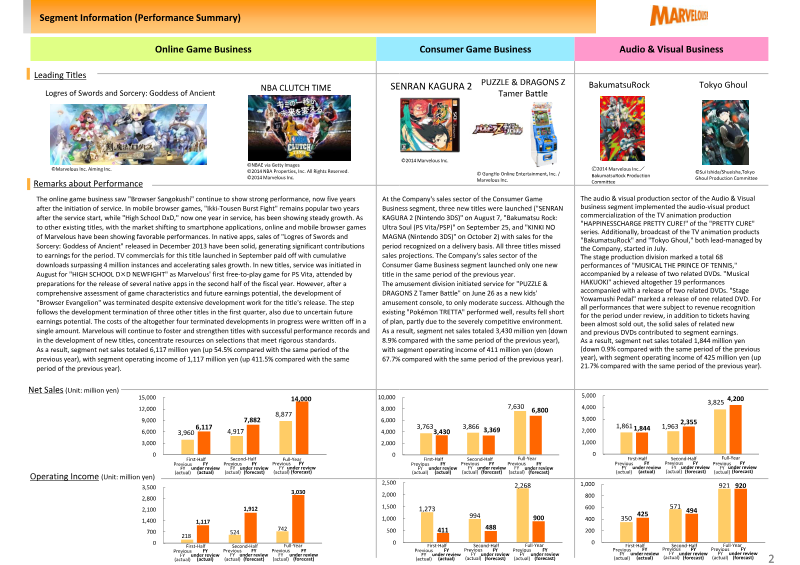
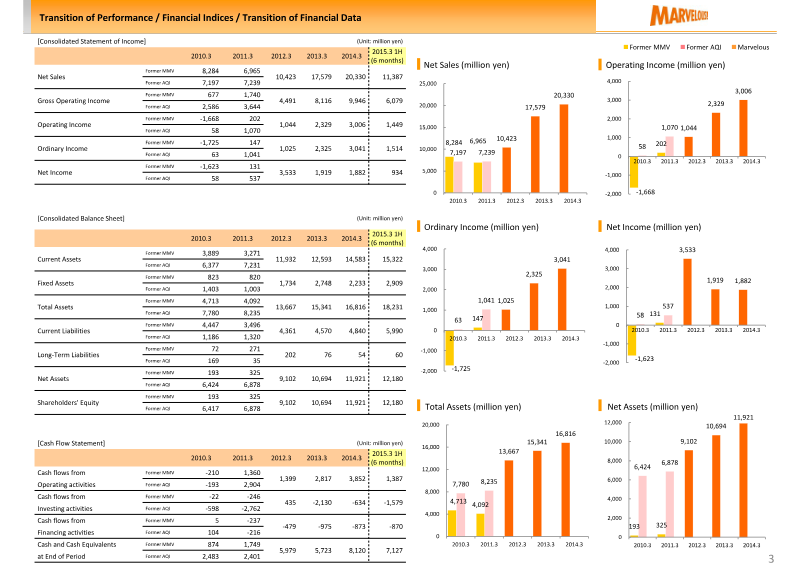
Marvelous Inc. presents its financial performance for the first half of the fiscal year ending March 31, 2015, detailing its operations as a comprehensive entertainment provider.
- Marvelous Inc. posted H1 FY2015 (six months to Sept 30, 2014) net sales of 11,387 million yen, up 18.8% year over year.
- Operating income reached 1,449 million yen, up 6.2%, while ordinary income rose 9.3% and net income 8.6%; profit grew more slowly than sales.
- The online game segment drove growth, supported by continued popularity of established titles and solid performance of native smartphone applications.

Condensed Interim Consolidated Financial Statement: CD Projekt Capital Group Q3 2014
The CD Projekt Capital Group’s financial position as of the third quarter of 2014 reflects a transitional period characterized by heavy investment in future intellectual property and strategic operational restructuring.
- CD Projekt Capital Group reported 110.75 million PLN in revenue and a 1.62 million PLN net profit for the first nine months of 2014, despite a 3 million PLN net loss in Q3.
- The company is in a high-expenditure phase, prioritizing development and global marketing for The Witcher 3: Wild Hunt and Cyberpunk 2077.
- As of September 30, 2014, the group held 265.91 million PLN in total assets and a cash position of 45.05 million PLN.
Digital Turbine Form 10-Q: Q2 FY2015
Digital Turbine, formerly known as Mandalay Digital Group, operates as a provider of end-to-end mobile content and monetization solutions, including application management, user discovery, and direct operator billing.
- Digital Turbine is pursuing a merger with Appia, involving the issuance of approximately 19 million shares and the assumption of roughly $10 million in debt, expected to close in the first quarter of calendar 2015.
- On October 9, 2014, the company acquired mobile app recommendation and search assets from Xyologic Mobile Analysis (XYO) for $2.5 million in cash, with $375,000 held back for potential indemnities.
- As of September 30, 2014, the company held $16.7 million in cash and cash equivalents, down from $21.8 million at the beginning of the period.
COLOPL 4Q FY Sep. 2014 Operating Results
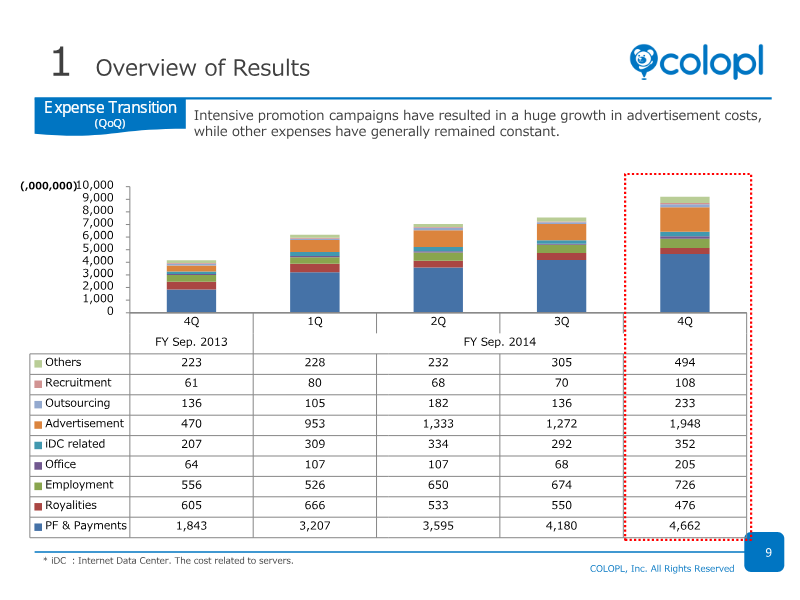
The fiscal year ending September 2014 represented a period of significant financial growth for COLOPL, characterized by a 2.4-fold increase in annual sales to 53.57 billion yen and a 3.1-fold rise in operating profit to 23.60 billion yen.
- COLOPL's FY ended September 2014 sales rose 2.4x to 53.57 billion yen, and operating profit rose 3.1x to 23.60 billion yen.
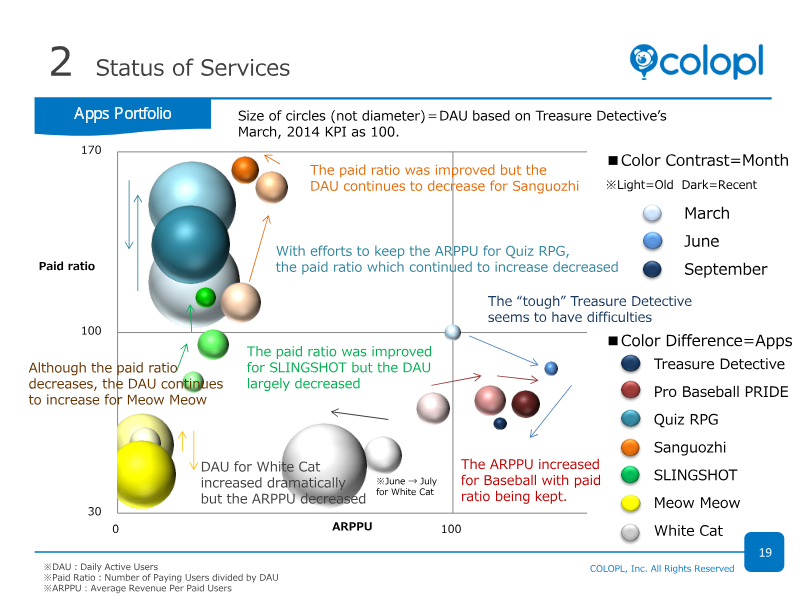
- Growth was driven mainly by the July 2014 launch of "White Cat Project," which added to steady revenue from existing titles "Quiz RPG," "Sanguozhi," and "Pro Baseball PRIDE."
- The company transitioned to a native smartphone-focused model and grew active users 30% quarter-on-quarter by fiscal year-end.
Nippon Ichi Software Q2 FY2015 Financial Results
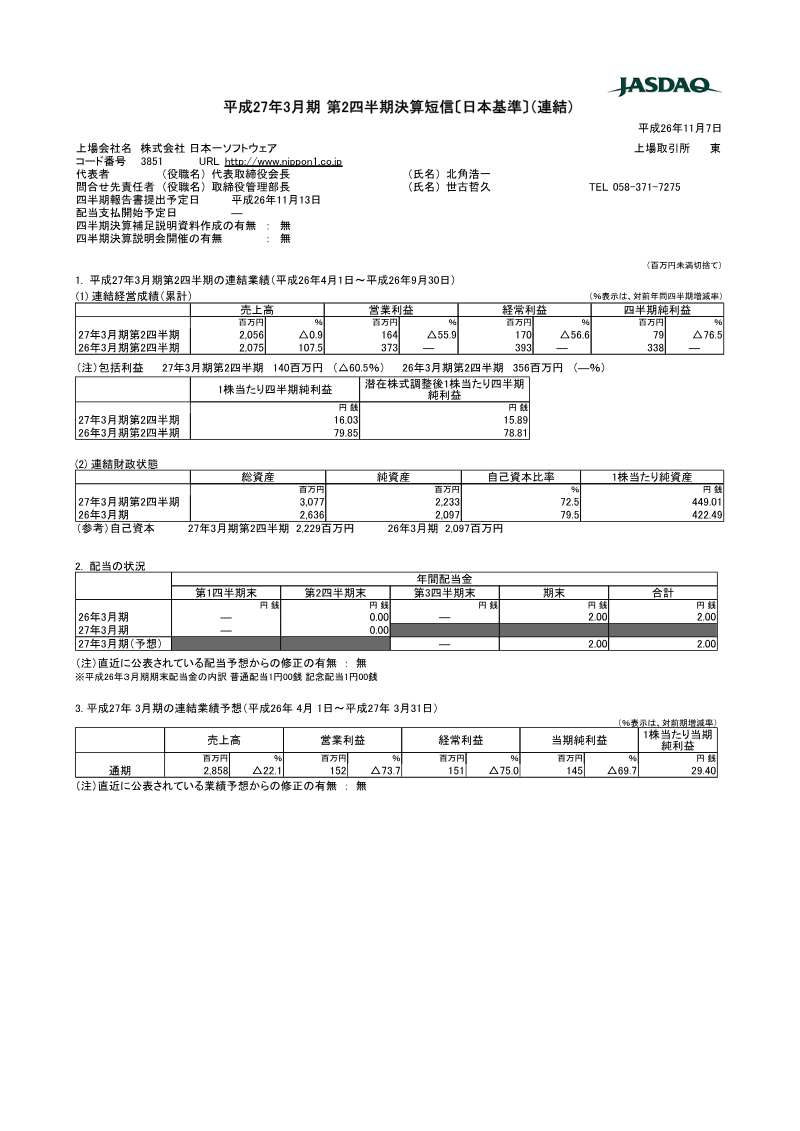
The Nippon Ichi Software financial results for the second quarter of the fiscal year ending March 2015 detail a period of significant earnings contraction.
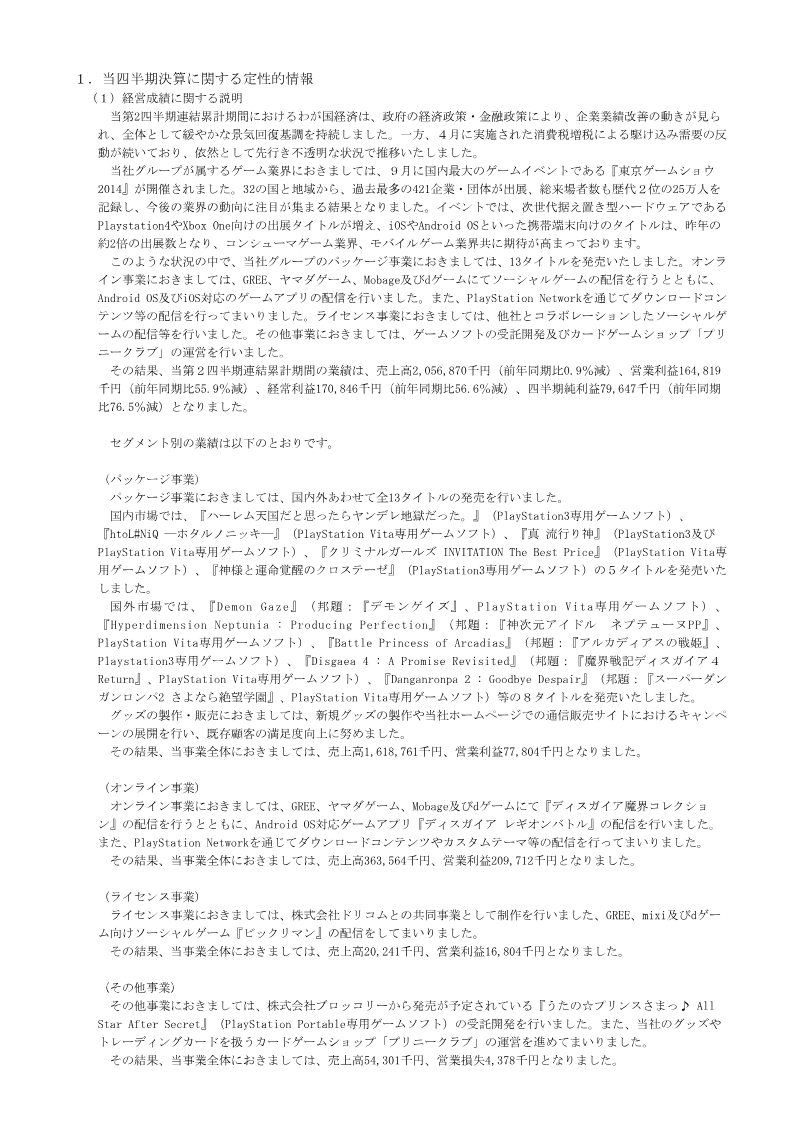
- Nippon Ichi Software experienced a sharp decline in profitability for the six-month period ending September 30, 2014, with operating profit falling 55.9% to 164 million yen and net profit dropping 76.5% to 79 million yen.
- Consolidated net sales remained relatively stable at 2,056 million yen, representing only a marginal 0.9% decrease compared to the same period in the previous fiscal year.
- The package software segment, which released 13 titles, generated 1,618 million yen in sales but yielded a lower operating profit of 77 million yen compared to the online segment.


Bandai Namco Holdings FY2015.3 2nd Quarter Results Presentation
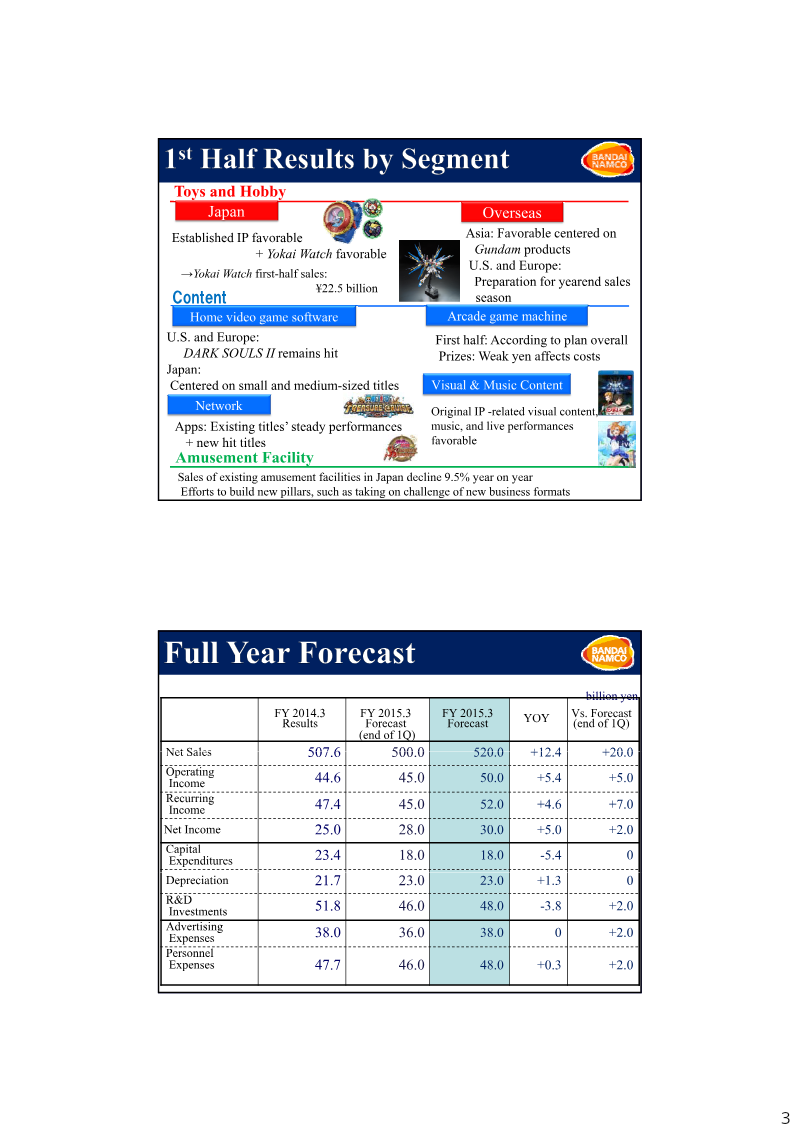
The Bandai Namco Holdings fiscal year 2015 second-quarter results presentation outlines the company’s financial performance for the first half of the fiscal year ending March 2015 and provides updated full-year forecasts.
- Bandai Namco raised its full-year fiscal 2015 projections to 520 billion yen in sales and 50 billion yen in operating income following a strong first-half performance.
- First-half net sales reached 259.3 billion yen with an operating income of 31.8 billion yen, both exceeding initial company forecasts.
- The Toy and Hobby segment generated 106.3 billion yen in sales, driven primarily by the commercial success of the Yokai Watch and Gundam intellectual properties.