Monetization

249 documents·90 publishers

Documents

Page 1
Report9 pages

Beyond the Game: How Gamification is Becoming Mainstream

The analysis examines how gamification—applying game‑like mechanics such as streaks, leaderboards, and reward loops—to non‑gaming consumer apps has shifted the mobile app economy over a five‑year period (2020‑2025). Data from 208 transactions totaling $20.7 billion reveal that EdTech, Fitness & Wellness, and Entertainment & Social are the primary verticals, with deal value shares of roughly 40 %, 37 %, and 23 % respectively. EdTech dominates both deal volume (43 %) and exit activity, accounting for 45 % of exits and 34 % of exit value, indicating a mature market attractive to strategic buyers. Fitness & Wellness shows concentrated exits in two mega‑deals (Headspace $3 billion, Fitbit $2.1 billion) but a broader spread of capital across many platforms, suggesting growth potential beyond the top brands. Entertainment & Social receives steady, diversified investment; its exits lean toward IPOs (e.g., Reddit, NetEase Cloud Music) rather than M&A, reflecting limited strategic buyer appetite.

Capital flows peaked during the 2020‑21 COVID boom but recovered quickly for gamified apps, with 2024 stabilizing and 2025 YTD already surpassing full‑year 2024 figures. Seed and Series A rounds remain active, while late‑stage activity accelerated in 2025 following earlier Series A momentum. Early‑stage capital is evenly split between Fitness & Wellness and Entertainment & Social, highlighting a white‑space opportunity, whereas EdTech shows limited early‑stage activity due to market consolidation.

The report underscores that non‑gaming apps have overtaken mobile games in net revenue (Q2 '25: $21.2 billion vs. $19.8 billion) and are driving 24 % YoY mobile spend growth, while games stagnated. This structural shift signals that institutional capital increasingly targets gamified consumer apps across these three verticals, with strategic buyers actively consolidating the EdTech segment and exploring IPO pathways in Entertainment & Social.

  • Gamified non-gaming apps have surpassed mobile games in net revenue, generating $21.2 billion in Q2 2025 compared to $19.8 billion for games.
  • Gamified apps are driving a 24% year-over-year growth in mobile consumer spending, while traditional mobile gaming revenue has stagnated.
  • EdTech, Fitness & Wellness, and Entertainment & Social account for $20.7 billion in transaction value, with EdTech dominating deal volume (43%) and exit activity (45%).
  • Capital flow for gamified apps has recovered from the post-2021 decline, with 2025 year-to-date investment already exceeding the total figures for 2024.
  • Fitness & Wellness shows high growth potential with capital spread across many platforms, despite being anchored by mega-deals like the $3 billion Headspace and $2.1 billion Fitbit acquisitions.
+2
InvestGame
Page 1
Report9 pages

The Future of Ad Monetization: Insights from Industry Leaders

The panel “The Future of Ad Monetization” presented at Gamesforum Barcelona 2026 focuses on the evolving role of advertising within mobile game economies, arguing that ads are no longer ancillary revenue but integral to core gameplay loops. Experts from PlayPack, GameBiz Consulting, and Nekki highlight that by 2025 ad monetization has become one of the most challenging systems, requiring creative integration and data‑driven adaptivity. PlayPack’s Merge Away example illustrates how hybrid models combining rewarded ads and in‑app purchases can drive profitability, yet misaligned user cohorts can cause revenue drops of up to 30 %. The discussion stresses the necessity of real‑time visibility into ad source performance and the importance of designing ad moments as optional, rewarding side quests rather than punitive blockers.

GameBiz Consulting’s specialist notes that newer formats such as App Open, audio, and immersive ads have yet to achieve widespread adoption due to user experience friction and lower eCPMs. He recommends cautious experimentation, high price floors for intrusive formats, and pairing ads with “no‑ads” purchase offers to mitigate churn. The panel also emphasizes that the future lies in contextual, segmented ad experiences—matching the player’s motivation and session flow—to transform ads from interruptions into meaningful choices.

Nekki’s head of monetization projects that the most valuable in‑game currency will shift from virtual goods to player time, advocating for adaptive ad systems that respect individual player preferences. He foresees LiveOps integration of dynamic, data‑driven ad touchpoints tied to progression events. Overall, the panel concludes that sustainable revenue will stem from a balance of data insight, empathetic design, and adaptive monetization strategies that treat ads as living components of the game ecosystem.

  • Hybrid monetization models that combine rewarded ads with in-app purchases are essential for profitability, but misaligned user cohorts can result in revenue losses of up to 30%.
  • Ad monetization has evolved into a core gameplay component that requires real-time visibility into source performance and data-driven adaptivity to remain effective.
  • Ad moments should be designed as optional, rewarding side quests rather than punitive blockers to maintain player retention and engagement.
  • Newer ad formats like App Open, audio, and immersive ads currently face limited adoption due to high user experience friction and lower eCPMs.
  • To mitigate churn, developers should pair intrusive ad formats with 'no-ads' purchase offers and implement high price floors for those formats.
+2
Gamesforum
Page 1
Report20 pages

A Shortcut to Your Own Game Insights Platform

The guide presents a turnkey solution for game studios to build an in‑house data pipeline without the high costs of custom engineering. It introduces two core offerings: Player Warehouse, a pre‑aggregated data hub delivered in SQL or Parquet to BigQuery, Redshift, Snowflake, or Spark; and Raw Export, a real‑time JSON stream that preserves all custom event fields for unstructured analysis. The document emphasizes that these services eliminate the need for proprietary SDKs, ETL development, and ongoing infrastructure maintenance, offering a cost‑effective alternative to building a data lake from scratch.

Key findings highlight that Player Warehouse provides daily refreshed event and player‑level tables, enabling analysts to run advanced SQL queries, blend data from mediation or attribution sources, and retain up to one year of historical data. Raw Export supports real‑time analytics, custom dashboards, and long‑term enrichment through AWS S3 or BigQuery exports. The guide cites case studies—such as a VR MMO that leveraged Player Warehouse to boost engagement and a publisher that increased LTV by 50% across 19 titles using Raw Export—illustrating tangible ROI gains.

The scope covers global game studios, with examples from iOS, Android, Steam, and VR platforms. Timeframes referenced include daily updates for Player Warehouse and real‑time streaming for Raw Export, while the data pipeline supports integration with major BI tools (Looker, Power BI, Data Studio) and mediation/attribution services. Methodologically, the platform handles data ingestion via SDKs, normalizes events, and stores them in a cloud warehouse, abstracting SQL handling from end users. The document concludes by positioning GameAnalytics as a privacy‑first, ISO‑27001 and SOC 2 compliant partner that delivers rapid deployment—hours rather than months—for studios seeking scalable, customizable analytics.

  • GameAnalytics provides a turnkey data pipeline that eliminates the need for custom ETL development, proprietary SDKs, and ongoing infrastructure maintenance.
  • The platform offers two primary data delivery methods: Player Warehouse for daily refreshed, SQL-ready event tables and Raw Export for real-time JSON streaming.
  • A publisher utilizing Raw Export achieved a 50% increase in lifetime value (LTV) across 19 titles, while a VR MMO leveraged Player Warehouse to improve player engagement.
  • The solution integrates with major BI tools like Looker, Power BI, and Data Studio, and supports data blending from external mediation and attribution sources.
  • Player Warehouse supports up to one year of historical data retention and delivers data directly to BigQuery, Redshift, Snowflake, or Spark.
+1
InvestGame
Page 1
Report5 pages

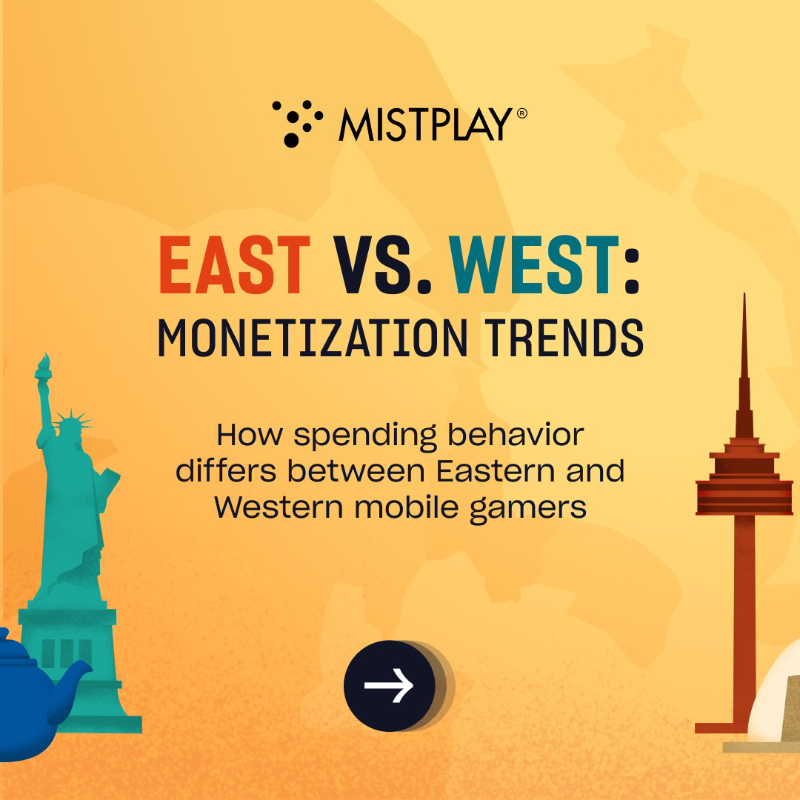
East vs. West: Monetization Trends

The study examines how mobile gaming spending patterns differ between Eastern and Western markets, focusing on frequency of purchases, average spend per transaction, and motivational drivers. Findings reveal that Eastern gamers purchase in‑app items more often than Western players; 35 % of East spend frequently versus 36 % in the West, with a higher proportion of occasional and rare spenders in the West. When it comes to transaction size, Eastern users tend to pay more per purchase: 76 % spend over $10 compared with only 42 % of Western users, while a smaller share of East spend under $5 (30 %) versus 8 % in the West. Motivational analysis shows that Western gamers prioritize value and bundles, whereas Eastern players are more attracted to exclusivity, limited‑time items, new offers, and character acquisition. The research covers key markets in Asia—Korea and Japan—and Western regions including the United States, United Kingdom, and broader Europe. Data were collected through a survey of mobile gamers across these regions, with sample sizes sufficient to compare spending behaviors and motivations. The report concludes that monetization strategies should be tailored regionally: value‑based bundles may resonate better in the West, while exclusive content and limited editions could drive higher spend in Eastern markets.

  • Eastern mobile gamers demonstrate a significantly higher propensity for large transactions, with 76% of purchases exceeding $10 compared to only 42% in Western markets.
  • Western mobile gamers are more likely to make small-scale purchases, with 8% of spenders in the West opting for transactions under $5, contrasted with 30% in the East.
  • Monetization strategies in the West should prioritize value-based bundles, as these resonate more effectively with the purchasing preferences of Western players.
  • Eastern markets, specifically Korea and Japan, show a stronger consumer preference for exclusivity, limited-time offers, and character acquisition.
  • Purchase frequency remains relatively balanced across regions, with 35% of Eastern gamers and 36% of Western gamers identified as frequent spenders.
+5
Mistplay
Page 1
Report32 pages

Conversion Drivers in Videogames: Q1 2026

Marketing strategy and community sentiment serve as the primary determinants of conversion performance in the global video game industry as of early 2026. While pricing models like free-to-play and premium structures influence baseline metrics, the efficacy of acquisition campaigns depends more heavily on the alignment between marketing channels and specific player decision-making behaviors. Traditional last-click attribution models frequently undervalue high-funnel awareness efforts, necessitating a shift toward incrementality testing and extended retargeting windows to accurately capture the impact of early-stage engagement.

Player decision cycles vary significantly across industry segments, dictated largely by the social and cooperative dynamics inherent in different genres. Multiplayer and massively multiplayer online titles require longer conversion windows due to the complexity of social coordination, whereas single-player experiences benefit from strategies that emphasize urgency and individual-driven processes. Consequently, marketing efforts for multiplayer games should prioritize social proof and sustained community engagement, while single-player titles gain more traction through direct, time-sensitive calls to action.

Game quality and public perception act as critical multipliers for conversion, particularly within the premium sector. High Steam review scores, specifically those reaching the highest sentiment tiers, can nearly triple conversion rates for premium titles, whereas free-to-play conversion remains largely indifferent to such metrics. Because premium games involve extended evaluation periods, marketers must maintain consistent community-focused sentiment management to protect long-term conversion potential. By tailoring acquisition strategies to these distinct genre-based behaviors and moving beyond simplistic attribution, publishers can better optimize campaign performance and maximize player acquisition efficiency.

  • Marketing execution is the primary driver of performance, with conversion rates for F2P games varying by 371x across different ad networks, dwarfing the 35% baseline advantage F2P titles hold over Premium games.
  • Last-click attribution models undervalue upper-funnel awareness channels like YouTube, as 50% of the most popular demand-generating ad networks are not effectively captured by last-click metrics.
  • Premium games priced above $40 require nearly twice the conversion window of mid-tier titles, and players take 27% longer to convert on Premium titles (141 hours) compared to F2P titles (111 hours).
  • Steam review scores significantly impact Premium game performance, where moving from a 'Mixed' to 'Very Positive' rating can nearly triple conversion rates, whereas review scores show no measurable impact on F2P conversion.
  • Multiplayer games exhibit longer decision cycles, taking 2.5x longer to convert than single-player titles, with MMO players requiring a median of 49.5 hours to convert compared to 21 hours for shooter players.
+3
GamesightMay 2026
Page 1
Report57 pages

Digital Market Index: Q1 2026

The global digital economy experienced a significant structural transition during the first quarter of 2026, characterized by a pivot away from traditional mobile gaming toward generative artificial intelligence and short-form entertainment. While global in-app purchase revenue climbed 9.3% to $43.5 billion, this growth was primarily fueled by non-gaming sectors. Mobile gaming faced a notable contraction, with downloads falling 12% year-over-year, even as puzzle titles maintained their status as a primary revenue anchor. Conversely, the generative AI sector surged by 174%, signaling a shift in consumer engagement as users increasingly migrate from web-based interfaces to dedicated mobile applications.

Geographically, the market landscape is bifurcating between mature and emerging economies. The United States market exhibited signs of cooling, recording its lowest revenue growth rate at 3.5%, while India and Indonesia emerged as primary drivers of download volume. Despite the slowdown in U.S. consumer spending, the digital advertising sector remained resilient, growing 15% to $48 billion. This expansion was heavily supported by a 31% increase in software-related ad spend, as advertisers aggressively reallocated budgets from linear television toward targeted digital channels and retail media networks.

Retail media continues to evolve beyond the dominance of Amazon, with platforms like Walmart and Target capturing significant share by leveraging offsite social channels. This trend is particularly pronounced in essential categories such as personal care and food and beverages. As the industry matures, the competitive landscape for generative AI has also become more distributed, with market share spreading across multiple platforms like Gemini and Claude. These findings reflect a broader trend of digital consolidation, where mobile-first engagement and AI-driven utility define the current trajectory of the global digital marketplace.

  • Global in-app purchase (IAP) revenue reached $43.5 billion in Q1 2026, marking 9% year-over-year growth and the 13th consecutive quarter of positive performance.
  • US digital ad spend grew 15% year-over-year to $48 billion in Q1 2026, with Reddit emerging as the fastest-growing channel at 89% year-over-year growth.
  • US mobile IAP revenue growth slowed to an all-time low of 3% year-over-year, recording two consecutive quarters of decline from its $15.1 billion peak.
  • Generative AI advertising spend in the US surged to over $430 million in Q1 2026, more than triple the amount spent in Q1 2025, contributing to a 31% year-over-year increase in software ad spend.
  • Retail media ad impressions in the US declined 3% year-over-year to 156 billion, driven by a 14% drop in Amazon impressions, even as Amazon maintained over 88 billion impressions and 4x the scale of Walmart.
+3
Sensor TowerMay 2026
Page 1
Report63 pages

Why Players Play: The Psychology Behind Mobile Games

Mobile game development relies on the strategic alignment of product features with fundamental human psychological drivers to maximize player retention and monetization. By integrating core motivations such as mastery, curiosity, and social connection with defensive psychological triggers like loss aversion and the fear of missing out, developers create highly sticky ecosystems. The primary thesis posits that long-term success in the mobile sector is not merely a product of gameplay quality, but the result of a deliberate, evidence-based architecture that increases the perceived cost of player attrition.

The industry utilizes a sophisticated framework known as the Motivation Wheel to categorize game events and align them with specific business objectives, such as increasing average revenue per user or extending session duration. This approach sequences positive reinforcement—such as visible progress and reward systems—with negative motivators that compel action. By layering these mechanics, developers effectively transform natural session exit points into persistent hooks. Features like battle passes, streaks, and time-limited events leverage the sunk cost fallacy, shifting the player’s primary motivation from intrinsic enjoyment to a defensive necessity to protect accumulated progress.

This analytical approach to game design is prevalent across the global mobile gaming market, focusing on the intersection of behavioral psychology and product management. By systematically engineering these psychological deficits, developers ensure that engagement remains high even after the initial novelty of a game fades. Ultimately, the integration of these mechanics serves to minimize guesswork in product planning, allowing studios to foster deep, long-term player investment through the calculated application of urgency, social pressure, and the psychological weight of digital achievement.

  • Social connection is the most effective retention mechanic because it creates a switching cost that prevents players from moving to competitors, as they cannot transfer their clan or community identity.
  • Win streaks are the most powerful ARPU-driving mechanic because they simultaneously leverage progress, near-miss tension, loss aversion, urgency, and social pressure.
  • Visible progress is essential for casual games; players require concrete proxies like progress maps, star counts, or numerical growth to feel a sense of competence and reward.
  • Retention can be extended at natural session 'exit points' by using time-limited boosters or curiosity-driven teasers to convert a sense of completion into a new hook.
  • Urgency and FOMO are most effective when the time-limited window is restricted to 5–20% of the total event duration, forcing players to choose between missing out or playing harder.
+3
Sensor TowerMay 2026
Page 1
Report69 pages

State of Gaming 2026

The 2026 State of Gaming analysis demonstrates a shifting landscape in which mobile gaming remains the largest driver of downloads—approximately 50 billion in 2025—but its growth rate is slowing. Revenue, however, continues to climb as monetization models mature and lifetime value deepens, especially within hybrid‑casual titles that now generate the most incremental income. In contrast, PC and console platforms experience record revenue growth, with Steam’s premium segment up 32 % and blockbuster releases such as Battlefield 6 capturing significant market share from incumbents. Shooter downloads on these platforms have plateaued, suggesting new titles are primarily cannibalizing existing audiences rather than expanding the category.

Genre‑specific dynamics reveal that strategy games are the only mobile genre to grow in downloads, driven by 4X titles from Eastern developers. Action and shooter games dominate PC/console gains, while hyper‑casual remains the largest download engine but shows a notable lift in time spent, particularly in Tier 2 markets. Casual titles face declining day‑7 retention, indicating a stickiness challenge that could erode long‑term player value.

Live‑ops and acquisition strategies have evolved toward retention‑focused events, multi‑tier season passes, and expedition‑style rewards. These mechanisms now represent the most reliable revenue drivers across competitive genres such as RPG, action, and simulation. Advertising spend remains concentrated on social channels—YouTube, Facebook/Instagram—and high‑attention formats like video, playable, and rewarded ads. Battlefield 6’s pre‑launch spend surpassed Call of Duty titles, leveraging Facebook, Reddit, and desktop display, while its post‑launch strategy pivoted to YouTube with cinematic, celebrity‑hook creatives.

Geographically, the U.S. market shows a skew toward lifestyle and puzzle categories despite lower IAP shares, whereas casino titles exhibit higher spend‑to‑revenue efficiency. Overall, the industry is moving from acquisition toward deeper monetization per user, with indie shooters and simulation titles gaining traction amid intense competition in the shooter segment.


  • PC and console platforms are seeing record revenue growth, highlighted by a 32% increase in Steam’s premium segment and the strong market performance of Battlefield 6.
  • Mobile gaming growth is slowing despite reaching 50 billion downloads in 2025, with hybrid-casual titles now serving as the primary drivers of incremental revenue.
  • Shooter games on PC and console have reached a download plateau, indicating that new releases are cannibalizing existing player bases rather than expanding the total market.
  • Retention-focused live-ops, including multi-tier season passes and expedition-style rewards, have become the most reliable revenue drivers for RPG, action, and simulation genres.
  • Strategy games are the only mobile genre experiencing download growth, fueled primarily by 4X titles from Eastern developers.
+1
Sensor TowerApr 2026
Page 1
Report53 pages

Ad Monetization Without Killing Retention

Hybrid monetization can increase revenue without eroding player retention by treating advertisements as an integral part of the game’s design system. Three core ad formats—interstitials, rewarded video (RV), and banners—are positioned strategically through careful gating on level progression, playtime, or cooldown periods. Optimal triggers and placement reduce player frustration while maximizing eCPM, ensuring that monetization flows naturally with gameplay.

Rewarded video is most effective when offered during high‑stakes moments such as revives, boosters, or time‑limited rewards. Leveraging scarcity and urgency in these contexts drives conversions while preserving the core experience. Consistent visual cues, a clear distinction between coin rewards and RV value, and optional “No Ads” bundles further balance monetization with player comfort.

Selling “No Ads” bundles requires thoughtful presentation. Bundles should appear side‑by‑side with regular items, use distinct visual cues and anchoring to convey high value, and be gated behind a minimum purchase tier to protect payer retention. Segmenting ad exposure—capping impressions, applying cooldowns, and filtering out disruptive creatives—maintains a positive user experience while sustaining revenue.

Overall, the strategy blends ad formats with gameplay mechanics, employs scarcity and urgency for rewarded video, and offers high‑value “No Ads” options. This approach delivers robust monetization across diverse segments while safeguarding long‑term player engagement and retention.

  • Integrate advertisements as core gameplay design elements rather than external overlays to increase revenue without negatively impacting player retention.
  • Deploy rewarded video ads during high-stakes moments—such as revives, boosters, or time-limited rewards—to leverage scarcity and urgency for higher conversion rates.
  • Implement strategic gating for ad triggers based on level progression, total playtime, or specific cooldown periods to minimize player frustration.
  • Market 'No Ads' bundles by presenting them alongside regular items using clear visual anchoring to establish high value, while gating them behind minimum purchase tiers to protect payer retention.
  • Maintain a positive user experience by segmenting ad exposure through impression caps, cooldown timers, and the filtering of disruptive creative content.
+2
Sensor TowerApr 2026
Page 1
Report33 pages

2026 Global Non‑Gaming App Trends Report

The report argues that non‑gaming mobile applications are experiencing accelerated growth driven by AI integration, short‑form content, and intensified user acquisition competition. Key findings show that Android dominates download volume—particularly in Utilities (79 % of installs) and Life Services (58 %)—while iOS generates a higher share of revenue, especially in Finance & Business (56 % of iOS revenue) and Life Services (57 %). In 2025, AI‑focused apps such as ChatGPT (+1,340 %) and Perplexity (+3,613 %) achieved the highest year‑over‑year download growth, and Short Drama titles like Kuku TV (+45 % k) and RapidTV (+498 %) recorded explosive revenue increases, with AI Social apps (e.g., Character AI +918 %) also driving significant monetization.

User acquisition activity expanded across all major categories, with Life Services (+42 %) and Finance & Business (+43.5 %) leading the rise in app counts. Smart bidding adoption surged, with Target ROAS spend increasing by 50 % and Target CPE spending up 57 %, particularly in Utilities and Entertainment. Cost‑per‑install (CPI) analysis revealed that E‑Commerce on Android commands a 3× premium, while Finance & Business on iOS reaches 4.6×, underscoring high competition for transactional users.

Monetization patterns shift toward in‑app advertising (IAA), dominating across Education, Utilities, and Entertainment. Video formats—rewarded and interstitial—outperform banner ads by 128–165× eCPM, with North America delivering the highest rewarded video eCPMs (up to 11.8× in Short Drama). The report covers global markets excluding Mainland China from January to December 2025, drawing on anonymized data from Mintegral and Insightrackr across 100+ key app categories.

  • AI-focused applications experienced massive 2025 growth, led by Perplexity (+3,613%), ChatGPT (+1,340%), and Character AI (+918%).
  • Short Drama apps like RapidTV (+498%) and Kuku TV (+45k%) are driving explosive revenue, with North American rewarded video eCPMs for this category reaching up to 11.8x.
  • Android leads in global download volume, particularly in Utilities (79%) and Life Services (58%), while iOS captures the majority of revenue in Finance & Business (56%) and Life Services (57%).
  • User acquisition competition is intensifying, evidenced by a 50% increase in Target ROAS spending and a 57% rise in Target CPE spending, particularly within Utilities and Entertainment.
  • Cost-per-install (CPI) premiums remain high for transactional users, reaching 3x for E-Commerce on Android and 4.6x for Finance & Business on iOS.
MintegralApr 2026
Page 1
Report97 pages

State of Mobile 2026

The 2026 State of Mobile report demonstrates that the global mobile ecosystem remains mature yet increasingly monetized, with 2025 in‑app purchase (IAP) revenue reaching $85.6 billion—a 21 % year‑over‑year rise that now places non‑game apps ahead of games for the first time. Generative AI and short‑form drama have become the fastest‑growing subgenres, driving double‑digit IAP growth; AI assistants such as ChatGPT alone generated $3.4 billion in 2025, while short‑drama apps captured more than ten percent of global video‑entertainment time. These categories also show a shift from acquisition to retention, with session volumes outpacing downloads and time spent tripling in AI apps.

Hybrid‑casual and hyper‑casual games continue to lead revenue growth, especially in Tier 2 markets where downloads are falling but engagement is surging. Publishers targeting these segments can capture higher revenue per user, though they face tighter ad‑spend competition and a move toward high‑attention formats. In the gaming web arena, Roblox dominates with 74 % of game‑publisher site visits in 2025, underscoring the importance of product‑centric web design.

Beyond entertainment, general‑shopping apps such as Temu and Amazon maintain massive download volumes, with grocery and buy‑and‑sell subgenres growing 5 % and 4 % YoY, respectively. Food & drink apps hit a record 2.4 billion downloads in 2025, driven largely by emerging markets like India and the Middle East. Mobility and sports apps also show notable shifts: Waymo’s standalone app captured 15 % of rideshare MAUs in key U.S. metros, while DFS‑style sports betting apps now command 80 % of the betting‑app MAU share, reflecting regulatory impacts and new market entrants.

Overall, the report covers a global geographic scope with particular emphasis on the U.S., India, Western Europe, and emerging Tier 2 markets. It spans 2025 data with forward‑looking insights for 2026, highlighting AI’s transformative role across monetization, user engagement, and competitive dynamics in the mobile industry.

  • Non-game apps surpassed games in in-app purchase (IAP) revenue for the first time in 2025, contributing to a total global IAP market of $85.6 billion, a 21% year-over-year increase.
  • Generative AI and short-form drama are the fastest-growing subgenres, with AI assistants like ChatGPT generating $3.4 billion in 2025 and short-drama apps capturing over 10% of global video-entertainment time.
  • Roblox solidified its dominance in the gaming web arena, accounting for 74% of all game-publisher site visits in 2025.
  • Hybrid-casual and hyper-casual games are seeing surging engagement and higher revenue per user in Tier 2 markets, despite a broader trend of declining download volumes.
  • Daily Fantasy Sports (DFS)-style apps now command 80% of the betting-app monthly active user (MAU) share, driven by new market entrants and regulatory shifts.
Sensor TowerApr 2026
Page 1
Report80 pages

PC & Console Gaming Report 2026

1. Market trajectory What direction is the PC and console market heading in 2026? 8 What direction is the PC and console market heading in 2026? 2. Attention & value allocation Where do players spend time and money on PC and console? 17 3. Market concentration What happens if you are not a top-20 game? 45 4.

  • PC player base is projected to exceed one billion by 2028, with a CAGR of 2.9% from 2025-2028, while console player growth moderates with a 2.2% CAGR in the same period.
  • Almost two-thirds of console revenues (PlayStation and Xbox) go to the top 20 games, whereas on PC, over half of revenue comes from games ranked 21+.
  • PC is the only platform effectively monetizing Free-to-Play (F2P) games, with revenue holding stable despite falling playtime in the west; on console, F2P revenue is dropping faster than engagement.
  • Games ranked 21+ are capturing a growing share of playtime across platforms, with PC showing the strongest shift since 2022, indicating market disaggregation and growth from outside the top 20 titles.
  • Premium game revenue is growing on PC and PlayStation, but Xbox's more modest growth cannot offset declines in F2P and Call of Duty.
+3
NewzooApr 2026

Publishers

Related Topics

Monetization — Game Industry Reports & Data | Game Industry Library