Market Analysis
Documents

Q4 2024 Digital Market Index
In Q4 2024 global in‑app purchase revenue reached a record $39.4 billion, up 13.5% year‑over‑year, with non‑game apps now nearly matching game revenue at $19.2 billion versus $20.2 billion. iOS dominates the market, generating roughly 70% of IAP revenue ($30 billion) and outpacing Google Play’s growth (15.4% versus 9.7%). Overall app downloads remained flat at about 34 billion, while non‑game downloads increased and game downloads stabilized after a pandemic peak.
Strategy titles emerged as the most lucrative segment, generating over $4.8 billion in IAP revenue—a 80% quarter‑over‑quarter lift that offset an 11% year‑over‑year decline in RPGs. Strategy games also accounted for six of the top ten download growth drivers, with a 26% year‑over‑quarter increase. In contrast, RPG revenue fell 29% globally, though regional pivots in Korea—where strategy and puzzle games grew 55% and 14%, respectively—helped mitigate the loss. Puzzle titles also contributed to overall download growth.
TikTok (including Douyin) led non‑game app monetization, delivering $6 billion in IAP revenue for the year—more than double any other app or game. Advertising spending in the United States reached $34 billion in Q4, with social media platforms capturing 77% of the spend; TikTok experienced the fastest year‑over‑year growth at 22%. Amazon drove U.S. digital ad spend growth, supporting campaigns for Audible, Prime Video and Amazon Music, while other major advertisers such as Verizon, Liberty Mutual, Coca‑Cola, Microsoft, Epic Games, Target and Walmart increased spend—particularly on gaming and social platforms. Retail‑media impressions hit a record 80 billion, up 4% year‑over‑year, with Walmart and Target dominating the top ten categories and Best Buy‑Samsung and Chewy‑Nestlé emerging as the most viewed co‑branded pairs.
Collectively, these findings illustrate a strategic shift toward strategy titles, the continued dominance of TikTok in app monetization, and an outsized role for social media advertising and retail‑media partnerships during the holiday peak. The data cover global markets with a focus on U.S., Korean, and broader digital advertising trends for the fourth quarter of 2024.
- Global in-app purchase (IAP) revenue hit a record $39.4 billion in Q4 2024, a 13.5% year-over-year increase, with non-game apps ($19.2 billion) nearly reaching parity with gaming ($20.2 billion).
- iOS remains the primary revenue driver, generating $30 billion (70% of total IAP revenue) and outpacing Google Play’s growth at 15.4% versus 9.7%.
- Strategy games became the most lucrative gaming segment with $4.8 billion in Q4 IAP revenue, marking an 80% quarter-over-quarter increase that helped offset an 11% year-over-year decline in RPG revenue.
- TikTok (including Douyin) is the dominant non-game monetization force, generating $6 billion in annual IAP revenue, more than double that of any other single app or game.
- U.S. advertising spend reached $34 billion in Q4, with social media platforms capturing 77% of the total and TikTok recording the fastest year-over-year growth at 22%.

Global Games Market Report 2024
The Global Games Market Report 2024 projects a modest 2.1 % year‑over‑year growth, bringing worldwide revenues to $187.7 billion in 2024 and reaching $213.3 billion by 2027 at a 3.1 % compound annual growth rate. PC gaming remains the largest segment, generating $43.2 billion in 2024 and accounting for roughly 22 % of total revenue by 2027, while consoles are expected to rise to a 30 % share as cross‑platform releases become more common. Mobile revenue growth has slowed after the pandemic, and its market share is projected to decline further, underscoring a shift toward PC‑centric titles.
Player numbers are set to climb to 3.42 billion, a 4.5 % increase driven largely by PC adoption; mobile and console growth are more modest at 3.5 % and 2.3 %, respectively. The report’s methodology blends primary consumer research, macro‑economic data, app‑store feeds, and public company financials to estimate players, payers, and revenue streams. It also highlights the rising influence of user‑generated content (UGC) and cross‑generational appeal, noting that Gen Alpha and Gen Z together represent 94 % and 86 % of online gamers, respectively. UGC is emerging as a significant revenue source for both studios and creators, demanding strategies that balance older and younger player habits.
Key insights emphasize the growing importance of IP‑driven franchises, licensing, and transmedia ventures for revenue generation. Detailed breakdowns cover game delivery models, monetization tactics, genre performance, and regional revenues—including VR and cloud gaming metrics. The report promotes tailored consulting services such as TAM sizing, genre teardowns, audience analysis, campaign measurement, and live‑service strategy to help studios optimize development, marketing, and monetization in an increasingly competitive landscape.
- The global games market is projected to reach $187.7 billion in 2024, growing at a 3.1% CAGR to hit $213.3 billion by 2027.
- PC gaming is the leading segment with $43.2 billion in 2024 revenue, while console market share is expected to rise to 30% due to the prevalence of cross-platform releases.
- Total player count is forecast to reach 3.42 billion, a 4.5% year-over-year increase primarily driven by growth in PC adoption.
- Mobile gaming revenue growth has slowed post-pandemic, leading to a projected decline in its overall market share as the industry shifts toward PC-centric titles.
- Gen Alpha and Gen Z represent 94% and 86% of online gamers respectively, highlighting the critical need for strategies that balance the habits of younger demographics.
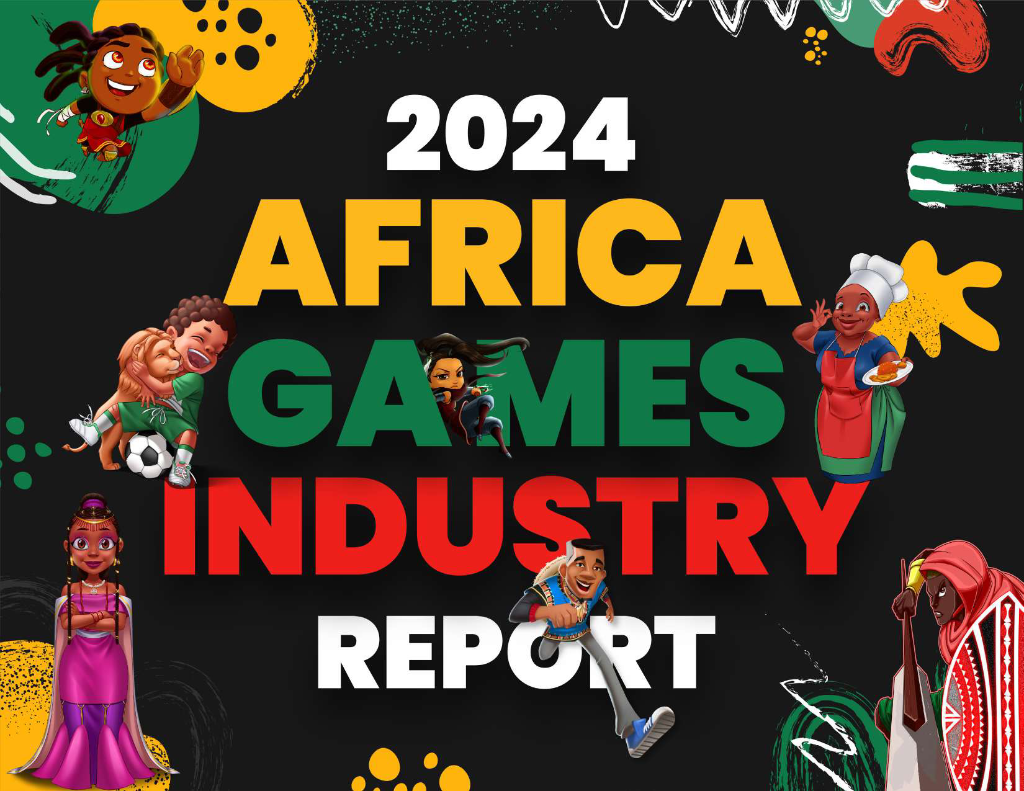
Africa Games Industry Report 2024
The Africa Games Industry Report 2024 presents a data‑driven assessment of the continent’s gaming ecosystem, targeting investors, policymakers, developers and the broader public. It argues that Africa’s youthful demographics, rapid mobile penetration and cultural diversity create a fertile environment for game development and monetisation. The report identifies fre‑to‑play with in‑app purchases as the dominant revenue model, while premium titles, ad‑based income, subscriptions and licensing remain viable alternatives for developers willing to overcome higher entry barriers.
Key findings show that the Sub‑Saharan gamer base has more than doubled from 77 million in 2015 to 186 million in 2021, with mobile gaming accounting for 95 % of players and nearly 90 % of the region’s $778.6 million revenue in 2022. Approximately one‑third of players make in‑app purchases, underscoring significant monetisation potential. The industry is largely composed of small to medium studios and solo developers, with Unity the preferred engine and mobile/PC platforms dominating. Yet only 36 % of respondents earn income from games, and infrastructure challenges—unreliable power (71 %) and costly internet (57 %)—continue to impede growth.
The report calls for coordinated action from investors, studios, policymakers and the public. It highlights mobile network operators and alternative payment systems as critical partners for expanding reach, while outlining a five‑factor ecosystem—reliable infrastructure, talent pathways, informed investors, connected industry and evidence of success—to unlock high‑value jobs, cultural exports and foreign investment. The overarching thesis is that Africa’s gaming sector is poised for rapid expansion, offering substantial economic and creative opportunities if these systemic barriers are addressed.
- The Sub-Saharan gamer base grew from 77 million in 2015 to 186 million in 2021, with mobile gaming driving 95% of the player base and nearly 90% of the region's $778.6 million revenue in 2022.
- Free-to-play with in-app purchases is the dominant revenue model, with approximately one-third of players currently making in-app purchases.
- Infrastructure remains the primary barrier to growth, with 71% of developers citing unreliable power and 57% citing high internet costs as significant impediments.
- Despite the sector's scale, only 36% of surveyed developers currently earn income from their games.
- The industry is primarily composed of small-to-medium studios and solo developers who predominantly utilize the Unity engine for mobile and PC platforms.

Newzoo PC & Console Gaming Report 2024
The 2024 Newzoo PC & Console Gaming Report presents a cautiously optimistic outlook for the global market, with 2023 revenues rising 2.6 % to $93.5 bn. Growth is largely driven by PC game sales, while console revenue increased modestly at 1.7 % YoY. Playtime is falling, and player growth is flattening: PC players are projected to grow at 1.6 % CAGR and console players at 3 % through 2026, making it increasingly difficult to expand the player base. Premium transactions dominate spending, accounting for roughly 56–57 % of total spend; live‑service and subscription models still lag behind full‑price titles, underscoring the need for studios to focus on high‑quality releases and robust content pipelines.
Fortnite and Roblox command over 60 % of total playtime in 2023, reinforcing a highly concentrated market where established platforms and annual franchises dominate engagement. Quarterly playtime has fallen 26 % since Q1 2021, with older titles accounting for more than 60 % of hours and new releases only about 8 %. Live‑service pay‑to‑play games capture the majority of new‑title revenue, making it challenging for fresh IPs to gain traction.
Concentration among publishers has tightened further: between 28 and 34 publishers captured 80 % of monthly active users in 2023, a trend that has been tightening since 2021. While the number of titles driving 75–90 % of MAU has remained roughly flat, playtime per user is falling. Over half of the top new releases are franchise titles, and remakes or transmedia adaptations can boost both new and legacy game MAU by 35–60 %.
Multi‑platform play is significant, with nearly half of gamers (47 %) playing on two or more platforms. Multi‑platform players spend 79 % of their time and represent 41 % of the total player base, indicating higher engagement and spend. Emerging markets are projected to outpace established ones with a 4.7 % CAGR versus 0.2 %, and cloud gaming is identified as a key entry point due to high awareness (32 %) and low hardware barriers. Expanding beyond a single platform—especially into mobile or cloud services—offers new revenue routes but requires tailored experiences and messaging for diverse audiences.
- The market is highly consolidated, with 28 to 34 publishers capturing 80% of monthly active users and just two titles, Fortnite and Roblox, commanding over 60% of total playtime in 2023.
- Engagement is dominated by legacy content, as older titles account for over 60% of total hours played, while new releases capture only 8% of playtime.
- Premium transactions remain the primary revenue driver, accounting for 56–57% of total spending and outperforming live-service and subscription models.
- Global PC and console revenue grew 2.6% to $93.5 billion in 2023, though player growth is flattening with projected CAGRs of only 1.6% for PC and 3% for console through 2026.
- Quarterly playtime has declined 26% since Q1 2021, and over half of the top new releases are franchise titles, highlighting the difficulty of establishing fresh IPs.

State of Play: Xsolla Report
The report argues that the indie game sector has become a dominant force in the global market, driven by lowered entry barriers, widespread use of accessible engines, and a shift toward influencer‑led discovery. Data show that 2024 indie sales surpassed AAA titles, generating over $15 million in lifetime revenue across PC, Xbox, and Steam, with action, adventure, and RPG genres leading. Indie titles now account for 18 % of U.S. PC/console players and achieve higher average Steam ratings (≈72 %) than AAA games, reflecting a 12‑month YoY growth spike in early 2024 that continues to push positive momentum.
Key enablers include Unity’s 38 % market share, Unreal’s steady growth, and Godot’s sharp rise, which together support the release of 8 000–10 000 titles annually. Free or low‑cost asset stores and backend services such as Xsolla Backend reduce development time and cost, with studios reporting average backend build costs of $21 million versus in‑house development. Cross‑platform publishing and a 29 % share of Steam revenue in 2023 further accelerate market penetration.
The U.S. remains the largest gaming market, but regional hubs like Wisconsin are emerging through local publisher support and flexible work models. QA professionals increasingly influence inclusive design, while systemic barriers to gender and LGBTQ+ representation persist. Average U.S. developer salaries rose from $88,010 in 2023 to $91,009 in 2024, and the edutainment sector is projected to grow from $9.1 B in 2020 to $30.7 B by 2025, driven by online learning platforms.
Online education and influencer marketing are rapidly expanding; MOOCs are expected to reach $279 billion by 2029, and the global influencer market is projected at $36 billion in 2024. These trends underscore continuous skill development and targeted influencer partnerships as cost‑effective channels for monetization, marketing, and distribution. The synthesis highlights the need for strategic adaptability among publishers, developers, and investors to capitalize on the evolving indie landscape.
- Indie games surpassed AAA titles in 2024, generating over $15 million in lifetime revenue and accounting for 18% of U.S. PC/console players with an average Steam rating of approximately 72%.
- The indie sector is supported by an annual output of 8,000–10,000 titles, driven by engine market shares led by Unity (38%) and the rapid adoption of Godot.
- Outsourcing backend services to providers like Xsolla reduces development costs significantly, with studios reporting average build costs of $21 million compared to the higher expense of in-house development.
- The edutainment sector is projected to grow from $9.1 billion in 2020 to $30.7 billion by 2025, while the global influencer market is expected to reach $36 billion in 2024.
- Average U.S. developer salaries increased from $88,010 in 2023 to $91,009 in 2024, reflecting ongoing labor market shifts alongside the emergence of regional hubs like Wisconsin.

Global MSP Report
The Global MSP Report presents a comprehensive analysis of the managed services provider (MSP) market, focusing on transaction activity, valuation trends, and strategic consolidation across the United States and Europe. The report documents a sharp increase in private‑placement activity during Q4 2024, with deal value rising from $34 million in Q3 to $2.2 billion, driven largely by platform deals and a 83% share of total activity involving strategic buyers acquiring multiple MSPs. Strategic consolidation remains robust, with six of the top ten players each adding at least four MSPs between 2023 and 2024, while financial investors continue to focus on single‑company investments.
Market valuation data indicate that the global MSP sector reached $305 billion in 2024 and is projected to grow at a CAGR of 7.2% to $571 billion by 2033, reflecting escalating IT complexity and demand for cost‑efficient services. Deal concentration is highest in IT services (88% of Q4 2024 activity), with software, networking, and communications sectors contributing smaller shares. The report lists 58 announced M&A deals in Q4 2024, with a total of 500 transactions completed since 2013 by the reporting firm.
Key outcomes highlighted include rapid deployment of new technology, cost efficiency gains, and enhanced service capabilities. The analysis draws on Pitchbook and Drake Star data, covering 2023‑2024 transactions across North America, Europe, and the Middle East, and provides detailed transaction tables for individual deals, including revenue, deal size, and acquirer information.
- The global MSP market reached a valuation of $305 billion in 2024 and is projected to grow at a 7.2% CAGR to $571 billion by 2033.
- Private-placement deal value surged from $34 million in Q3 2024 to $2.2 billion in Q4 2024, driven by a high volume of platform deals.
- Strategic buyers dominated Q4 2024 activity, accounting for 83% of total transactions as they aggressively acquired multiple MSPs.
- Six of the top ten industry players completed at least four MSP acquisitions each between 2023 and 2024, signaling robust sector consolidation.
- IT services accounted for 88% of all M&A activity in Q4 2024, with the remaining volume distributed across software, networking, and communications.
Digital Services Report
The quarterly Digital Services Report presents a comprehensive snapshot of the global digital services landscape for Q2 2024, focusing on mergers and acquisitions, fundraising activity, market trends, and key performance indicators across technology-enabled services. The report highlights a robust deal pipeline, with 350+ disclosed M&A transactions totaling over $7.4 billion and 880+ fundraising deals raising more than $8.1 billion, underscoring continued investor confidence despite macro‑economic uncertainty. Notable transactions include Cognizant’s $1.3 billion acquisition of Belcan, EQT’s $3.0 billion purchase of Perficient, and Virtusa’s acquisition of ITMAGINATION, illustrating a strategic shift toward digital transformation capabilities. Fundraising highlights feature Sikich’s $250 million minority investment from Bain Capital, Uniqus Consultech’s $10 million Series B led by Nexus Ventures, and Raft’s $60 million venture round from Washington Harbour.
Market analysis identifies generative AI and other AI‑powered technologies as primary catalysts for future deal momentum, with expectations of heightened M&A activity in Q3 2024 driven by pent‑up demand and abundant private equity capital. Geographic coverage spans North America, Europe, and Asia-Pacific, with a focus on technology‑enabled services such as cloud migration, cybersecurity, business intelligence, and data analytics. Methodology relies on proprietary Drake Star analysis of M&A and private placement databases, supplemented by secondary sources including Capital IQ, PitchBook, and SimilarWeb.
The report concludes that corporates increasingly pursue inorganic growth to unlock value, achieve efficiencies, and stay ahead of technological disruption. It positions digital services as a high‑growth sector poised for continued consolidation and innovation, offering investors and executives actionable insights into emerging trends and strategic opportunities.
- Q2 2024 saw robust activity in the digital services sector with over 350 M&A transactions totaling $7.4 billion and 880 fundraising deals raising $8.1 billion.
- Major M&A activity was headlined by EQT’s $3.0 billion acquisition of Perficient and Cognizant’s $1.3 billion purchase of Belcan, signaling a strategic focus on digital transformation capabilities.
- Generative AI and AI-powered technologies are identified as the primary catalysts for deal momentum, with expectations for increased M&A activity in Q3 2024.
- Private equity remains a significant driver of market movement, exemplified by Bain Capital’s $250 million minority investment in Sikich.
- Market demand is concentrated in technology-enabled services, specifically cloud migration, cybersecurity, business intelligence, and data analytics.

India's Media & Entertainment Sector: March 2024
India’s media and entertainment landscape is in the midst of a rapid digital pivot, with online platforms projected to surpass traditional television as the leading revenue driver by 2024. The sector is expected to grow at a 10 % CAGR, reaching INR 3.1 trillion ($37 billion) by 2026, driven largely by new‑media segments such as OTT video, gaming and digital advertising. Traditional channels—print, radio, out‑of‑home (OOH) and regional TV—continue to expand modestly, reinforcing a “linear + digital” model that balances legacy audiences with emerging consumption patterns.
Key growth engines include a surge in mobile‑first media, where 904 million broadband subscriptions and 574 million smartphone users fuel a daily mobile media spend of over four hours. OTT video viewership now covers 98 % of smartphone owners, with regional‑language content rising from 47 % to 52 %. Gaming dominates the mobile gaming market, with Free Fire and BGMI generating a quarter of in‑app purchase revenue, while esports viewership climbs to 78 % of gamers. Music and radio also expand through digital monetisation, with streaming revenues growing 10 % to INR 24 billion and radio advertising up 17 %.
The sector’s future hinges on cross‑platform content strategies, bundled FAST/OTT offerings, AI‑driven personalization and unified audience measurement. Challenges persist: low OTT profitability, ad‑rate pressure, regulatory uncertainty around gaming and gambling, and the need for first‑party data in a cookie‑less environment. Nonetheless, India’s position as the world’s largest app‑download market and its growing 1 billion active screens by 2030 underscore a resilient, technology‑driven growth trajectory across film, television, gaming, music and live events.
- India's media and entertainment sector is projected to reach INR 3.1 trillion ($37 billion) by 2026, growing at a 10% CAGR as online platforms overtake traditional television as the primary revenue driver.
- Mobile-first consumption is the primary growth engine, supported by 904 million broadband subscriptions and 574 million smartphone users who spend over four hours daily on mobile media.
- Gaming is a dominant market force, with Free Fire and BGMI accounting for 25% of in-app purchase revenue and esports viewership reaching 78% of the gaming population.
- OTT video viewership has reached 98% of smartphone owners, with regional-language content consumption increasing from 47% to 52% of the market.
- Digital monetization is expanding across legacy segments, evidenced by a 10% growth in music streaming revenue to INR 24 billion and a 17% increase in radio advertising.

South East Asian Mobile Game Market Insights 2024
Mobile game downloads across Southeast Asia grew by 3.4 % in the first half of 2024, reaching 4.2 billion installs, with Google Play accounting for 91 % of the volume. In‑app purchase revenue rose by 3.4 % to $1.16 billion, a slight decline of 3 % from the previous half‑year; Google Play contributed 57 % of total revenue. From January to August, mid‑core genres such as simulation, arcade, puzzle and lifestyle led download growth (11 %–14 %), while sports titles experienced a 39 % revenue surge, representing 9 % of total IAP income. Strategy and RPG games dominated downloads (47 %) but saw modest revenue declines of 3 %–9 %.
Indonesia remains the largest market, with a 10 % download increase and 41 % of regional downloads; Thailand follows as the highest‑earning country, adding $400 million in revenue. The top ten download leaders are dominated by Garena Free Fire, Mobile Legends: Bang Bang and Roblox, with Garena Free Fire maintaining a 54 % growth rate. In revenue terms, Mobile Legends: Bang Bang leads with $1.16 billion, followed by eFootball™ 2024 and Garena Free Fire; Roblox and Coin Master also show strong growth, with Roblox’s revenue rising 90 %.
The case study of Honor of Kings illustrates rapid penetration after its Southeast Asian launch in June 2024, achieving a 175 % month‑over‑month spike in Indonesia and capturing the top download spot in July. By August, Honor of Kings generated $1.7 billion in IAP revenue for the period and accounted for 51 % of its global downloads from Indonesia alone. The report relies on Sensor Tower’s estimated download and IAP data from the App Store and Google Play, excluding pre‑installs, duplicate downloads, ad revenue, third‑party sales, and direct developer payments.
- Southeast Asia's mobile game market saw 4.2 billion installs in H1 2024, a 3.4% increase, while in-app purchase (IAP) revenue reached $1.16 billion, a 3.4% year-over-year rise but a 3% decline from the previous half-year.
- Indonesia is the region's largest market by volume, accounting for 41% of total downloads with 10% growth, while Thailand leads in profitability, contributing $400 million in IAP revenue.
- Google Play remains the dominant platform in the region, capturing 91% of total download volume and 57% of total IAP revenue.
- While strategy and RPG titles command 47% of downloads, they experienced revenue declines of 3%–9%, whereas sports titles saw a significant 39% revenue surge, now representing 9% of total IAP income.
- Honor of Kings demonstrated rapid market penetration following its June 2024 launch, capturing the top download spot in July and generating 51% of its global downloads from Indonesia by August.

State of Game Technology Report 2024
The report demonstrates that game technology is increasingly permeating non‑traditional sectors, with half of surveyed teams employing real‑time 3D engines beyond game development. This cross‑industry diffusion is accompanied by persistent funding constraints and collaboration bottlenecks, notably slow file transfers, remote coordination difficulties, and asset feedback challenges. The data reveal a trend toward consolidating toolsets to enhance productivity amid economic uncertainty and the rise of remote work.
Engine usage remains dominated by Unreal Engine (63 %) while Unity follows at 47 %; Godot is gaining traction mainly among indie developers. Version control practices show Perforce Helix Core leading (51 %) with widespread adoption of Git‑based solutions, though Google Drive remains a common secondary storage option.
Asset management practices differ markedly between AAA and indie studios. Custom‑built solutions are common in both, yet 23 % of AAA teams and 17 % of indie studios rely on them, diverting resources from core development. Indie teams more frequently use Perforce (55 %) compared to AAA studios (3 %). Generative AI adoption is high, with 65 % of respondents using an organizational AI tool; ChatGPT leads at 47 %, especially among indie/mid‑size studios (50 % versus 26 % in AAA). Other AI tools such as Midjourney, DALL‑E, and GitHub Copilot also see notable usage.
Cloud infrastructure is embraced by nearly half of respondents (49 %), with AWS leading at 30 % and Azure at 18 %; hybrid cloud adoption remains minimal (6 %).
Talent acquisition trends underscore a premium on specialized experience (≈95–100 %) and continuous learning ability (≈71–82 %), while presentation skills and portfolio strength, though important, receive comparatively lower emphasis. These findings highlight a shift toward adaptable, skill‑rich talent pools across highly technical industries.
- Real-time 3D engines are expanding beyond gaming, with 50% of surveyed teams now applying this technology to non-traditional sectors.
- Generative AI adoption is widespread, with 65% of organizations utilizing AI tools, led by ChatGPT at 47% usage, particularly among indie and mid-size studios.
- Unreal Engine remains the market leader at 63% usage, followed by Unity at 47%, while Perforce Helix Core dominates version control at 51%.
- Cloud infrastructure adoption has reached 49%, with AWS holding a 30% market share compared to 18% for Azure.
- Asset management remains inefficient, as 23% of AAA studios and 17% of indie teams divert core development resources to maintain custom-built solutions.
Annual Report 2024
Thunderful Group’s 2024 Annual Report documents a decisive pivot toward a pure gaming focus, achieved through divestment of non‑gaming assets and a 20 % workforce reduction. The restructuring tightened the balance sheet, halving interest‑bearing net debt and leaving a modest cash position of SEK 29.6 million, yet it also produced a sharp decline in operating performance: net revenue fell 23.8 % to SEK 292.8 million and adjusted EBITA swung to a loss of SEK 383.9 million, largely due to cost‑cutting and the transition to higher‑margin publishing and co‑development activities.
The global gaming market grew modestly in 2024, reaching USD 187.7 billion with a 5 % rise in the player base to 1.5 billion, projected to reach 1.67 billion by 2027. Thunderful’s strategy targets a 3.1 % CAGR in the PC segment, high‑quality titles priced USD 10–30, and external project investments capped at EUR 2 million. The company has reorganised into Publishing and Co‑development & Services segments to optimise resource allocation, lower fixed costs through third‑party publishing, and balance riskier internal IP development with predictable service revenue.
Governance remains robust: a board‑led risk framework, annual review of a Zero‑tolerance Code of Conduct, and an anonymous whistleblowing function reinforce ethical standards. Executive remuneration is tightly linked to long‑term value, with fixed salaries capped at 30 % variable pay and share‑based incentives that could dilute equity by up to 4.65 % if fully exercised. Despite a net loss of SEK 887.5 million in 2024, the Group’s operating profit rose 57 % to SEK 292.8 million, signalling a turnaround post‑restructuring.
Financially, the Group’s liquidity is constrained; total assets fell from SEK 3.15 billion to SEK 772.9 million, and net cash turned negative. Impairments of over SEK 444 million on goodwill and other intangibles, coupled with significant restructuring costs, underpin the negative operating margin of –46.9 %. The company’s exposure to foreign‑exchange, interest‑rate and liquidity risks remains moderate but requires ongoing monitoring. Overall, the report presents a company in transition, balancing aggressive cost discipline and strategic realignment against a challenging financial backdrop.
- Thunderful Group reported a net loss of SEK 887.5 million in 2024, driven by SEK 444 million in asset impairments and significant restructuring costs that resulted in an operating margin of -46.9%.
- The company executed a major strategic pivot toward a pure gaming focus, involving a 20% workforce reduction and the divestment of non-gaming assets to halve interest-bearing net debt.
- Net revenue declined 23.8% to SEK 292.8 million, while adjusted EBITA fell to a loss of SEK 383.9 million as the firm transitioned toward higher-margin publishing and co-development models.
- Thunderful has reorganized into two core segments—Publishing and Co-development & Services—to balance high-risk internal IP development with predictable service revenue and lower fixed costs.
- The company’s financial position remains constrained, with total assets dropping from SEK 3.15 billion to SEK 772.9 million and a modest cash position of SEK 29.6 million.

Gaming Report 2024: Meet the Moment – How Gamers Are Changing the Game
The report demonstrates that the global video‑game market reached $196 billion in 2023 and is expected to grow at roughly 6 % per year through 2028. Growth is driven by a youthful demographic—80 % of players aged 2‑18—who devote nearly one third of their entertainment time to gaming. These gamers increasingly engage in immersive, cross‑platform ecosystems that combine social interaction, co‑creation and real‑world extensions of game IP. Their spending per hour can be up to five times higher when they participate in multiple activities, underscoring the commercial value of integrated experiences.
Key findings reveal that 70 % of players use multiple devices and 90 % desire a single consolidated marketplace, with half willing to pay for it. Publishers are therefore urged to develop device‑agnostic platforms, strengthen direct relationships with players and employ data‑driven marketing. In the mobile sector, an 80 % failure rate after three years contrasts sharply with a 10–25 % failure rate in software and retail, highlighting the need for highly targeted paid performance marketing, rigorous A/B testing and tight alignment across development, finance and marketing teams. Long‑term acquisition and retention strategies, coupled with generative AI for ad creation and optimization, are identified as critical success factors.
Operating models at leading studios are shifting toward standardised core tools, autonomous entrepreneurial teams with clear milestones and strategic embedding of generative AI. Talent attraction now demands a comprehensive package that includes purpose, competitive pay, work‑life balance, learning paths and ESG commitments to remain competitive with the broader tech industry. The report’s thesis is that understanding diverse gamer segments, delivering interoperable cross‑platform experiences and investing in data‑driven, AI‑enhanced operations are essential for capturing the rapidly expanding, monetarily active gaming audience.
- The global video game market reached $196 billion in 2023 and is projected to grow at an annual rate of approximately 6% through 2028.
- Engagement in immersive, cross-platform ecosystems is highly lucrative, as players spend up to five times more per hour when participating in multiple activities rather than gaming alone.
- Mobile game titles face an 80% failure rate after three years, necessitating rigorous A/B testing, targeted performance marketing, and tight alignment between development and finance teams.
- Consumer demand for platform interoperability is high, with 90% of players desiring a single consolidated marketplace and 50% willing to pay for such a service.
- Youth aged 2–18 represent 80% of the player base and dedicate nearly one-third of their total entertainment time to gaming.