Live Ops
Documents
Q3 2022 Earnings Call: Stillfront Group AB
Stillfront Group AB<sub>(</sub>SF.SE ) Stillfront Group AB<sub>(</sub>SF.SE) Corrected Transcript Q3 2022 Earnings Call 26-Oct-2022 Chief Executive Officer, Stillfront Group AB ChiefFinancial Officer, Stillfront Group AB ..........................................................................................................................................................................................
- Stillfront Group AB's Q3 2022 earnings show a strong cash flow generation of almost SEK 500 million after net working capital adjustments, enabling continued investment in their portfolio and platform.
- The company's active portfolio consists of 77 games, with mobile games accounting for 77% of the share and ad bookings making up 14% of revenues. Casual & Mash-up games represent 43% of revenues, and Strategy games 35%.
- Stillfront Group AB invested SEK 257 million in new products and their platform, representing 14.4% of their revenues, and settled SEK 290 million in 2021 cash earn-outs this quarter, with no further 2021 earn-outs remaining.
- The company achieved growth with less User Acquisition (UA) spend by leveraging live operations (live ops) and expects increased synergies from live ops across its diversified studio and game teams.
- Stillfront Group AB reported a stable uplift in Daily Active Users (DAU), Monthly Active Users (MAU), and Monthly Paying Users (MPU) year-over-year, driven by acquisitions and strong performance in Strategy games.
How to Build an Effective Offer System in Your Game
A well‑designed in‑game offer system is presented as the most potent driver of lifetime value and average revenue per paying user. By integrating a limited set of synergistic offer types—login bonuses, triggered prompts, endless streams, “1 + X” bundles, battle‑passes, stamp‑cards, and curated bundles—and optimizing their frequency, timing, pricing, segmentation, and economic balance, developers can achieve conversion rates as high as ninety‑six percent on login offers and lift repeat‑purchase value by roughly twenty percent through endless offers.
Conversion is shown to be a function of repeated exposure rather than a single impression; players typically require about seven viewings before taking action. The most effective moments to surface offers are at login, during “out‑of‑currency” events, after level failures, or in high‑momentum gameplay phases. A dynamic, tiered pricing ladder that escalates after each purchase and regresses after periods of inactivity—exemplified by a seven‑tier structure ranging from under one dollar to ninety‑nine dollars—enables precise alignment with player spend propensity while avoiding both under‑monetization of high‑potential users and alienation of low‑spenders.
Segmentation must extend beyond basic recency and frequency metrics to incorporate geographic tier, acquisition source quality, and player progression. Lower‑tier regions demand adjusted price ladders and reduced offer frequency, whereas high‑quality acquisition channels justify more complex bundles. Early‑game players respond best to inexpensive, simple offers, while mid‑ and late‑game users can be presented with higher‑value packages. Anchoring the entire shop around a stable, low‑priced entry pack establishes a reference point that shapes perceived value across all offers.
Collectively, these principles apply to mobile and casual games operating globally, reflecting current industry practices and data from recent case studies. Implementing the outlined framework promises measurable improvements in monetization efficiency, player satisfaction, and overall revenue performance.
- A tiered pricing ladder ranging from under $1 to $99, which escalates after purchases and regresses during inactivity, allows for precise alignment with individual player spend propensity.
- Conversion is driven by repeated exposure, with players typically requiring seven viewings of an offer before completing a purchase.
- Strategic implementation of a limited set of offer types can drive conversion rates as high as 96% on login offers and increase repeat-purchase value by approximately 20% through endless offers.
- Effective offer surfacing relies on high-intent moments, specifically at login, during out-of-currency events, after level failures, or during high-momentum gameplay.
- Player segmentation must incorporate geographic tier, acquisition source quality, and progression stage to adjust price ladders and offer frequency for different user profiles.
Global LiveOps Trends 2025
The global mobile gaming landscape in 2025 is characterized by a notable deceleration in overall market growth, with revenue increases stalling at 0.7% and download growth slowing to 4.1%. In response to this stagnation, developers are intensifying LiveOps strategies to sustain engagement and monetization. The average number of monthly events per game has risen to 89, shifting away from traditional holiday-centric scheduling toward persistent, competitive mechanics such as Win Streaks, Leaderboards, and various collection-based systems. This strategic pivot reflects a broader industry effort to maximize the lifetime value of existing player bases, particularly within the Midcore and Hybridcasual segments.
Genre performance is undergoing a significant realignment, as Puzzle and Strategy titles experience growth while RPG and Shooter categories face substantial declines. Midcore titles remain the primary drivers of revenue, relying on cooperative events and targeted monetization of high-spending players to maintain stability. Simultaneously, the Hybridcasual sector has emerged as a high-growth area, recording a 75% year-over-year revenue increase despite stagnant download figures. This success is largely attributed to the integration of Casual-style mechanics, such as Digging and Expedition events, which effectively boost session length and ad-based monetization.
The industry is currently defined by a move toward greater mechanical complexity and event density. By adopting diverse features like Stamp-based systems and Core Duplicates, developers are successfully diversifying their monetization strategies across different player archetypes. While Midcore games continue to prioritize whale-focused cooperative events, Hybridcasual titles are increasingly leveraging competitive, short-term engagement loops to drive performance. Ultimately, the 2025 market environment demonstrates that sustained success is no longer dependent on rapid user acquisition, but rather on the sophisticated, data-driven application of LiveOps to deepen engagement within established gaming ecosystems.
- The global mobile gaming market has stagnated, with revenue growth slowing to 0.7% and download growth to 4.1%, forcing a shift toward maximizing the lifetime value of existing players.
- Hybridcasual games have emerged as a high-growth sector, recording a 75% year-over-year revenue increase despite flat download numbers.
- LiveOps strategy has shifted toward high-frequency engagement, with the average number of monthly events per game rising to 89.
- Developers are moving away from holiday-centric calendars in favor of persistent, competitive mechanics like Win Streaks, Leaderboards, and collection-based systems.
- Genre performance is realigning, with Puzzle and Strategy titles showing growth while RPG and Shooter categories face substantial declines.
How to Prepare Your Live Ops for the Holiday Season
A well‑designed Live Ops strategy is essential for capitalising on the heightened player activity that occurs during the holiday period. Analysis of hundreds of mobile games worldwide demonstrates that a coherent Live Ops framework can produce a substantial uplift in sessions, revenue and player retention throughout the season. The core argument is that developers should treat the holidays as a series of tightly integrated, short‑term experiences that reinforce the game’s everyday loop while delivering clear, time‑bound incentives.
Short‑term events that run for one to three days are most effective for generating quick spikes in engagement. These events focus on immediate objectives—such as a burst of sessions, a specific resource collection, or a limited‑time reward—while employing a “soft‑sawtooth” difficulty curve that eases players in, ramps up challenge, offers a brief respite, and then escalates again. By keeping the event mechanics a natural extension of the main gameplay loop, developers avoid disrupting player expectations and maintain momentum.
For the broader holiday window, the most successful structures combine a single, clearly defined Battle‑Pass progression path with social‑cooperation events that reward group performance through prestige items like avatars, badges and leaderboard positions. Layering weekly quests, long‑term collection albums, and brief “bonus amplifier” events creates cumulative engagement loops. Linking these components through shared currencies and diversified motivations systematically drives both retention and monetisation, particularly for mature titles that benefit from community‑driven competition.
Overall, the guidance applies to the global mobile gaming sector during the Q4 holiday season and emphasizes that incremental, interconnected events—anchored by transparent progression and social incentives—are the key levers for maximising holiday‑season performance.
- Implement a series of short-term, 1-to-3-day events to generate immediate spikes in player engagement and session frequency.
- Structure holiday content as a 'soft-sawtooth' difficulty curve that alternates between periods of challenge and respite to maintain player momentum.
- Integrate holiday events directly into the core gameplay loop to ensure they feel like natural extensions of the existing experience rather than disruptive additions.
- Combine a single, clear Battle-Pass progression path with social-cooperation events to drive both retention and monetization through group-based prestige rewards.
- Layer weekly quests, long-term collection albums, and brief 'bonus amplifier' events to create cumulative engagement loops.
2024 Casual Gaming Apps Report
The global casual gaming market entered a period of recovery between April 2023 and April 2024, characterized by rebounding consumer spend despite a slowdown in total downloads. This shift is defined by a strategic migration from hyper-casual titles toward more complex hybrid-casual and 3D match models. User acquisition remains highly bifurcated by platform; iOS costs average $4.83 per install compared to just $0.65 on Android, though iOS continues to deliver a superior Day 7 return on ad spend. North America remains the most expensive and lucrative geographic region, while simulation games have emerged as the most cost-effective genre for acquisition.
Casual games function as a critical ecosystem driver, generating 91% of their own installs and significantly influencing mid-core titles. Puzzle subgenres, particularly Match3 and Mahjong Solitaire, now command 37% of casual installs, while the 3D Match category has seen explosive growth, increasing its US iOS market share fivefold in a single year. To sustain this growth, market leaders are increasingly relying on sophisticated LiveOps and social mechanics. Successful strategies include collaborative partner events, social win streaks, and "digging" minigames, all of which leverage group competition to drive engagement and baseline revenue.
Monetization strategies have evolved toward player choice and direct-to-consumer models. Progressive offers and "pick-one" bundles are now standard in 70% of top-performing US casual games, providing structured value through tiered rewards. Furthermore, developers are aggressively adopting engagement-linked offers and external web stores. By linking premium rewards to gameplay tasks and moving transactions to proprietary web platforms, developers are successfully bypassing traditional app store fees while fostering long-term player loyalty through exclusive digital storefronts and daily login incentives.
- The casual gaming market is shifting from hyper-casual titles toward hybrid-casual and 3D match models, with 3D Match category market share on US iOS increasing fivefold between April 2023 and April 2024.
- Developers are increasingly bypassing app store fees by adopting proprietary web stores and engagement-linked offers, a strategy now utilized by 70% of top-performing US casual games.
- User acquisition costs are highly bifurcated, with iOS installs averaging $4.83 compared to $0.65 on Android, though iOS maintains a superior Day 7 return on ad spend.
- Puzzle subgenres, specifically Match3 and Mahjong Solitaire, currently dominate the market by commanding 37% of all casual gaming installs.
- Simulation games have emerged as the most cost-effective genre for user acquisition, while casual games overall generate 91% of their own installs.
The True Cost of Building a Mobile Game Backend
This analysis examines the financial and operational costs associated with developing in-house backend technology for mobile games. The primary thesis suggests that while third-party game engines have become industry standards, backend infrastructure is currently undergoing a similar shift as the technical demands of live-service games outpace the practicality of internal development.
The findings are based on a survey of 125 C-level executives and tech leads at US-based mobile game studios with at least 50 employees, conducted in April 2024. Data indicates that the average leading US studio employs 52 developers for 36 months to build and maintain an internal backend. With an average annual salary of $138,864 per developer, the direct financial investment for a custom backend is estimated at approximately $21.6 million. The research notes that strategy and shooter genres are most likely to require these complex systems, while hypercasual games are increasingly adopting them to support "hybridcasual" live-ops models.
Beyond direct costs, the analysis identifies significant "hidden" human and operational tolls. Approximately 50% of surveyed studios reported that diverting gameplay programmers to backend tasks slowed overall game development. Furthermore, one-third of respondents experienced higher employee turnover and increased "crunch" periods, while 20% reported direct revenue loss. The study concludes that the decision to build internal tech often results in negative knock-on effects across departments, suggesting that third-party solutions offer a more sustainable path for scaling live-service titles without sacrificing personnel well-being or development velocity.
- Building an in-house mobile game backend costs an average of $21.6 million, requiring 52 developers working over a 36-month period.
- Diverting gameplay programmers to backend infrastructure tasks slows overall development velocity for 50% of surveyed studios.
- Internal backend development contributes to negative organizational outcomes, including increased employee turnover, higher rates of crunch, and direct revenue loss for 20% of studios.
- The technical demands of live-service games are driving a shift toward third-party backend solutions, mirroring the industry-wide adoption of third-party game engines.
- While strategy and shooter genres have the highest requirement for complex backend systems, the rise of 'hybridcasual' models is expanding this need to the hypercasual sector.
Mobile Gaming Benchmarks: Q1 2024
The Q1 2024 mobile gaming benchmarks provide a comprehensive analysis of player engagement metrics, specifically retention rates, session lengths, and session counts across 15 game genres. The analysis is based on data from over 10,000 games utilizing the GameAnalytics platform, representing 1.67 billion monthly active users across North America, Europe, the Middle East, and Asia. The primary objective is to offer developers a standardized framework to evaluate game performance, identify areas for optimization, and refine mechanics to improve long-term player retention and engagement.
Key findings indicate that global median retention rates for the first quarter of 2024 were 22.91% for Day 1, 4.20% for Day 7, and 0.85% for Day 28. Classic games—encompassing board, card, casino, and trivia titles—consistently outperformed other genres across most regions and metrics. While North America and Europe generally exhibit higher retention averages, the Middle East shows a distinct preference for classic games, which achieve their highest regional performance there. Puzzle games also demonstrate notable stability, maintaining consistent engagement metrics across all monitored territories.
Regarding session behavior, the global median session length is 4.45 minutes, with most genres averaging 4 to 5 sessions per day. Europe leads in session duration, while the Middle East records the highest frequency of daily sessions, particularly within the puzzle and word genres. The analysis suggests that session length and frequency are highly correlated with game pacing and social features. To optimize these metrics, the findings recommend a data-driven approach involving A/B testing, funnel analysis, and the implementation of LiveOps to adapt to player behavior in real-time.
- Global median retention rates for Q1 2024 were 22.91% for Day 1, 4.20% for Day 7, and 0.85% for Day 28.
- Classic games, including board, card, casino, and trivia titles, consistently outperformed all other genres across most regions and metrics.
- The global median session length is 4.45 minutes, with most genres averaging between 4 and 5 sessions per day.
- The Middle East records the highest frequency of daily sessions globally, particularly within the puzzle and word genres.
- Europe leads all regions in average session duration, while North America and Europe generally exhibit higher retention averages than other territories.
Mobile Gaming Benchmarks for Q1 2024
The benchmark study presents a comprehensive snapshot of mobile gaming performance during Q1 2024, focusing on key engagement metrics—retention, session length, and session count—across North America, Europe, the Middle East, and Asia. Data derive from over 10 000 games tracked by GameAnalytics, with each title typically released in at least three regions, yielding a combined monthly active user base of approximately 1.67 billion.
Retention figures reveal that the global median day‑1 retention stands at 22.91 %, day‑7 at 4.20 %, and day‑28 at 0.85 %. Classic games (board, card, casino, trivia, word) dominate retention performance, especially in the Middle East where they lead all regions. Casual and mid‑core titles lag behind, with puzzle games maintaining stable but lower retention across all markets.
Session length analysis shows a global median of 4.45 minutes, with casino and card games achieving the longest sessions in North America (≈20 min) and Europe (card games exceeding 25 min). In the Middle East, casino titles surpass 15 minutes, while Asia’s top casino games reach nearly 23 minutes. Session count averages range from 3–5 daily sessions per game, with puzzle and word games in the Middle East achieving the highest counts (≈10 sessions/day).
Methodologically, metrics are reported in quantiles—top 25 %, median, and bottom 25 %—to illustrate performance across the spectrum of developers. The report underscores that high retention, longer session lengths, and frequent session counts correlate with stronger player engagement, offering actionable insights for studios aiming to benchmark against industry leaders.

- Global median retention rates for Q1 2024 are 22.91% for day-1, 4.20% for day-7, and 0.85% for day-28.
- Classic genre titles, including board, card, casino, trivia, and word games, consistently outperform casual and mid-core titles in retention metrics across all tracked regions.
- The global median session length is 4.45 minutes, though casino and card games significantly exceed this, reaching up to 25 minutes in European markets.
- Daily session frequency typically ranges from 3 to 5 sessions, with puzzle and word games in the Middle East achieving a peak performance of approximately 10 sessions per day.
- The Middle East region shows a distinct preference for classic games, which lead retention performance in that market compared to other global regions.
Casual Gaming Apps Report 2024
The mobile gaming landscape is currently defined by a strategic shift toward casual and hybrid-casual experiences, which serve as the primary engine for industry growth and user acquisition. While the market faces significant headwinds in the form of rising acquisition costs—particularly on iOS, where the $4.83 cost-per-install is nearly eight times higher than on Android—high-performing regions like North America continue to deliver a sustainable Day 7 return on ad spend of 5.9%. This economic environment has triggered a transition away from hyper-casual titles toward puzzle games, which now command 37% of installs, and hybrid-casual models that integrate complex meta-layers and sophisticated LiveOps into accessible core mechanics.
Monetization strategies are becoming increasingly diversified as developers move beyond traditional advertising. The rise of "progressive offers" and "engagement offers" has transformed in-app purchases by tying discounts and rewards directly to active gameplay milestones. Furthermore, the industry is seeing a surge in collaborative "partner events" and social mechanics, such as win streaks and digging minigames, to stabilize and boost baseline revenues. These engagement-driven tactics are often paired with the emergence of external web stores, allowing developers to bypass platform fees and foster direct-to-consumer relationships through exclusive loyalty rewards and daily gifts.
The casualization of the market extends even to mid-core titles, which now rely on casual mechanics for 74% of their installs. Emerging subgenres like 3D match and Mahjong Solitaire are gaining significant traction, reflecting a broader trend of deepening gameplay depth within the casual category. By combining simple core loops with complex monetization structures and social event formats, developers are successfully navigating the high-cost acquisition environment to maintain long-term player retention and revenue growth across global markets.
- Puzzle games now account for 37% of all mobile gaming installs as the industry shifts away from hyper-casual titles.
- Casual mechanics are increasingly vital for mid-core titles, currently driving 74% of their total installs.
- User acquisition costs on iOS remain significantly higher than Android, with a cost-per-install of $4.83 that is nearly eight times the rate on Android.
- North American markets remain a key growth driver, delivering a sustainable Day 7 return on ad spend of 5.9%.
- Developers are increasingly utilizing external web stores to bypass platform fees and establish direct-to-consumer relationships through loyalty rewards.
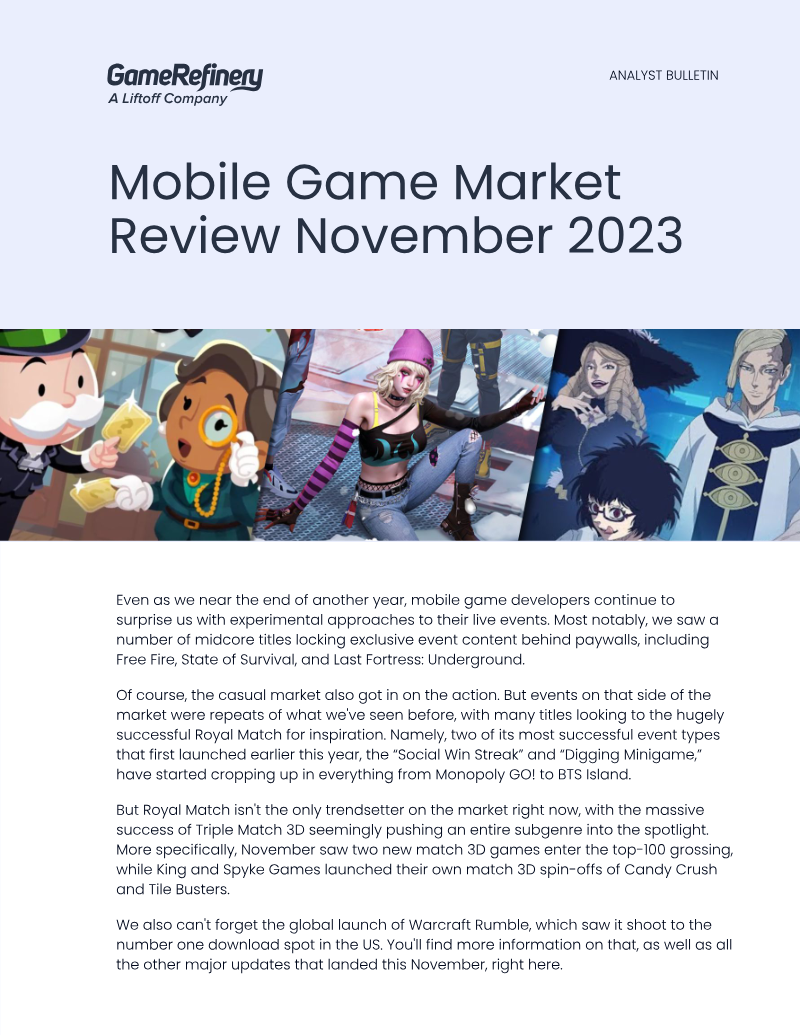
Analyst Bulletin: Mobile Game Market Review November 2023
The mobile gaming market in November 2023 was characterized by the proliferation of specific event mechanics and the rise of the 3D match subgenre. Analysis of market leaders reveals that Royal Match has become a primary trendsetter for casual titles. Its "Social Win Streak" and "Digging Minigame" mechanics were widely adopted by competitors such as Monopoly GO!, Matchington Mansion, and BTS Island. Simultaneously, the success of Triple Match 3D spurred a wave of new entries in the 3D match category, including Match Factory and spin-offs from established franchises like Candy Crush.
A significant shift occurred in the midcore segment, where developers increasingly experimented with pay-gated event content. Titles such as Free Fire, State of Survival, and Last Fortress: Underground implemented exclusive rewards and gameplay modes accessible only through direct purchases or premium currency top-ups. This trend suggests a strategic move toward more aggressive monetization of live events, moving away from purely engagement-based models to those requiring financial entry points for participation.
Geographically, the US market saw major activity with the global launch of Warcraft Rumble, which achieved the top download spot and maintained a top-50 grossing position. In China, Soul Knight Prequel demonstrated the continued strength of the roguelite genre, reaching the top of the download charts. Other notable developments included the expansion of user-generated content via the Stumble Workshop in Stumble Guys and the rapid emergence of mobile clones inspired by the viral Nintendo Switch title, Suika Game. These findings indicate a highly reactive market where developers quickly iterate on successful mechanics and viral trends across both casual and midcore segments.
- Royal Match has emerged as the primary industry trendsetter, with competitors like Monopoly GO!, Matchington Mansion, and BTS Island adopting its 'Social Win Streak' and 'Digging Minigame' mechanics.
- Midcore titles including Free Fire, State of Survival, and Last Fortress: Underground are shifting toward aggressive monetization by pay-gating exclusive event content and gameplay modes.
- The 3D match subgenre is expanding rapidly following the success of Triple Match 3D, leading to new entries like Match Factory and 3D spin-offs of established franchises such as Candy Crush.
- Warcraft Rumble's global launch in November 2023 secured the top download spot in the US market while maintaining a top-50 grossing position.
- The roguelite genre remains highly competitive in China, evidenced by Soul Knight Prequel reaching the top of the download charts.
Game Development Report 2023
The global game development landscape is currently undergoing a fundamental transition driven by escalating project complexity and the widespread adoption of live service models. With 95% of studios now pursuing or planning live service strategies, the industry faces a critical mismatch between traditional production pipelines and the need for rapid, iterative release cycles. Rising development costs affect 77% of studios, fueled by consumer demands for AAA quality and the technical debt inherent in maintaining custom middleware. Consequently, 88% of developers are actively seeking new technological solutions to address systemic inefficiencies, particularly regarding long build times and fragmented collaborative 3D art pipelines.
To mitigate these challenges, there is a significant shift toward a "buy vs. build" philosophy, with 65% of studios prioritizing off-the-shelf tools over proprietary systems to accelerate time-to-market. Modern development is increasingly adopting SaaS-inspired DevOps practices, modular architectures, and automated testing to improve developer velocity and ensure the stability required for live operations. These infrastructure investments are viewed as vital business drivers, as technical outages or defects in a live service environment result in immediate player churn and revenue loss.
The industry's future growth depends on the integration of emerging technologies such as cloud infrastructure and artificial intelligence to streamline content creation and enhance player experiences. As market saturation and production risks intensify, the move toward agile, software-centric engineering practices represents a necessary departure from legacy norms. Studios that successfully leverage these innovations to reduce technical debt and improve production sophistication are positioned to become the next generation of category leaders in an increasingly competitive global market.
- 95% of studios are now pursuing or planning live service strategies, creating a critical mismatch with traditional, non-iterative production pipelines.
- 88% of developers are actively seeking new technological solutions to resolve systemic inefficiencies, specifically targeting long build times and fragmented 3D art pipelines.
- Rising development costs, driven by AAA quality demands and technical debt from custom middleware, are currently impacting 77% of studios.
- 65% of studios are shifting to a 'buy vs. build' philosophy, prioritizing off-the-shelf tools over proprietary systems to accelerate time-to-market.
- Studios are increasingly adopting SaaS-inspired DevOps, modular architectures, and automated testing to prevent the immediate revenue loss and player churn associated with live service outages.
In-Game Events Snapshot: November 2021
In-game events have become a cornerstone of mobile game monetization and player retention, with 90% of the top 100 grossing mobile titles utilizing seasonal events. This analysis examines the strategic implementation of these live operations across major global markets, including the US, China, and Japan, focusing on data from late 2020 through late 2021.
The findings indicate that seasonal events are highly effective at re-engaging existing players and acquiring new ones. In the US, developers primarily leverage public holidays like Christmas and Halloween, while Asian markets utilize region-specific occasions such as China’s Qixi Festival and Japan’s Sakura season. Successful implementations often combine UI changes with playable content, such as the tower defense mode in Genshin Impact’s Lantern Rite event, which drove daily revenue from $200,000 to over $1.25 million. Revenue is typically generated through time-limited skins, themed currencies, and special gacha mechanics.
Promotional collaborations with external brands represent a significant growth area, appearing in 42% of the top 100 US iOS games—a steady increase since 2017. This trend is even more pronounced in Asia, where 51% of top Chinese games and 62% of top Japanese games feature collaborations. These partnerships extend beyond gaming IPs to include non-gaming brands like KFC or virtual influencers like Kizuna AI. The latter’s partnership with Sky: Children of the Light demonstrated the power of niche fanbases, pushing the game to over $1 million in daily revenue through a single $20 accessory kit.
Methodologically, the insights are derived from GameRefinery’s proprietary three-layered taxonomy, which categorizes games by category, genre, and subgenre. The data highlights that while events are ubiquitous among top-tier titles, they remain underutilized by lower-ranking games, serving as a key differentiator for market leaders across the casual, mid-core, and casino segments.
- Seasonal in-game events are a standard industry practice, utilized by 90% of the top 100 grossing mobile titles to drive player retention and monetization.
- External brand collaborations are a major growth area, appearing in 42% of top US iOS games, 51% of top Chinese games, and 62% of top Japanese games.
- Strategic event implementation can drive massive revenue spikes, such as Genshin Impact’s Lantern Rite event increasing daily revenue from $200,000 to over $1.25 million.
- Niche influencer partnerships can be highly lucrative, evidenced by a single $20 accessory kit in Sky: Children of the Light pushing daily revenue past $1 million.
- Successful events frequently combine UI overhauls with new playable content, leveraging time-limited skins, themed currencies, and special gacha mechanics to monetize.