
Whitepaper11 pages
Gaming's Cheating Crisis: The Impact on Players and Profit
The gaming industry is currently facing a widespread crisis regarding online cheating, which significantly undermines player retention, community trust, and developer revenue. This analysis, based on a survey of 2,013 gamers across the United Kingdom and the United States, reveals that cheating is no longer a fringe issue but a pervasive challenge affecting the majority of the gaming population. The findings underscore a critical need for industry-wide accountability measures to restore fair play and protect the financial health of game studios.
Data indicates that 80% of gamers have encountered cheating in online environments, with over half experiencing it at least monthly. This prevalence has direct consequences for business performance: 42% of players have considered quitting games entirely due to the presence of cheaters, and 55% have either reduced or ceased in-game spending. The impact is particularly acute among high-value players who spend between $11 and $50 monthly, a segment that represents the revenue backbone for many developers.
Despite these challenges, the gaming community remains highly receptive to robust solutions. A significant 83% of respondents expressed a greater likelihood to play games marketed as cheat-free, and 73% are willing to undergo identity verification to ensure a fair environment. Furthermore, there is strong support for systemic accountability, with 79% of gamers advocating for penalties that apply across multiple titles to prevent ban evasion.
The research concludes that while traditional anti-cheat measures are necessary, they are insufficient without mechanisms that enforce persistent, cross-game consequences. By adopting identity-based verification and unified accountability systems, developers have a clear opportunity to mitigate the negative financial impacts of cheating, improve player retention, and foster more sustainable, trustworthy gaming communities.
- Cheating is a pervasive issue, with 80% of gamers encountering it and over 50% experiencing it at least monthly.
- The presence of cheaters directly impacts revenue, as 55% of players have reduced or stopped in-game spending, particularly among high-value spenders.
- Cheating is a significant churn driver, with 42% of players reporting they have considered quitting games entirely due to unfair play.
- There is strong consumer demand for stricter security, with 83% of players more likely to play games marketed as cheat-free and 73% willing to undergo identity verification.
- 79% of gamers support systemic, cross-title penalties to prevent ban evasion and ensure persistent accountability.
+2
PlaySafe IDJan 2025

Report37 pages
2025 GDC Trends Report
The global video game industry is undergoing a strategic pivot toward operational sustainability and niche market penetration as of 2025. Developers are increasingly moving away from high-risk, large-scale AAA live service projects in favor of smaller, cost-effective titles that prioritize player retention over aggressive acquisition. This shift is mirrored in the mobile sector, where hybrid-casual models and data-driven advertising are gaining prominence, alongside a notable resurgence in HTML5 gaming as a platform for broader accessibility.
Technological integration remains a primary driver of industry evolution, particularly regarding generative AI and extended reality. While AI tools are being rapidly adopted to accelerate prototyping and enhance non-player character complexity, their implementation is tempered by significant concerns surrounding copyright, ethics, and long-term job security. Simultaneously, the VR, AR, and MR sectors are transitioning toward mass-market accessibility, with a focus on affordable hardware and the development of immersive multiplayer experiences. These trends are underscored by the success of titles like Balatro, which exemplify the growing market appetite for innovative, independent-minded gameplay.
The industry is also experiencing a fundamental change in its social and structural foundations. The formalization of labor organization, exemplified by the debut of the United Videogame Workers, reflects a growing commitment to addressing developer burnout and workplace equity. Furthermore, the industry is standardizing accessibility through initiatives like the ESA’s Accessible Games program, recognizing that inclusive design is essential for long-term growth. As funding becomes more selective, developers are increasingly relying on robust community building as a primary mechanism to secure investment and ensure the viability of their projects in a competitive global landscape.
- Developers are shifting away from high-risk AAA live service projects to prioritize smaller, cost-effective titles that focus on long-term player retention.
- Generative AI is being widely adopted to accelerate prototyping and increase NPC complexity, though its use remains constrained by ongoing ethical, copyright, and job security concerns.
- The mobile gaming sector is pivoting toward hybrid-casual models and data-driven advertising, while HTML5 gaming is seeing a resurgence as a tool for broader accessibility.
- The VR, AR, and MR sectors are moving toward mass-market adoption by prioritizing affordable hardware and immersive multiplayer experiences.
- Labor organization is becoming formalized, with groups like the United Videogame Workers emerging to address industry-wide issues of developer burnout and workplace equity.
+1
Game Developers ConferenceJan 2025

Report19 pages
Global Gaming M&A and Growth Financing Advisory: Q1 2025
The global gaming industry experienced a notable resurgence in early 2025, characterized by a rebound in merger and acquisition activity and sustained interest in private financing. During the first quarter, 48 announced acquisitions reached a total value of $4.4 billion, anchored by the significant $3.5 billion acquisition of Niantic’s games division by Scopely. Simultaneously, the private placement market remained active, recording 149 deals worth $3.5 billion. These investments were primarily concentrated in mobile-focused developers and companies integrating artificial intelligence into their entertainment platforms, with major strategic entities like Savvy Games Group and Tencent continuing to drive market momentum.
Despite this activity, the financial landscape remains bifurcated. While the broader sector shows signs of recovery, with the Drake Star Gaming Index posting a 16.37% gain, performance remains highly volatile across the top 35 public gaming companies. Valuation disparities are particularly pronounced; industry leaders such as NVIDIA and AppLovin command premium revenue multiples, while many other firms face a more challenging environment. Furthermore, while early-stage funding remains accessible, later-stage financing continues to present significant hurdles for companies seeking capital.
Looking forward, the industry is positioned for a gradual increase in consolidation as public markets stabilize. Strategic focus is shifting toward the integration of AI and advanced technological platforms, which are expected to serve as primary catalysts for future growth. As market conditions improve, the sector is likely to see a renewed pipeline of initial public offerings, signaling a transition toward a more mature and diversified investment climate for global gaming stakeholders.
- Q1 2025 saw 48 M&A deals totaling $4.4 billion, headlined by Scopely’s $3.5 billion acquisition of Niantic’s games division.
- The private placement market recorded 149 deals worth $3.5 billion, with capital primarily flowing into mobile developers and AI-integrated entertainment platforms.
- The Drake Star Gaming Index rose 16.37% in Q1 2025, though performance remains volatile across the top 35 public gaming companies.
- Valuation gaps are widening, with industry leaders like NVIDIA and AppLovin commanding premium revenue multiples while other firms face significant capital constraints.
- While early-stage funding remains accessible, companies seeking later-stage financing continue to face substantial hurdles.
+2
Drake StarJan 2025

Report65 pages
The State of AAA Game Advertising: 2023 Review
The 2023 AAA game advertising landscape underwent a strategic pivot toward launch-focused campaigns, with new releases accounting for half of all top-tier spending. This shift reflects a broader industry trend of prioritizing high-impact, multi-channel visibility to capture immediate market share. While YouTube remains the dominant advertising medium for PC and console titles, publishers have increasingly diversified their media mix by integrating Facebook, TikTok, and Instagram to target specific demographics. This evolution in outreach is complemented by a growing reliance on platform-based partnerships, such as deep Xbox branding and hardware collaborations, which serve to anchor major titles within broader ecosystem strategies.
Creative execution in 2023 varied significantly based on the title’s core value proposition. Successful campaigns ranged from the consistent, exploration-themed branding of single-player experiences like Hogwarts Legacy to the dark, horror-inspired aesthetics and live-service integration of titles like Diablo IV. Furthermore, the industry increasingly utilized transmedia efforts and review-based accolades to sustain momentum. However, the year also highlighted the risks of fragmented marketing, as seen with Call of Duty: Modern Warfare III, which suffered from a lack of a cohesive reveal campaign and negative consumer perception regarding its status as a standalone sequel.
Ultimately, the year demonstrated that while massive advertising budgets and established intellectual property remain primary drivers for AAA success, organic viral growth and streamlined gameplay models also provide viable paths to market dominance. The industry is currently defined by a tension between traditional, high-spend multi-channel campaigns and the rising influence of mobile-first strategies and community-driven engagement. As publishers navigate these shifting dynamics, the ability to align creative messaging with specific platform strengths and cross-industry partnerships has become the definitive factor in maintaining visibility within an increasingly competitive global market.
- In 2023, AAA publishers shifted toward launch-focused campaigns, with new releases accounting for 50% of all top-tier advertising expenditure.
- While YouTube remains the primary advertising medium for PC and console games, publishers are increasingly diversifying their media mix by integrating Facebook, TikTok, and Instagram to target specific demographics.
- Strategic platform-based partnerships, such as deep Xbox branding and hardware collaborations, are now essential for anchoring major titles within broader ecosystem strategies.
- The failure of Call of Duty: Modern Warfare III demonstrated that fragmented marketing and a lack of a cohesive reveal campaign can severely damage consumer perception and market performance.
- Successful 2023 campaigns utilized varied creative strategies, ranging from exploration-themed branding for single-player titles like Hogwarts Legacy to horror-inspired aesthetics and live-service integration for Diablo IV.
+3
Sensor TowerJan 2025

Report25 pages
The Big Game Engine Report: 2025
The game engine landscape is undergoing a significant transition as developers increasingly move away from proprietary, in-house solutions in favor of established third-party platforms. This shift is driven by the need for immediate development readiness, access to advanced graphical features like Nanite and Lumen, and the ability to leverage a broader, pre-trained talent pool. While custom engines historically dominated the industry, their market share has declined sharply over the last decade, falling to approximately 13% of new releases by 2024.
Unreal Engine has emerged as the primary beneficiary of this trend, particularly among large-scale AAA studios. By 2024, Unreal Engine and custom engines collectively accounted for the majority of unit sales on Steam, with Unreal Engine 5 becoming the industry standard for high-fidelity projects. Conversely, Unity maintains a dominant position in terms of the sheer volume of games released, particularly within the indie and smaller-scale development sectors. However, Unity faces intensifying competition from smaller, specialized engines like Godot and GameMaker, which have captured a growing segment of the indie market.
The analysis, which covers over 13,000 games released on Steam, utilizes proprietary tagging and estimation methodologies to track engine adoption trends. Data indicates that engine preference is heavily influenced by game scale and genre; high-graphics, large-budget titles skew heavily toward Unreal Engine, while strategy and simulation games remain strongholds for Unity. Looking toward 2030, the industry is expected to see continued consolidation as more studios abandon legacy in-house tools to mitigate the high costs of engine maintenance, further cementing the market dominance of third-party public engines.
- Proprietary in-house engines have seen their market share of new game releases decline to approximately 13% by 2024.
- Unreal Engine 5 has established itself as the industry standard for high-fidelity, large-scale AAA projects.
- Unity maintains market dominance by volume, particularly within the indie and smaller-scale development sectors.
- Engine selection is highly correlated with project type, as high-graphics titles favor Unreal Engine while strategy and simulation games remain concentrated in Unity.
- Specialized engines like Godot and GameMaker are successfully capturing an increasing share of the indie market, intensifying competition for Unity.
+3
VG InsightsJan 2025

Report40 pages
The Gaming App Insights Report 2025: Unlocking Growth Opportunities for Mobile Marketers
The mobile gaming industry is entering a period of strategic recalibration, projected to reach $126.1 billion in revenue by 2025. This growth is underpinned by a transition toward hybrid monetization models and the integration of AI-powered personalization to combat persistent retention challenges. While global install volume grew by 4% in 2024, the market exhibits a distinct geographic divide; North American and European markets face stagnation, whereas Latin America and the Middle East and North Africa regions demonstrate robust expansion. Success in this evolving landscape requires developers to move beyond traditional acquisition, favoring diversified channels such as Connected TV and localized, player-centric engagement strategies.
Data from early 2025 indicates that user tracking remains a pivotal operational hurdle, with global App Tracking Transparency opt-in rates hovering at 37.9%. Although arcade games have seen notable improvements in opt-in performance, the United States remains relatively static at 32%, underscoring the necessity for refined messaging strategies to maintain visibility. Concurrently, the industry is grappling with a complex financial environment characterized by rising costs per install and declining average revenue metrics. These headwinds are forcing a shift in marketing tactics, as developers increasingly rely on a broader array of acquisition partners and data-informed creative experimentation to sustain growth.
Ultimately, the path to profitability in 2025 lies in prioritizing long-term player value over short-term acquisition metrics. By leveraging AI-driven optimization and fostering community-building initiatives, developers can mitigate the impact of declining revenue per user. The industry is clearly moving toward a more sophisticated, data-reliant ecosystem where the ability to measure performance across fragmented channels—including mobile and Connected TV—is essential for maintaining a competitive advantage in a maturing global market.
- The mobile gaming market is projected to reach $126.1 billion in revenue by 2025, driven by a shift toward hybrid monetization and AI-powered personalization.
- Global install volume grew by 4% in 2024, but growth is geographically polarized with stagnation in North America and Europe contrasted by expansion in Latin America and the MENA region.
- Global App Tracking Transparency (ATT) opt-in rates remain low at 37.9%, with the United States market stagnant at a 32% opt-in rate.
- Developers face a challenging financial environment defined by rising costs per install and declining average revenue metrics, necessitating a shift toward long-term player value over short-term acquisition.
- To sustain growth, developers must diversify acquisition channels beyond traditional mobile ads, specifically integrating Connected TV and data-informed creative experimentation.
+5
GamingReportJan 2025

Report15 pages
Interactive Entertainment: Global Market Sizing & Forecast 2025
The global interactive entertainment market is poised for a recovery in 2025, with total consumer spending projected to reach $250.2 billion, representing a 4.6% year-over-year growth. This rebound follows a period of cyclical transition, characterized by a significant contraction in console hardware sales and a strategic shift toward efficiency and transmedia integration among major industry players. The analysis, which synthesizes company financials and industry data, highlights a market moving toward next-generation experiences while navigating economic uncertainty.
Software publishing remains the primary revenue driver, expected to total $196 billion in 2025. Mobile gaming continues to lead as the largest segment, with $115.7 billion in projected 2025 revenue, despite ongoing challenges related to market saturation and rising user acquisition costs. Conversely, the hardware sector is experiencing a sharp 31% decline in console revenue for 2024, signaling the end of the current console cycle. However, this is partially offset by resilient growth in gaming PC components and a consistent demand for gaming accessories, which are forecasted to grow by 5% in 2025.
Emerging technologies, including virtual reality, blockchain gaming, and web-based platforms, show potential for growth but remain secondary to established software markets. Meanwhile, the esports and live-streaming sectors face persistent profitability challenges, with esports revenue trending downward. In response to these pressures, major entertainment conglomerates are pivoting toward transmedia strategies and in-game advertising, leveraging established intellectual property to engage audiences across digital worlds. Industry leadership remains optimistic, focusing on operational efficiency and high-profile content releases to sustain long-term growth through 2025 and beyond.
- The global interactive entertainment market is projected to reach $250.2 billion in 2025, marking a 4.6% year-over-year recovery.
- Software publishing remains the dominant revenue driver at $196 billion, with mobile gaming leading the sector at $115.7 billion despite rising user acquisition costs.
- The console hardware sector is in a significant downturn, evidenced by a 31% decline in revenue during 2024 as the current cycle concludes.
- Gaming PC components and accessories are providing a buffer against hardware losses, with a forecasted growth rate of 5% in 2025.
- Major industry players are shifting toward transmedia strategies and in-game advertising to leverage existing intellectual property amid economic uncertainty.
+3
AldoraJan 2025

Report23 pages
2025 Mobile Gaming Benchmarks
The mobile gaming landscape in 2024 faced significant challenges regarding player loyalty, as 75 percent of titles failed to maintain a 3 percent retention rate by the 28th day. This decline underscores a critical industry shift where long-term viability is increasingly tethered to sophisticated content pacing, refined progression systems, and seamless onboarding experiences. Because retention serves as the primary engine for both user acquisition return on investment and sustainable monetization, developers must prioritize data-backed strategies to mitigate rising churn rates across the global market.
Engagement metrics reveal a nuanced performance gap between platforms and regions. While iOS continues to demonstrate superior early-stage engagement compared to Android, regional behaviors vary significantly; the Middle East currently leads in retention, whereas Africa and Oceania report the highest average playtime and session lengths, respectively. Genre-specific performance further complicates these trends, as Board and Card games exhibit robust long-term retention, contrasting sharply with Multiplayer titles that struggle to retain users despite commanding the longest average session durations of 8 to 9 minutes.
These insights, derived from an expansive dataset of over 100,000 active games, highlight the necessity of granular performance benchmarking. By comparing individual game metrics—including monetization, engagement, and retention—against global standards filtered by genre and player spending habits, studios can effectively optimize their development cycles. Ultimately, the industry is moving toward a model where success is no longer defined by broad acquisition, but by the precise, data-driven calibration of the player experience to ensure longevity in an increasingly competitive mobile ecosystem.
- 75 percent of mobile games failed to achieve a 3 percent retention rate by day 28 in 2024, highlighting a widespread struggle to maintain long-term player loyalty.
- Retention is the primary driver for both user acquisition ROI and sustainable monetization, making it the most critical metric for long-term viability.
- Multiplayer titles command the longest average session durations of 8 to 9 minutes but struggle significantly with long-term user retention.
- Board and Card games currently demonstrate the most robust long-term retention performance compared to other genres.
- Regional engagement varies significantly, with the Middle East leading in retention, while Africa and Oceania lead in average playtime and session length, respectively.
+2
GameAnalyticsJan 2025

Report25 pages
The Big Game Engine Report: End of the Era of In-House Engines
The game engine landscape is undergoing a significant structural shift, characterized by the decline of proprietary in-house technology in favor of established third-party platforms. While custom engines historically dominated the industry, their market share has eroded substantially over the last decade, falling to approximately 13 percent of new releases by 2024. This transition is driven by the increasing complexity of modern development, which makes the maintenance of internal engines cost-prohibitive and less efficient compared to the immediate, high-fidelity capabilities offered by public alternatives.
Unreal Engine has emerged as the primary beneficiary of this trend, particularly within the AAA segment. Following the release of Unreal Engine 5, the platform has successfully reclaimed market share lost during the pandemic, becoming the preferred choice for large-scale, high-budget productions. Conversely, Unity maintains a dominant position in terms of total volume of games released, particularly among indie and smaller developers, though it faces increasing competition from smaller engines like Godot, which has seen notable growth since 2020. Despite Unity’s high release volume, Unreal Engine and custom AAA engines continue to command a larger portion of total units sold, underscoring their prevalence in high-performing commercial titles.
The analysis relies on data from over 13,000 games released on Steam, utilizing proprietary estimation algorithms and tagging methodologies to categorize engine usage by game size, genre, and unit sales. The findings indicate that while the choice of engine is often dictated by project scale—with smaller titles favoring Unity and larger, graphics-intensive projects gravitating toward Unreal Engine—the industry is moving toward a standardized ecosystem. As studios weigh the benefits of third-party support, talent accessibility, and advanced graphical features against the loss of proprietary control, the reliance on external engines is expected to continue its upward trajectory through 2030.
- Proprietary in-house engine usage has declined significantly, accounting for only 13 percent of new game releases by 2024.
- Unreal Engine has become the industry standard for high-budget AAA productions, particularly following the release of Unreal Engine 5.
- Unity maintains the highest total volume of game releases, primarily driven by adoption among indie and smaller-scale developers.
- While Unity leads in release volume, Unreal Engine and custom AAA engines command a larger share of total units sold in the commercial market.
- The open-source Godot engine has experienced notable growth since 2020, emerging as a competitive alternative to established platforms.
+3
Video Game InsightsJan 2025

Report23 pages
The State of Puzzle Games: An Analysis of the Puzzle Category in Mobile Gaming
The mobile puzzle game market is undergoing a significant structural evolution, characterized by a shift in product models and a notable rise in hybridcasual gaming. This analysis, covering global data from January 2018 through June 2023, examines the performance of various puzzle sub-genres, including swap, blast, chain, and pair mechanics. By leveraging store intelligence and download estimates from the Apple App Store and Google Play, the findings highlight how developers are increasingly integrating meta-features and diversified monetization strategies to sustain revenue in a maturing landscape.
A central finding is the remarkable growth of the hybridcasual product model, which saw a 430% increase in revenue between early 2022 and early 2023. While traditional casual games continue to dominate overall market share through consistent operations and robust meta-features, they have experienced modest declines in both downloads and revenue. Conversely, hybridcasual titles—particularly within the pair sub-genre—have successfully captured user interest by blending accessible gameplay with more sophisticated monetization tactics, such as in-app purchases, which were previously less common in hypercasual-leaning segments.
The data indicates that sub-genres like pair have emerged as high-growth areas, with hybridcasual revenue in this category rising from $7 million in the first quarter of 2022 to $40 million by the first quarter of 2023. Meanwhile, other established sub-genres, such as merge and physics, have seen download declines as their reliance on hypercasual models wanes. Successful top-tier games across all categories now frequently employ a combination of live operations, season passes, and social clans to drive engagement. Ultimately, the puzzle market is moving toward a hybrid approach, where the simplicity of casual mechanics is increasingly supported by the deeper monetization and retention frameworks typically associated with mid-core titles.
- The hybridcasual puzzle model experienced a 430% revenue increase between early 2022 and early 2023, signaling a major shift in market structure.
- Hybridcasual revenue in the 'pair' sub-genre grew from $7 million in Q1 2022 to $40 million in Q1 2023.
- Traditional casual puzzle games are experiencing modest declines in both downloads and revenue despite maintaining overall market share through robust meta-features.
- Established sub-genres like merge and physics are seeing download declines as their reliance on hypercasual models diminishes.
- Top-tier puzzle games are increasingly adopting mid-core retention and monetization strategies, including live operations, season passes, and social clans.
+3
Sensor TowerJan 2025
Report20 pages
The Importance of Wishlists in 2025: Do Wishlists Matter?
Steam wishlists serve as a critical metric for predicting commercial success in the video game industry, functioning as a primary indicator of pre-launch momentum. Data analysis reveals that wishlist distribution is highly top-heavy, with a significant majority of games launching with fewer than 10,000 wishlists, while only a small fraction of titles achieve the 100,000-plus threshold required to reliably forecast a breakout performance. There is a strong 70% correlation between pre-launch wishlist counts and first-month unit sales, particularly for titles that surpass the 100,000-wishlist milestone.
Genre-specific trends highlight that action and adventure titles consistently generate the highest levels of pre-release buzz, often benefiting from the brand equity and marketing budgets of AAA and AA publishers. Conversely, casual and MMO titles frequently rely on post-launch engagement, such as live updates and community building, rather than pre-release wishlist accumulation. Regardless of genre, the timing of a Steam page launch is vital; top-performing games typically establish their presence six to twelve months before release, utilizing a steady stream of trailers and development updates to build and maintain audience interest.
The findings are based on an analysis of games launched on Steam from March 2024 onwards, utilizing proprietary estimation models and industry data. The research emphasizes that while wishlists are not a guarantee of success for every title, they act as a essential barometer for market interest. For developers and publishers, the data underscores that early visibility and sustained marketing efforts are necessary to reach the wishlist tiers that statistically correlate with long-term commercial viability.
- Steam wishlists are a primary indicator of commercial success, showing a 70% correlation between pre-launch counts and first-month unit sales.
- The 100,000-wishlist threshold is the critical benchmark required to reliably forecast a breakout performance for a new title.
- The vast majority of games launch with fewer than 10,000 wishlists, reflecting a highly top-heavy distribution of pre-launch momentum.
- Top-performing titles typically establish their Steam page six to twelve months before release to maintain audience interest through consistent updates.
- Action and adventure games generate the highest pre-release buzz, while casual and MMO titles rely more heavily on post-launch engagement than wishlist accumulation.
+3
Video Game InsightsJan 2025

Report49 pages
Target, Connect, Engage: Driving Profitable App Growth
Achieving sustainable mobile app growth in a privacy-centric digital landscape requires a sophisticated integration of precise measurement tools and advanced advertising optimization. The primary objective of modern mobile marketing is to shift focus from simple installation metrics toward high-value user engagement and long-term profitability. By leveraging Mobile Measurement Partners (MMPs) in tandem with platform-specific optimization features, brands can navigate complex cross-channel user journeys, mitigate ad fraud, and significantly improve their return on ad spend.
Data-driven strategies, specifically those utilizing App Event Optimization and Value-Based Optimization, serve as the foundation for scaling performance. These methodologies allow advertisers to move beyond broad acquisition tactics, instead employing granular audience segmentation and real-time tracking to identify and retain high-value users. Case studies involving major global brands such as Burger King, Rappi, and Carrefour demonstrate that this technical synergy consistently yields substantial improvements in conversion rates and overall revenue. For instance, integrated campaigns have successfully driven multi-fold increases in return on investment, proving that technical precision directly correlates with commercial success.
The scope of these strategies encompasses global mobile markets, focusing on the intersection of social media advertising and third-party attribution. Success in this environment relies on a structured, agile approach that prioritizes diversified creative testing and consistent budget management. By combining the analytical depth of an MMP with the reach and targeting capabilities of platforms like TikTok, developers can effectively lower customer acquisition costs while maximizing user lifetime value. Ultimately, the integration of these technologies is essential for any organization seeking to maintain a competitive edge in the evolving mobile ecosystem.
- Mobile marketing strategy must shift from simple installation metrics to prioritizing high-value user engagement and long-term profitability to ensure sustainable growth.
- Integrating Mobile Measurement Partners (MMPs) with platform-specific optimization tools is essential for navigating cross-channel journeys, mitigating ad fraud, and improving return on ad spend.
- App Event Optimization and Value-Based Optimization are the primary methodologies for scaling performance through granular audience segmentation and real-time tracking.
- Global brands including Burger King, Rappi, and Carrefour have achieved substantial improvements in conversion rates and multi-fold increases in ROI by utilizing integrated, data-driven campaigns.
- Lowering customer acquisition costs while maximizing user lifetime value requires a combination of analytical depth from MMPs and the reach of social media platforms like TikTok.
+2
KingJan 2025
Report26 pages
Key Insights into Role-Playing Games (RPGs)
Role-Playing Games (RPGs) represent the highest-revenue genre in the global gaming market as of 2022. The genre is characterized by deep character development, party-based mechanics, and progression systems centered on quests and combat. While RPGs are played across all platforms, they maintain a strong presence on PC and console, where they consistently rank among the top genres for monthly active users.
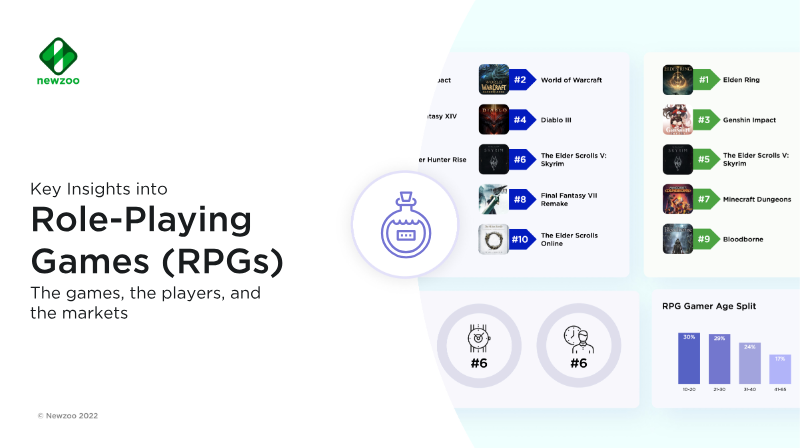
The demographic profile of the RPG audience is predominantly male, accounting for 58% of players, and skews toward younger age groups, with 59% of the player base falling between the ages of 10 and 30. Engagement patterns reveal that RPG players are highly active, averaging 18.8 sessions per month. The genre also demonstrates significant cross-genre appeal, with high player overlap in the adventure, shooter, and battle royale categories. High magical fantasy remains the most popular thematic element, utilized by 63% of the player base, while skill and talent trees serve as the most prevalent gameplay mechanic.
Monetization within the RPG space is dominated by pay-to-play models, which reach 97% of the player base, followed closely by in-app purchases at 90%. Geographically, the United States and Japan lead in monthly active users on PC and console. The genre also maintains a robust live-streaming presence, generating 205 million hours watched across platforms like Twitch and Facebook Gaming in June 2022. These insights are derived from data covering 37 markets, excluding China and India, and utilize proprietary gamer segmentation to analyze player motivations, viewing habits, and engagement metrics across the broader gaming ecosystem.
- As of 2022, Role-Playing Games (RPGs) rank as the highest-revenue genre in the global gaming market.
- The player base is predominantly male (58%) and young, with 59% of users falling between the ages of 10 and 30.
- Monetization is heavily driven by pay-to-play models used by 97% of the player base, supplemented by in-app purchases at 90%.
- High magical fantasy is the dominant theme, appearing in 63% of RPGs, while skill and talent trees remain the most prevalent gameplay mechanics.
- RPG players exhibit high engagement, averaging 18.8 sessions per month, with significant audience overlap in the adventure, shooter, and battle royale genres.
+2
NewzooJan 2025

Report66 pages
Insights Into Global Mobile Game Marketing Trends
The analysis demonstrates that mobile‑game marketing is increasingly driven by real‑time, AI‑enhanced creative data sourced from a global platform covering more than 80 countries and 1.6 billion daily‑updated assets. This infrastructure enables marketers to identify high‑quality, short‑form clips—particularly TikTok‑style and live‑action videos—that accelerate testing cycles and reduce acquisition costs. User acquisition remains the primary lever for installs, while retargeting is essential to sustain engagement and monetization. Emerging formats such as non‑intrusive in‑game audio ads and custom product pages are gaining traction, reflecting a broader shift toward data‑driven, AI‑augmented strategies.
Genre‑level insights reveal that role‑playing games dominated advertising in the first half of 2025, with a competitive creative volume of 224 monthly assets per genre. Casino titles experienced a 14.5 % year‑over‑year increase in advertiser share, while tower‑defense gameplay surged across top titles. Geographic intensity is highest in North America and Europe, with Southeast Asia following closely; all regions exhibit a pronounced move toward AI‑generated creatives. North American advertisers grew 25.8 % in H1 2025, deploying over 5 million creatives and favoring high‑quality portrait formats (720×1280, 52 s) that drive strong engagement metrics.
The study identifies a critical mismatch between creative freshness and acquisition costs, noting that many campaigns suffer from delayed updates and poorly targeted landing pages. Recommendations emphasize increasing creative refresh rates, refining audience segmentation, and rigorous A/B testing to sustain novelty and improve return on investment. Overall, the findings underscore a mobile‑gaming ecosystem that is rapidly adopting AI‑driven creative production and diversified monetization tactics, with North America and Europe leading in both volume and innovation.
- Mobile game marketing is shifting toward AI-enhanced creative production, leveraging global platforms to identify high-performing short-form, live-action, and TikTok-style video assets.
- North American advertising activity grew by 25.8% in H1 2025, with advertisers deploying over 5 million creatives, predominantly favoring 720x1280 portrait formats.
- Role-playing games led advertising volume in H1 2025 with 224 monthly assets per genre, while casino titles saw a 14.5% year-over-year increase in advertiser share.
- Campaign performance is currently hampered by a mismatch between creative freshness and acquisition costs, necessitating higher refresh rates and more rigorous A/B testing.
- User acquisition remains the primary driver for installs, though retargeting is essential for sustaining long-term engagement and monetization.
+1
SocialPetaJan 2025

Report32 pages
Hybrid Casual Games Playbook
Hybridcasual games blend the instant‑on‑tap simplicity of hyper‑casual titles with deeper progression systems that encourage sustained engagement. The playbook outlines the genre’s rise, noting a 3 % download growth in 2022 to 5 billion downloads—up from 4.9 billion in 2021—while hyper‑casual downloads fell 15 %. Revenue has nearly doubled over two years, with ads contributing about 50 % of total earnings and in‑app purchases accounting for the remainder. Session lengths average 372 seconds, a 160‑second increase over hyper‑casual games, and retention rates at day 30 reach 54 % versus 42 % for hyper‑casual titles, with day 60 retention at 9 % versus 1 %.
The document surveys sub‑genres such as Arcade Idle, Tower Defense, and Interactive Story, citing successful titles like Aquarium Land, City Defense!, and Fight for America. It highlights how hybrid mechanics—drawing towers, RPG‑style upgrades, or automated idle workers—boost lifetime value by 17–35 % in some cases. Methodology relies on aggregate download and revenue data from 2020‑2022, coupled with in‑house analytics tracking session length, retention, and monetization funnels.
Best‑practice guidance centers on marketability, economy tuning, A/B testing, and post‑launch optimization. Case studies of Zombie Defense illustrate how adding narrative layers, social features, and tiered in‑app purchase options can lift LTV to $2+ on day 7. The playbook concludes that sustained success in Hybridcasual hinges on balancing accessibility with meta‑depth, maximizing IAP revenue, and continuously refining content based on player segmentation.
- Hybrid-casual games are outperforming hyper-casual titles, with 5 billion downloads in 2022 (a 3% increase) compared to a 15% decline in hyper-casual downloads.
- Hybrid-casual games achieve significantly higher retention, with day-30 retention at 54% (vs. 42% for hyper-casual) and day-60 retention at 9% (vs. 1%).
- Revenue is split evenly between ads and in-app purchases, with session lengths averaging 372 seconds, which is 160 seconds longer than hyper-casual benchmarks.
- Integrating hybrid mechanics like RPG-style upgrades and automated idle systems can increase player lifetime value by 17–35%.
- Successful titles such as Zombie Defense demonstrate that adding narrative layers and tiered in-app purchase options can drive day-7 lifetime value to over $2.
+1
Sensor TowerJan 2025

Report20 pages
Global Gaming Report Q2 2025
Public gaming equities surged in the first half of 2025, with the Drake Star Gaming Index climbing 28 % compared to a modest 5 % gain in the S&P 500. Leading performers included Square Enix, Roblox and Konami, underscoring a robust rebound in the sector. M&A activity remained steady at 46 deals, highlighted by Krafton’s $516 million purchase of ADK and Epic Games’ acquisition of AI studio Loci. Private‑market financing reached $3 billion across 110 placements, driven by high‑profile exits such as Dream Games’ $2.5 billion minority stake sale to CVC and Apple’s acquisition of RAC7 for its arcade portfolio. Projections indicate a continued rise in M&A and IPO activity through 2026, with artificial intelligence and technology platforms identified as primary growth catalysts.
Private‑placement capital in Q2 2025 totaled $2.6 billion across 24 deals, with the largest transaction—a $5 billion minority stake sale—valuing its target at nearly $5 billion. Deal distribution spanned mobile ($1.5 billion), PC/console ($0.8 billion), platform/tools ($0.4 billion), esports ($0.3 billion) and blockchain/VR‑AR ($0.2 billion). Key investors included CVC, Blackstone, Tencent and Bessemer Venture Partners. Notable exits such as Dream Games’ $2.5 billion minority sale and Arrowhead’s $80 million investment provided significant liquidity for early‑stage venture capitalists.
Valuation analysis reveals a pronounced divergence between high‑growth Asian titles and mature Western peers. Tencent (EV/EBITDA ≈ 5.7x, revenue growth 10%) and Sea Limited (EV/EBITDA ≈ 4.1x, revenue growth 30%) command premium multiples and robust double‑digit growth, reflecting investor appetite for fast‑growing Asian firms. In contrast, U.S. hardware and platform players such as NVIDIA (EV/EBITDA ≈ 17.9x, revenue growth 43%) and Unity (EV/EBITDA ≈ 6.2x, revenue growth –17%) exhibit lower multiples and mixed performance, indicating more modest valuations amid fluctuating earnings. This geographic and segmental disparity underscores the continued premium placed on rapid growth in emerging markets while mature Western companies face a more cautious valuation environment.
- Public gaming equities significantly outperformed the broader market in H1 2025, with the Drake Star Gaming Index rising 28% compared to a 5% gain in the S&P 500.
- Private-market financing reached $3 billion across 110 placements in H1 2025, bolstered by major exits such as Dream Games’ $2.5 billion minority stake sale to CVC.
- M&A activity remains steady with 46 deals recorded in H1 2025, including Krafton’s $516 million purchase of ADK and Epic Games’ acquisition of AI studio Loci.
- Investor sentiment shows a clear geographic divide, with high-growth Asian firms like Sea Limited (30% revenue growth) commanding premium multiples compared to the mixed performance of mature Western platform players like Unity.
- Q2 2025 private-placement capital totaled $2.6 billion, with mobile gaming leading the sector at $1.5 billion, followed by PC/console at $0.8 billion.
+1
Drake StarJan 2025

Report37 pages
The Industry Quest for Growth
Global games spending reached a record $199.4 bn in 2024, rising 3.5 % year‑over‑year and projected to stabilize near $200 bn in 2025 with modest growth thereafter. The sector remains smaller than the broader video‑related entertainment market but is nine times larger than recorded music, underscoring its expanding economic footprint. Key growth levers include a $7‑8 bn upside from Nintendo’s Switch 2, which is expected to sell 103 million units by 2030, and an additional $1‑2 bn from enhanced in‑game monetisation. Emerging markets—particularly the Middle East, Africa, and Southeast Asia—offer significant upside driven by youthful, mobile‑savvy populations.
The launch delay of GTA VI is anticipated to shave $2.7 bn from 2025 console spend, creating a sales window for other publishers and Nintendo to capture holiday‑season revenue. Untapped consumer cohorts, such as 16‑24 year‑old females and players aged 55+, represent further opportunities for market expansion.
Publishers are responding to slower growth by shifting toward higher‑margin, low‑cost strategies. Remasters and remakes—examples include Resident Evil 4 and the Final Fantasy VII remake—are becoming primary revenue engines. Simultaneously, platform diversification across PC, console, and direct‑to‑consumer web stores, coupled with hybrid monetisation models that blend advertising, in‑app purchases, and subscriptions, are being tested to optimise returns. Expanding intellectual property into music, merchandising, and cloud‑gaming subscriptions further unlocks value from dormant franchises.
- Global games spending reached a record $199.4 billion in 2024, a 3.5% year-over-year increase, with projections stabilizing near $200 billion in 2025.
- The upcoming Nintendo Switch 2 is projected to generate $7–8 billion in upside and reach 103 million units sold by 2030.
- The delay of GTA VI is expected to reduce 2025 console spending by $2.7 billion, creating a strategic window for other publishers to capture holiday market share.
- Publishers are mitigating slower growth by prioritizing high-margin, low-cost strategies such as remasters and remakes, alongside diversifying platforms and hybrid monetization models.
- Emerging markets in the Middle East, Africa, and Southeast Asia, combined with untapped demographic cohorts like 16–24-year-old females and players aged 55+, represent the primary opportunities for future expansion.
+1
NintendoJan 2025

Report94 pages
PC & Console Gaming Report 2025
Global PC and console revenues are expected to grow modestly through 2027, with consoles driving the majority of expansion at an estimated +13 % CAGR while PC revenue rises only in single digits. 2024 saw a plateau for PCs, dominated by free‑to‑play and in‑game monetisation, whereas console sales are set to rebound from 2025 thanks to strong releases such as GTA VI and the launch of Nintendo Switch 2. Player growth remains incremental, with PC players increasing at +2.3 % annually and console players at +3.5 %, driven largely by established franchises rather than breakthrough innovation.
Playtime data confirm that 2024 experienced a 6 % YoY increase, with Pay‑to‑Play titles (e.g., Call of Duty) and free‑to‑play hits (Fortnite, Roblox) accounting for most of the lift. New releases captured only about 9 % of total playtime, underscoring that long‑running series dominate the market. Console audiences remain heavily slate‑dependent: 67 % of new‑release hours come from annual franchises, while PC players show a higher share of non‑annual titles. In the US and Western Europe, non‑annual franchise games contribute a smaller slice of console revenue (≈8–22 %) compared to annual franchises, which drive the bulk of earnings.
Engagement patterns reveal a sharp decline in title diversity on PC and Xbox, with the average number of titles played per player falling 27 % on Steam in the US and up to 34 % in Russia and Brazil. PlayStation, by contrast, shows modest growth in title engagement. Genre preferences are shifting away from Battle Royale toward Adventure and Role‑Playing, reflecting a broader industry trend toward narrative‑rich, long‑form gameplay. Nostalgia and free‑to‑play models continue to sustain short‑term spikes, but long‑term retention hinges on continuous content updates and robust live‑service strategies. New IPs must prioritize originality, polished gameplay loops, and community‑first discovery to overcome the legacy brand advantage and achieve lasting commercial success.
- Console revenue is projected to grow at a 13% CAGR through 2027, significantly outpacing single-digit growth for PC, with major catalysts including the release of GTA VI and the Nintendo Switch 2.
- Market dominance is heavily concentrated in established franchises, as new releases captured only 9% of total playtime in 2024, with annual franchises accounting for 67% of new-release hours on consoles.
- Title diversity is shrinking, evidenced by a 27% decline in the average number of titles played per user on Steam in the US, with drops as high as 34% in markets like Russia and Brazil.
- Player growth remains incremental, with annual increases of 3.5% for console and 2.3% for PC, driven primarily by legacy brands rather than breakthrough innovation.
- Genre preferences are shifting away from Battle Royale toward Adventure and Role-Playing titles, signaling a market trend toward narrative-rich, long-form gameplay.
+1
NewzooJan 2025

Report67 pages
Global Games Market Report 2025
The Global Games Market Report 2025 projects a steady expansion of the worldwide player base to 3.6 billion, with payers rising to 1.6 billion and total revenue reaching $188.8 billion, a 3.4 % increase year‑over‑year. Mobile dominates growth and revenue, contributing $103 billion (55 % of the market) and expanding 4.5 % YoY, while PC and console follow at 3.1 % and 2.5 %. The report notes that average spend per payer is expected to decline slightly through 2028 as the market matures, underscoring the importance of retention, innovative monetization and post‑launch content to sustain growth in an increasingly saturated ecosystem.
Geographically, the Asia‑Pacific region leads with a 4.2 % YoY increase, and North America remains strong for console sales (5.4 %). Key growth drivers include the launch of Nintendo Switch 2, continued success of live‑service titles on PC, and a shift toward direct‑to‑consumer monetization in mobile. Discoverability challenges and content fragmentation are identified as notable hurdles across all platforms.
Single‑player AAA titles released in the February–May window outperform those launched August–November by an average of 34 %, largely due to crowded holiday windows and cannibalization. Early Access titles that transition to full release within 4–9 months generate the highest new‑player lift, while staggered cross‑platform releases capture only about 13 % of the total player base. Player attrition drops sharply in weeks 2–5 and stabilizes after week 12, indicating that longer main‑story content (20–40 hours) and simulation elements help retain players over the long term.
The commercial life of single‑player titles is increasingly driven by post‑launch content, strategic discounting and community engagement rather than initial premium spend. DLC revenue shares evolve over a game’s lifecycle, with genres aligning to specific monetization models and subscriptions gaining influence on long‑term engagement. Post‑launch content is identified as the key determinant of discoverability, retention and profitability across a game’s back catalogue.
Methodologically, the report employs a top‑down, data‑driven model that blends proprietary engagement metrics (Game Performance Monitor, Steam data), public economic indicators and partner insights to forecast platform‑specific player, payer and revenue figures through 2028. The approach excludes taxes, hardware and gambling from revenue calculations and provides detailed platform‑by‑platform forecasts (PC, console, mobile, cloud, VR) alongside analytical tools for market segmentation, genre trends and post‑launch monetization strategies.
- The global games market is projected to reach $188.8 billion in 2025, a 3.4% year-over-year increase, with mobile platforms accounting for 55% of total revenue at $103 billion.
- Mobile gaming remains the primary growth engine with a 4.5% year-over-year expansion, while PC and console segments grow at 3.1% and 2.5% respectively.
- Single-player AAA titles launched between February and May outperform those released in the August–November holiday window by an average of 34% due to reduced market cannibalization.
- Player retention is optimized by 20–40 hour main-story content and simulation elements, with attrition rates stabilizing significantly after the 12-week mark.
- Early Access titles achieve the highest new-player lift when transitioning to a full release within a 4–9 month window.
NewzooJan 2025

Report39 pages
State of the Game Industry
The survey of more than 3,000 global developers in 2025 reveals a gaming industry grappling with persistent instability while making modest progress on diversity. Layoffs have risen, with one‑tenth of respondents reporting job losses in the past year and 58 % worried about future cuts. Women and non‑binary developers now account for 32 % of the workforce, up from 29 % in 2024, and LGBTQ+ representation reached 24 %, yet white males still dominate at 66 %. Revenue pressures and market shifts continue to drive restructuring, underscoring the sector’s vulnerability.
Generative AI has transitioned from a niche experiment to an integral part of many studios, with 36 % of developers using it personally and 52 % reporting company‑wide adoption. However, enthusiasm has cooled: only nine percent of companies plan to expand AI use, and negative perceptions have climbed to 30 % from 21 %. Ethical concerns, intellectual‑property risks, and fears of job displacement now affect more than half of respondents. Internal AI policies have expanded to 64 % of studios, and optional use has become more common, though a small minority mandate AI tools.
Live‑service development remains polarised. While 42 % of studios already produce live titles, only 13 % intend to launch one next year. AAA developers are more inclined (33 %) due to potential financial upside and sustained player engagement, yet worries about market saturation, creative fatigue, predatory monetization, and burnout persist. Media adaptations interest 36 % of AAA studios, whereas internal pitch activity has fallen. Self‑funding remains the dominant financing method (56 %), though success rates vary across funding models.
Work‑hour patterns signal growing strain: the share of developers working over 50 hours a week has risen from 8 % to 13 %, and half of respondents now view excess hours as problematic. Union support remains robust at 69 %, with 58 % advocating industry unionisation, yet only 22 % have discussed it in the past year. These findings illustrate a sector negotiating between rapid technological change, creative ambition, and labour‑market pressures across diverse geographic regions and studio sizes.
- Job instability is widespread, with 10% of developers experiencing layoffs in the past year and 58% expressing concern over future job security.
- Generative AI adoption is high, with 52% of studios using it company-wide, yet negative sentiment has risen to 30% due to ethical, IP, and displacement concerns.
- Work-life balance is deteriorating, as the proportion of developers working over 50 hours per week increased from 8% to 13%, with half of the workforce viewing these hours as problematic.
- Live-service development is cooling, with only 13% of studios planning to launch a new live title next year despite 42% currently maintaining existing ones.
- Workforce diversity is showing modest gains, with women and non-binary developers rising to 32% of the industry and LGBTQ+ representation reaching 24%.
+1
GDCJan 2025