Skip to main content
Game Industry
Library
Library
Search
Ask AI
News
Connect your AI
Browse
The Catch Up
Topics
Collections
Writers
Help
Subscribe
Game Industry
Library
Library
Search
Ask AI
Saved
Library
1,251 reports matching your filters
All Types
Reports
Articles
Presentations
Whitepapers
Financial
Legal
Other
Search
Market Analysis
Global
Mobile
Monetization
Investment
PC
Game Publishing
Marketing
Player Behavior
Console
Steam
Game Development
User Acquisition
Player Demographics
Employment
Europe
Mergers & Acquisitions
Japan
Clear
Filters
1
Market Analysis
Recently added
Newest first
Oldest first
Title A–Z
Title Z–A
Report
2 pages
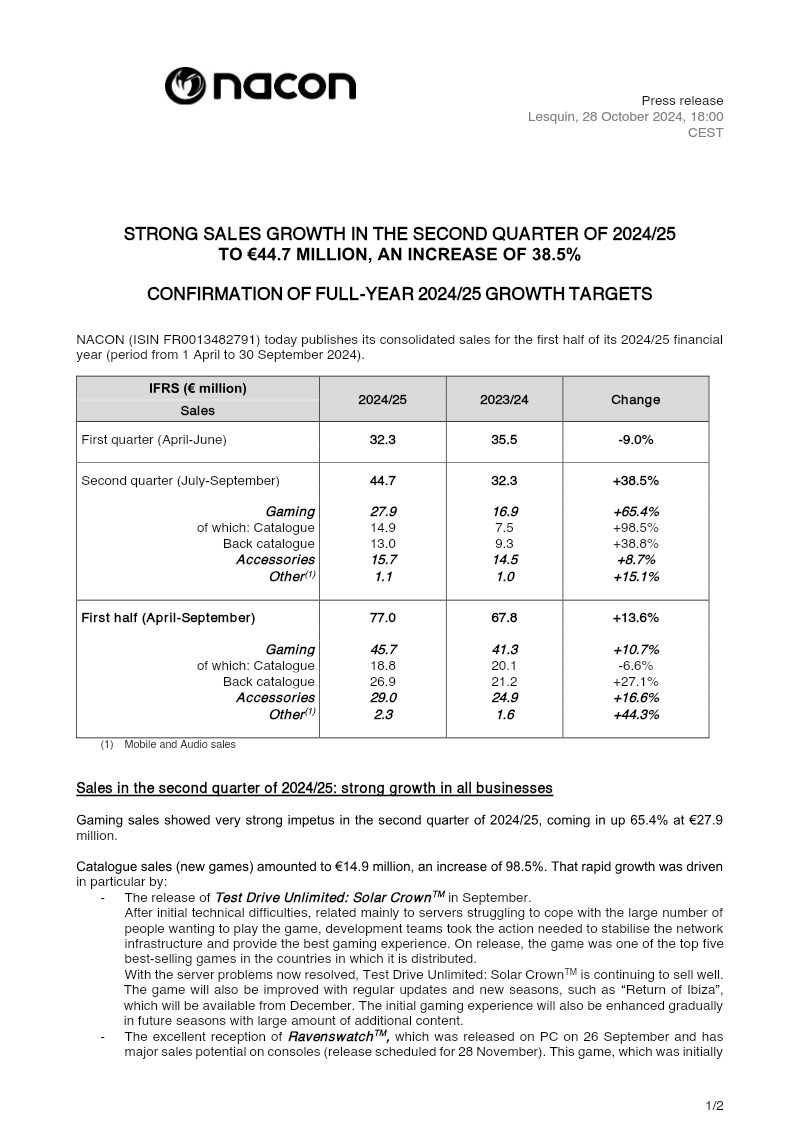
Strong Sales Growth in the Second Quarter of 2024/25: Nacon
Nacon reported a 38.5% surge in second-quarter sales to €44.7 million, bringing total first-half fiscal year sales to €77.0 million, a 13.6% increase.
Gaming revenue grew by 65.4% to €27.9 million, driven by a 98.5% increase in catalogue sales following the launches of Test Drive Unlimited: Solar Crown and Ravenswatch.
Back-catalogue performance remained strong, growing 38.8% to €13.0 million, supported by the continued success of titles like Robocop: Rogue City and Taxi Life.
Market Analysis
Game Publishing
Console
+2
Nacon
Report
2 pages
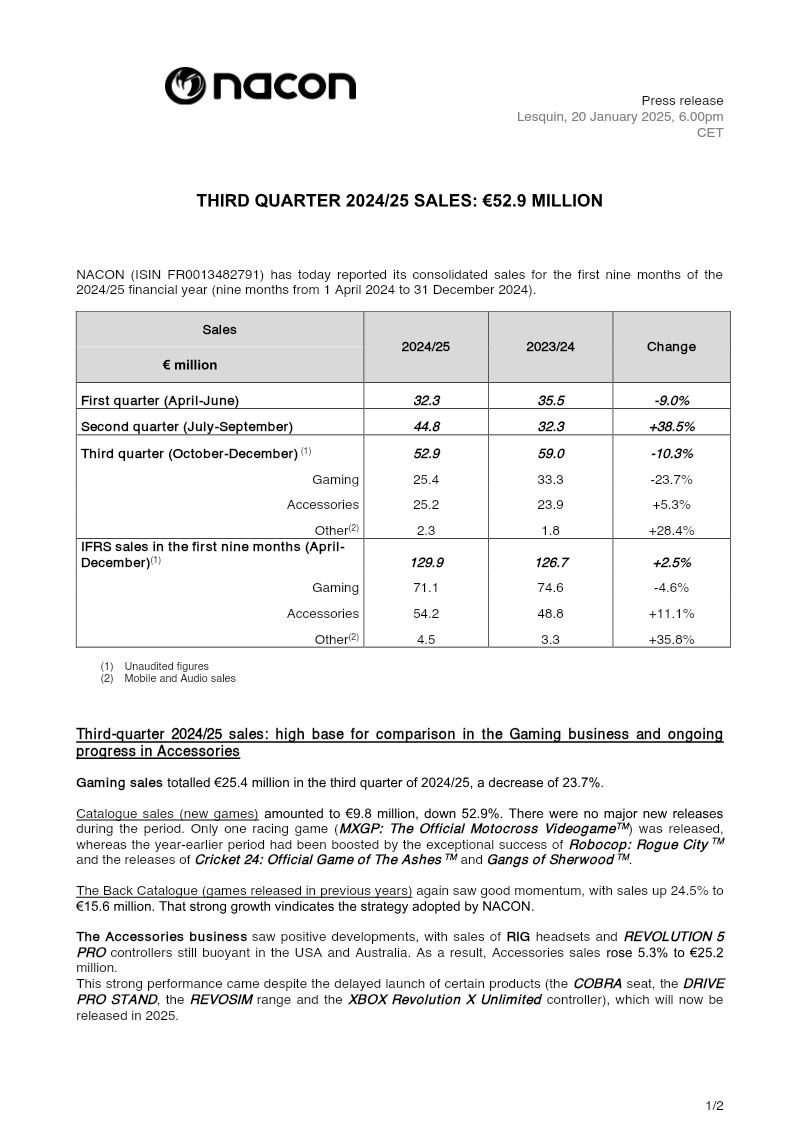
Third Quarter 2024/25 Sales
NACON’s Q3 2024/25 consolidated sales fell 10.3% year-over-year to €52.9 million, primarily driven by a 23.7% decline in gaming revenue.
Gaming revenue was negatively impacted by a 52.9% drop in new-catalogue sales, as the company released only one new title, MXGP: The Official Motocross Videogame™.
Back-catalogue gaming sales provided a partial offset, rebounding by 24.5% to reach €15.6 million.
Market Analysis
Game Publishing
Console
+2
Nacon
Report
2 pages
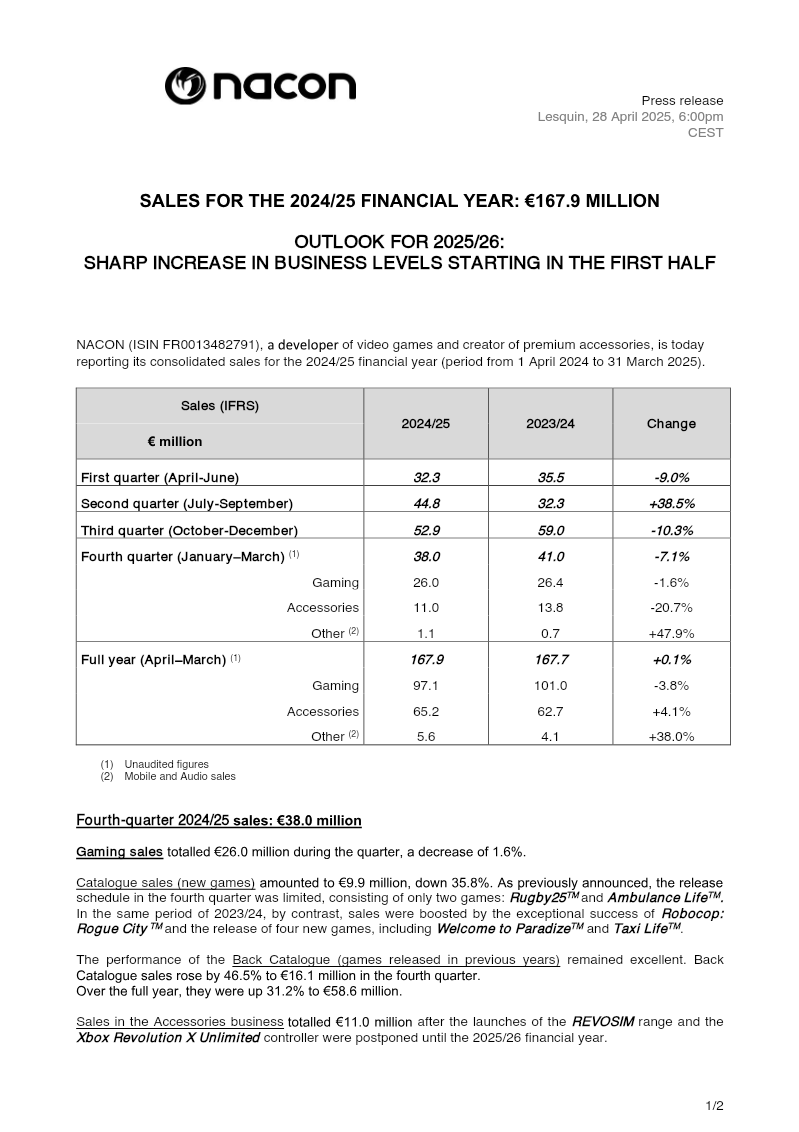
Sales for the 2024/25 Financial Year: Nacon
Nacon’s 2024/25 consolidated sales remained stagnant at €167.9 million, showing negligible growth compared to the previous year's €167.7 million.
Gaming revenue declined 3.8% to €97.1 million, driven by a 35.8% drop in new-game catalogue sales due to a limited release schedule of only two titles in the fourth quarter.
Back-catalogue performance served as a key stabilizer, with sales surging 31.2% for the full year and 46.5% in the fourth quarter alone.
Market Analysis
Console
France
+1
Nacon
Report
2 pages
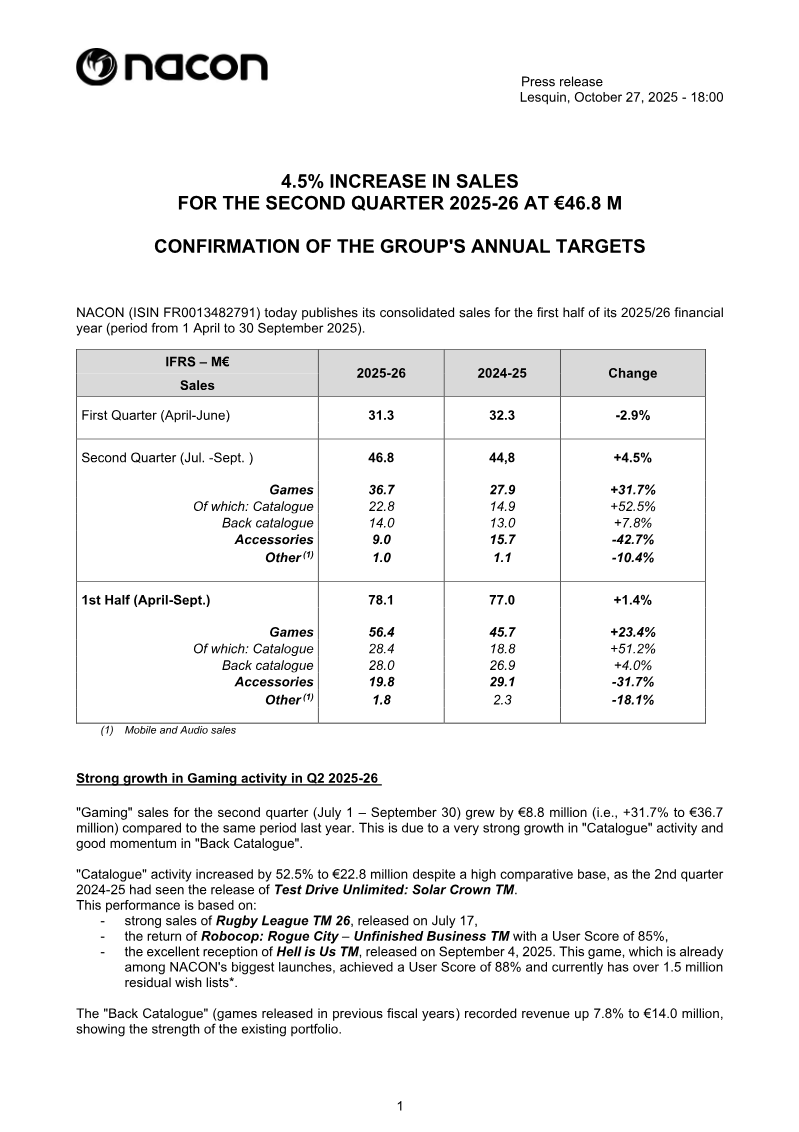
Consolidated Sales: Second Quarter 2025-26
NACON reported a 4.5% increase in Q2 2025/26 sales to €46.8 million, bringing total first-half revenue to €78.1 million, a 1.4% year-over-year growth.
Gaming segment revenue surged 31.7% to €36.7 million, fueled by a 52.5% increase in catalogue title sales and steady performance from the back-catalogue.
The accessories segment contracted by 42.7% to €9.0 million, primarily driven by a 66% decline in U.S. sales resulting from increased customs duties.
Market Analysis
Game Publishing
Investment
+2
Nacon
Report
2 pages
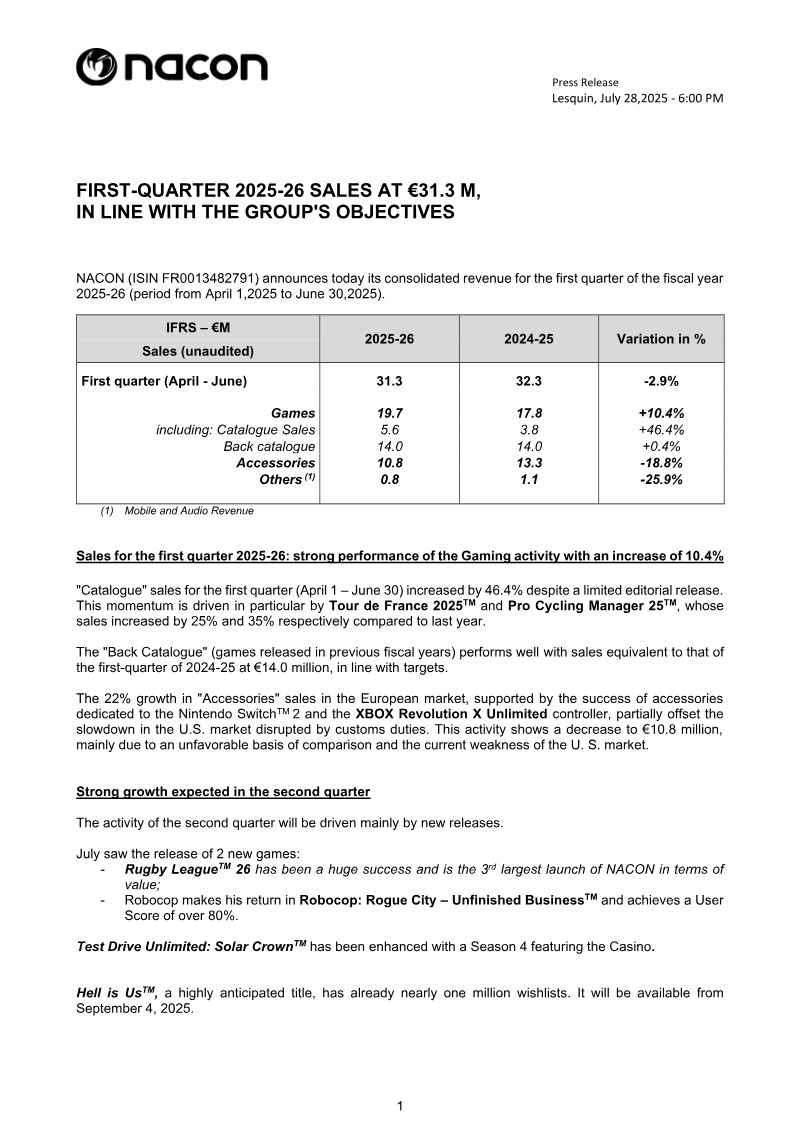
First-Quarter 2025-26 Sales: Nacon
Nacon reported Q1 2025-26 consolidated revenue of €31.3 million, representing a 2.9% decline compared to the same period last year.
Gaming segment revenue grew 10.4% to €19.7 million, bolstered by a 46.4% surge in catalogue sales driven by strong performances from 'Tour de France 2025' and 'Pro Cycling Manager 25'.
Accessories revenue fell 18.8% to €10.8 million, primarily due to a weaker U.S. market and unfavorable year-on-year comparisons.
Market Analysis
Game Publishing
France
+2
Nacon
Report
2 pages
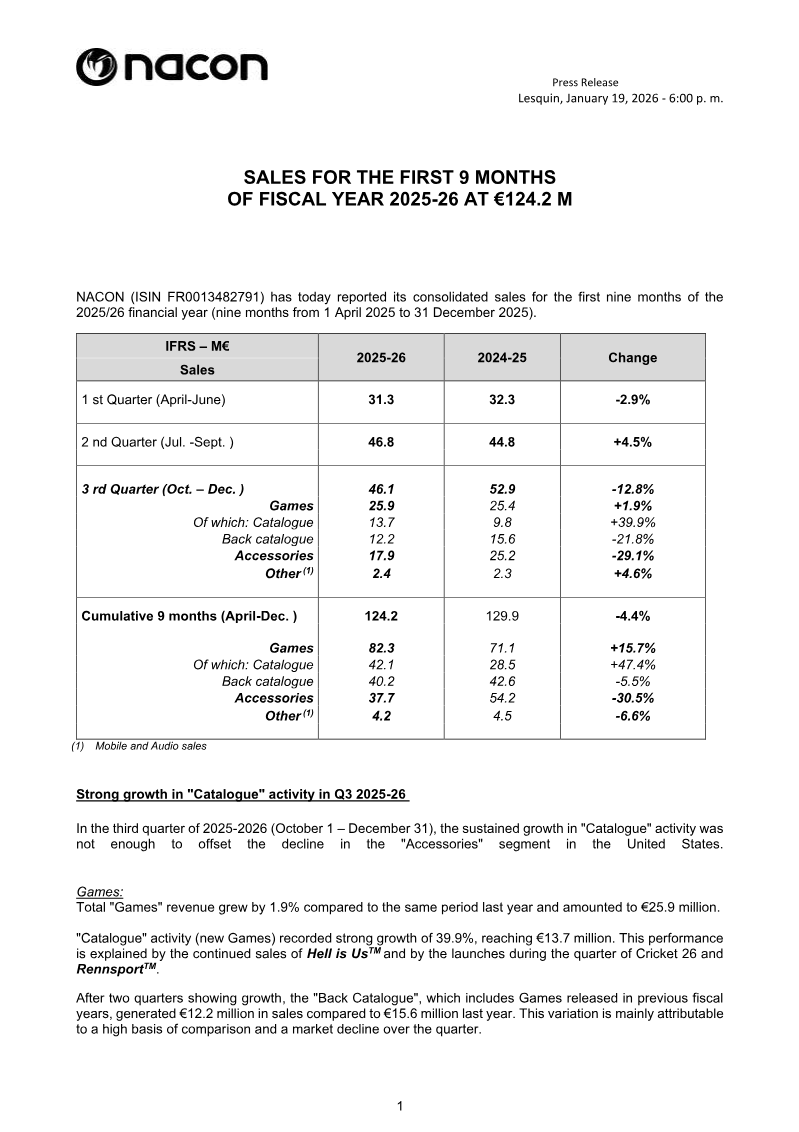
Sales for the First 9 Months of Fiscal Year 2025-26
NACON reported consolidated sales of €124.2 million for the first nine months of fiscal year 2025-26, representing a 4.4% decline compared to the same period last year.
Total game revenue grew 1.9% to €25.9 million, fueled by a 39.9% surge in new catalogue sales from titles like 'Hell is Us', 'Cricket 26', and 'Rennsport'.
Accessories revenue dropped 29.1% to €17.9 million, primarily due to ongoing impacts from customs duties in the United States market.
Market Analysis
Game Publishing
Investment
+2
Nacon
Report
106 pages
Annual Financial and Corporate Social Responsibility Report: 2020/21
The report covers the fiscal period ending 31 March 2021, encompassing both financial performance and corporate social responsibility metrics.
The document structure is divided into five primary sections, including the Management Board’s report (pages 13–34) and the Supervisory Board’s report (pages 35–43).
The Management Board’s report serves as a core component of the financial disclosure, spanning 22 pages of the total document.
Market Analysis
Investment
Global
Pullup Entertainment
Report
7 pages
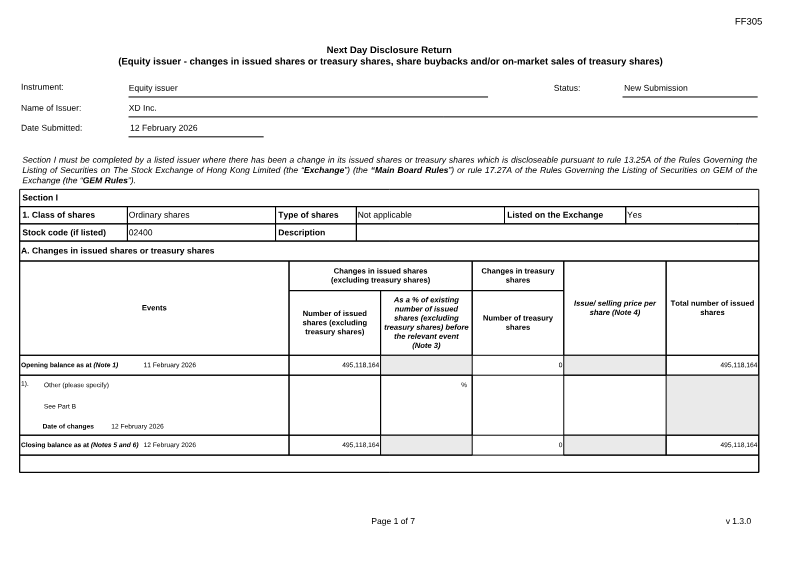
Next Day Disclosure Return: XD Inc.
XD Inc. (02400) repurchased 24,000 ordinary shares on 12 February 2026 at HKD 81.65 per share, totaling an outlay of HKD 1,923,420.
Between 13 and 28 January 2026, XD Inc. executed 21 separate repurchase events, acquiring approximately 400,000 shares in total.
All repurchased shares are designated for cancellation rather than treasury holding, resulting in a direct reduction of the company's issued share base.
Investment
China
Market Analysis
XD
Report
44 pages
Half-Year Report 2021: DONTNOD
DONTNOD reported its consolidated financial results for the six-month period ending June 30, 2021, while operating under the ongoing constraints of the COVID-19 pandemic.
The company is structured as a public limited company (Société Anonyme) with a registered share capital of €168,018.74.
The firm maintains its registered corporate headquarters at Parc du Pont de Flandre, 11 rue de Cambrai, 75019 Paris.
Market Analysis
Game Development
France
+1
Don't Nod
Report
15 pages
Q3 2022 Earnings Call: Stillfront Group AB
The provided report content contains only administrative header information and lacks the financial data, operational metrics, or strategic commentary necessary to extract specific insights regarding Stillfront Group AB's Q3 2022 performance.
No revenue figures, growth percentages, or specific business updates were present in the provided text to summarize.
The source material provided is incomplete and does not contain the body of the earnings call transcript required for analysis.
Market Analysis
Monetization
Live Ops
+2
Stillfront
Report
13 pages
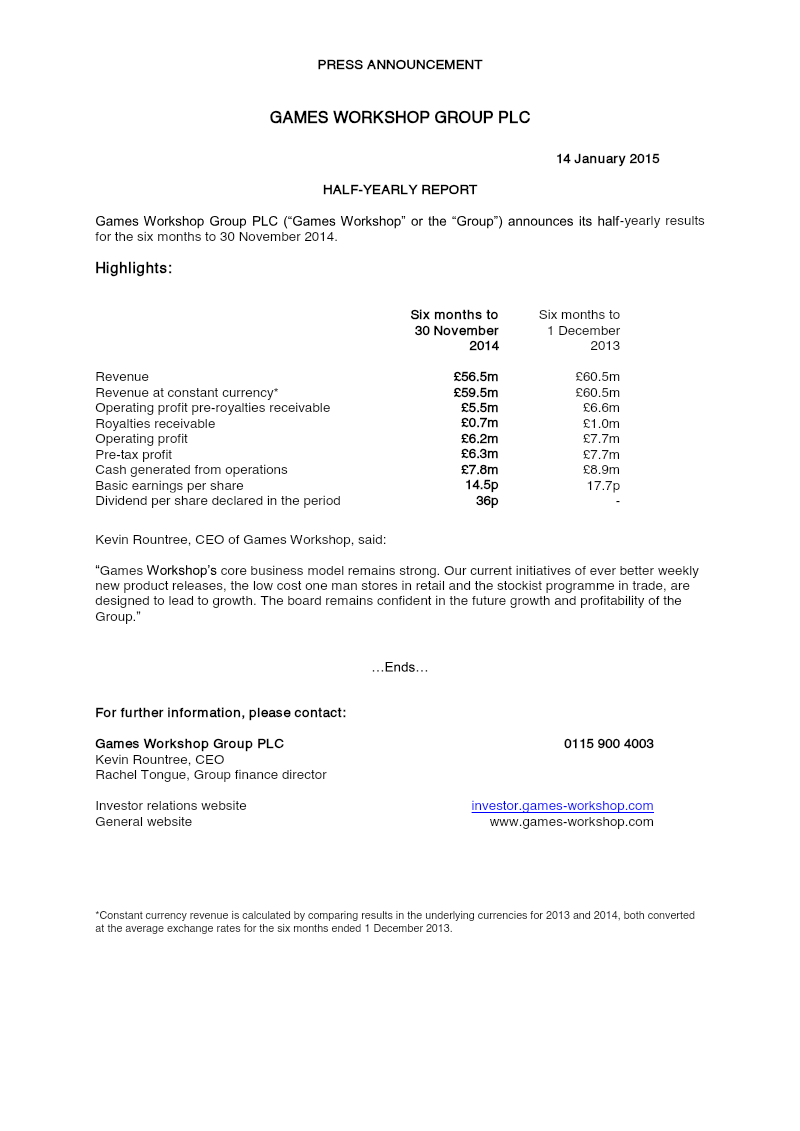
Half-Yearly Report: 2014
Games Workshop Group PLC reported revenue of £56.5 million for the six months ending 30 November 2014, down from £60.5 million in the same period the previous year.
Revenue adjusted for constant currency was £59.5 million, indicating a decline when compared to the £60.5 million recorded in the prior year's comparable period.
Operating profit before royalties receivable fell to £5.5 million, compared to £6.6 million for the six months ending 30 November 2013.
Market Analysis
Investment
UK
+1
Games Workshop Group
Report
14 pages
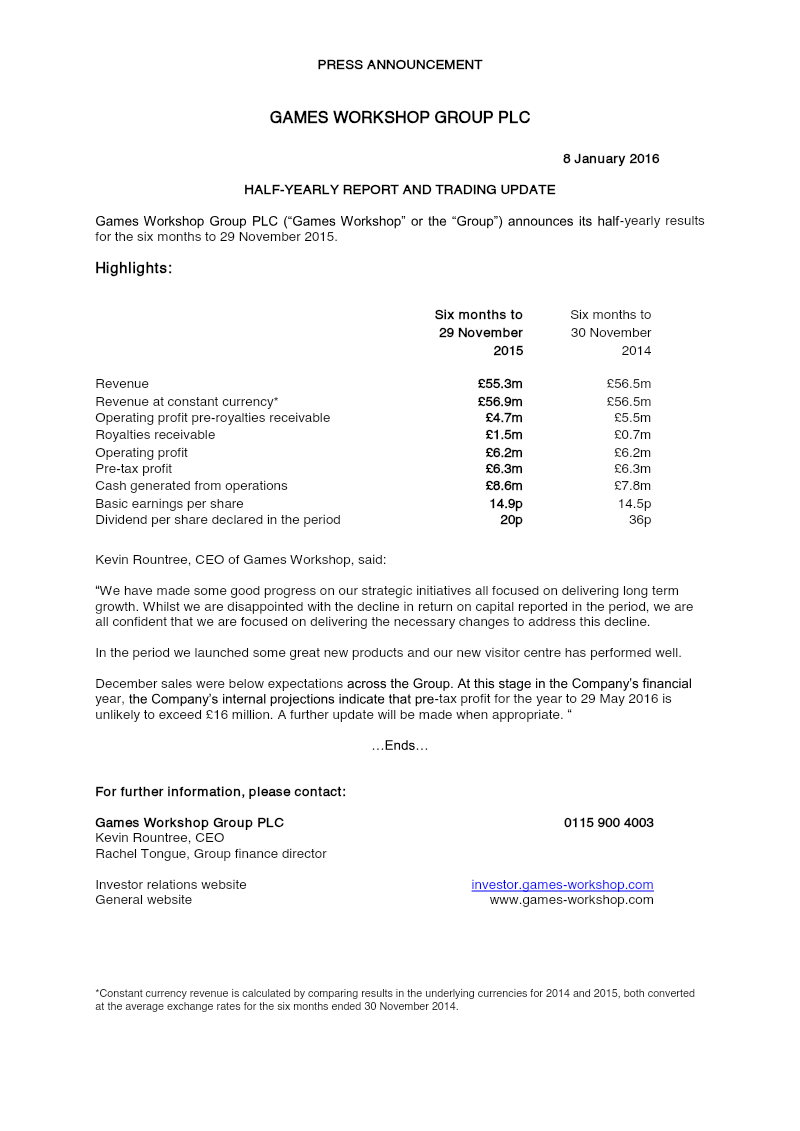
Half-Yearly Report and Trading Update: 2015-2016
Games Workshop reported revenue of £55.3 million for the six-month period ending 29 November 2015, a slight decrease from the £56.5 million recorded in the same period of 2014.
When adjusted for constant currency, revenue for the six months to 29 November 2015 reached £56.9 million, representing a slight growth compared to the £56.5 million reported in the prior-year period.
Market Analysis
Tabletop
UK
+1
Games Workshop Group
Report
15 pages
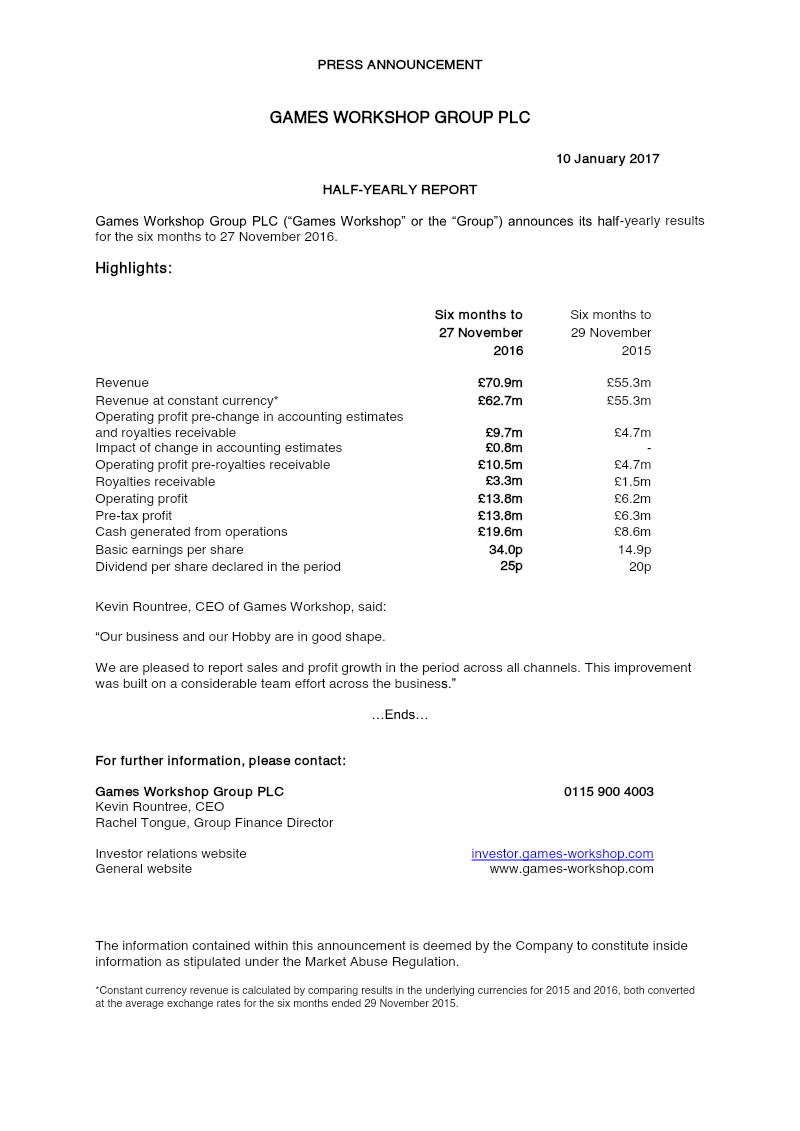
Half-Yearly Report: 2016-2017
Games Workshop reported revenue of £70.9m for the six months ending 27 November 2016, representing a significant increase from the £55.3m recorded in the same period of the previous year.
Revenue growth was £15.6m year-over-year, with constant currency revenue reaching £62.7m, indicating strong underlying performance beyond currency fluctuations.
Operating profit before changes in accounting estimates and royalties receivable more than doubled to £9.7m, up from £4.7m in the prior-year period.
Market Analysis
Investment
Tabletop
+2
Games Workshop Group
Report
16 pages
Half-Yearly Report: 2017
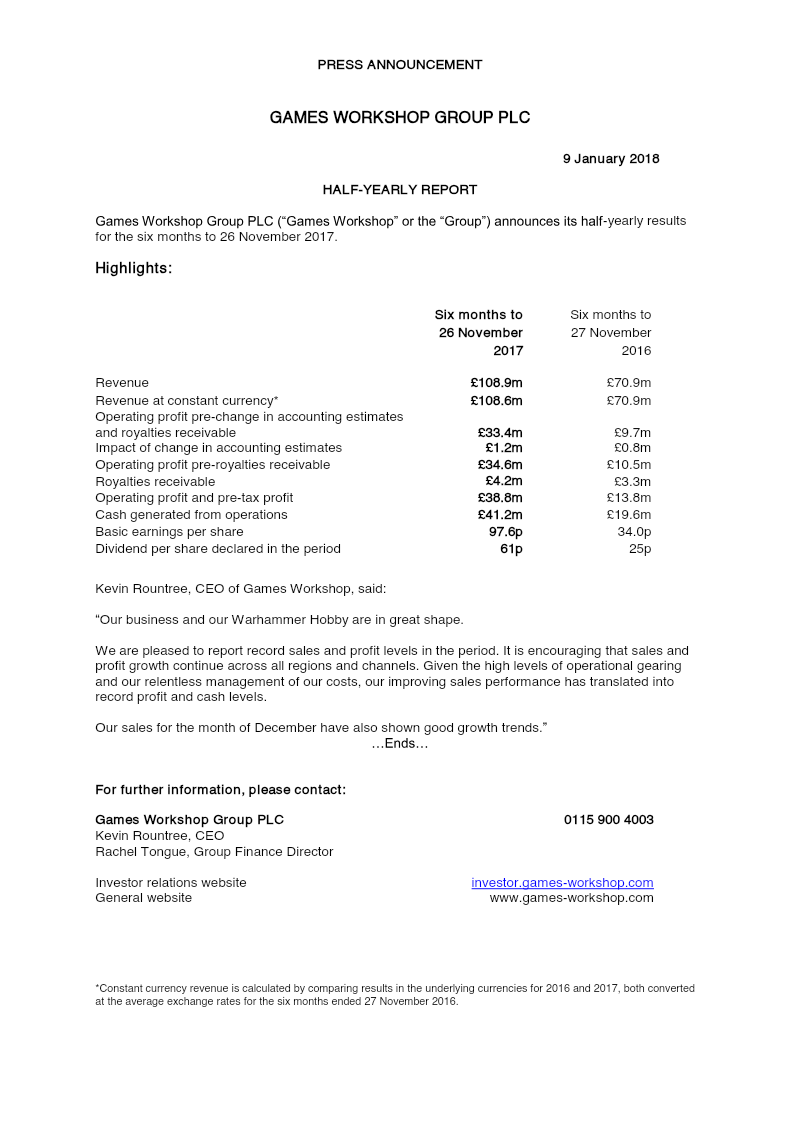
Games Workshop Group PLC reported a significant revenue increase to £108.9 million for the six months ending 26 November 2017, up from £70.9 million in the same period the previous year.
Operating profit before changes in accounting estimates and royalties receivable rose sharply to £33.4 million, compared to £9.7 million in the prior-year period.
Revenue growth remained strong even when adjusted for currency fluctuations, with constant currency revenue reaching £108.6 million.
Market Analysis
Investment
Tabletop
+2
Games Workshop Group
Report
15 pages
Half-Yearly Report: 2018-2019
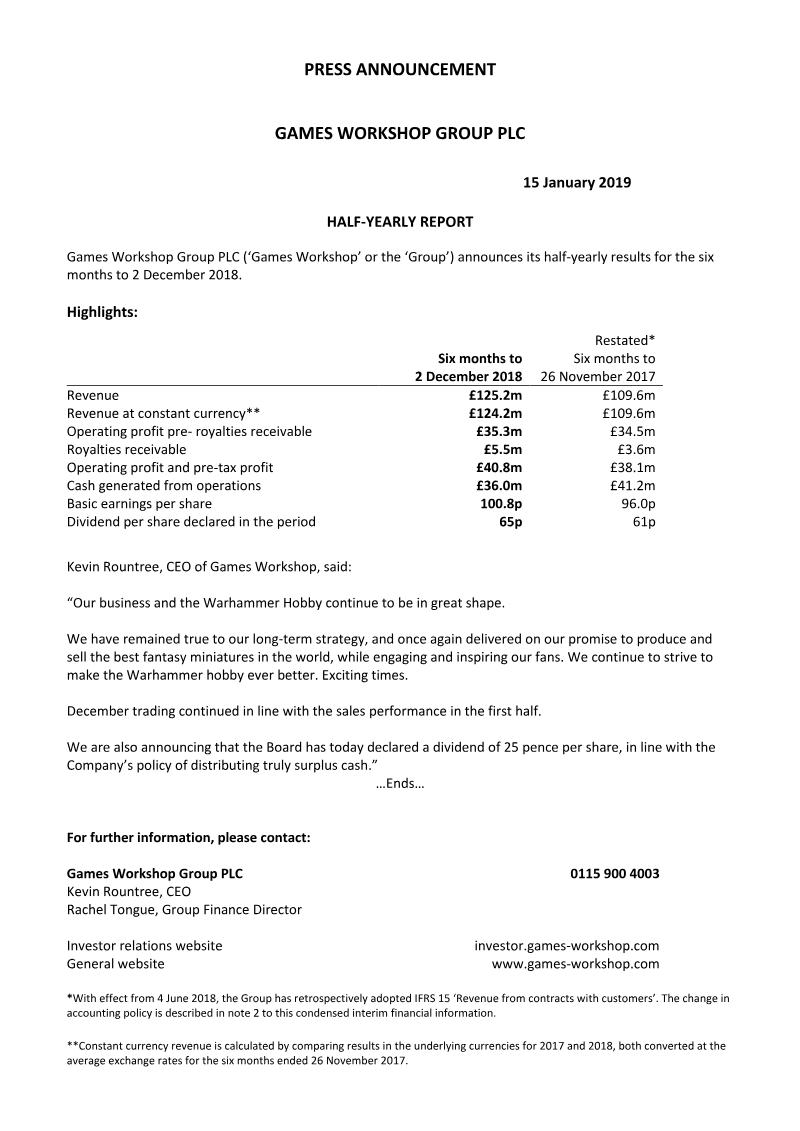
Games Workshop Group PLC reported revenue of £125.2 million for the six months ending December 2, 2018, compared to £109.6 million for the same period in 2017.
Revenue growth remained positive even when adjusted for currency fluctuations, with constant currency revenue reaching £124.2 million.
Operating profit before royalties receivable saw a modest increase to £35.3 million for the 2018 period, up from £34.5 million in the 2017 period.
Market Analysis
Investment
Tabletop
+1
Games Workshop Group
Report
78 pages
Annual Report 2019
Annual revenue grew to 256,574 from 221,304 in the previous period, representing a nominal increase of approximately 15.9%.
Operating profit rose to 81,199 from 74,319, reflecting a 9.3% increase in overall operational profitability.
Revenue at constant currency reached 255,295, indicating that currency fluctuations had a positive impact of 1,279 on the reported revenue figures.
Market Analysis
Monetization
Investment
+2
Games Workshop Group
Report
16 pages
Half-Yearly Report: Six Months to 1 December 2019
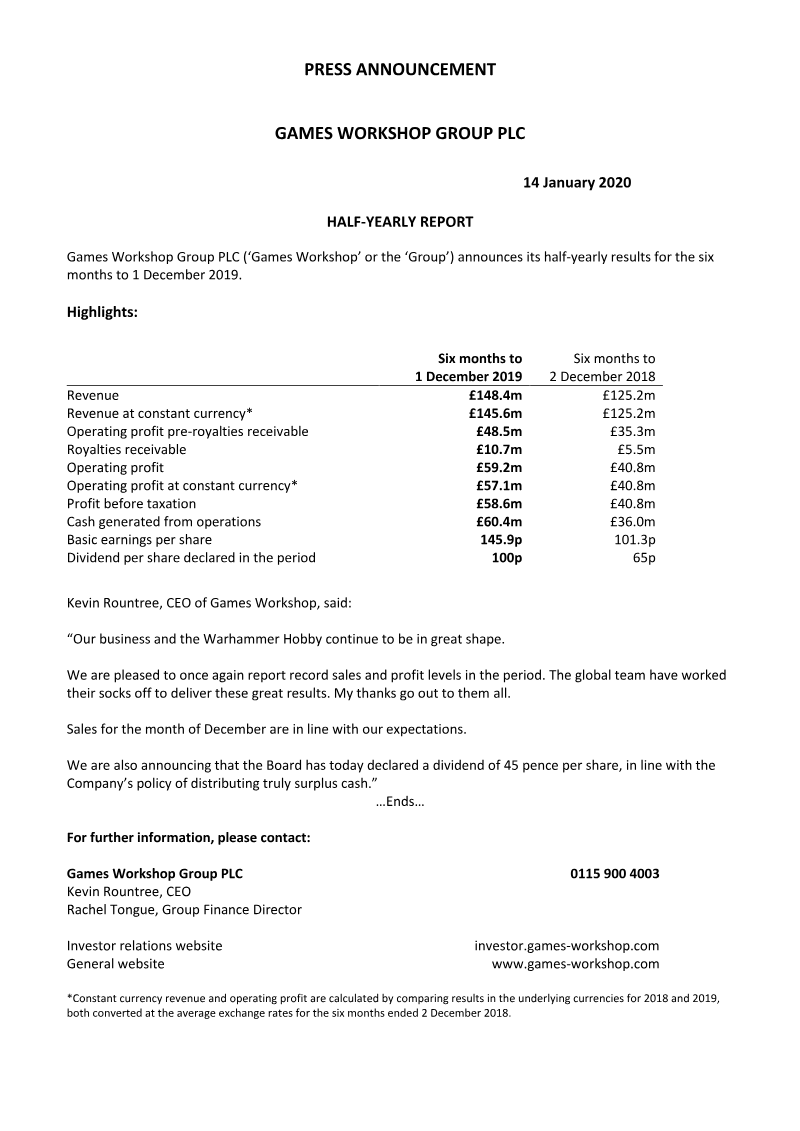
Games Workshop reported revenue of £148.4 million for the six months ending 1 December 2019, an increase from £125.2 million during the same period in 2018.
Revenue grew by approximately 18.5% year-over-year, or 16.3% when measured at constant currency.
Operating profit before royalties receivable rose significantly to £48.5 million, up from £35.3 million in the prior-year period.
Market Analysis
Investment
Global
+2
Games Workshop Group
Report
17 pages
Half-Yearly Report: 29 November 2020
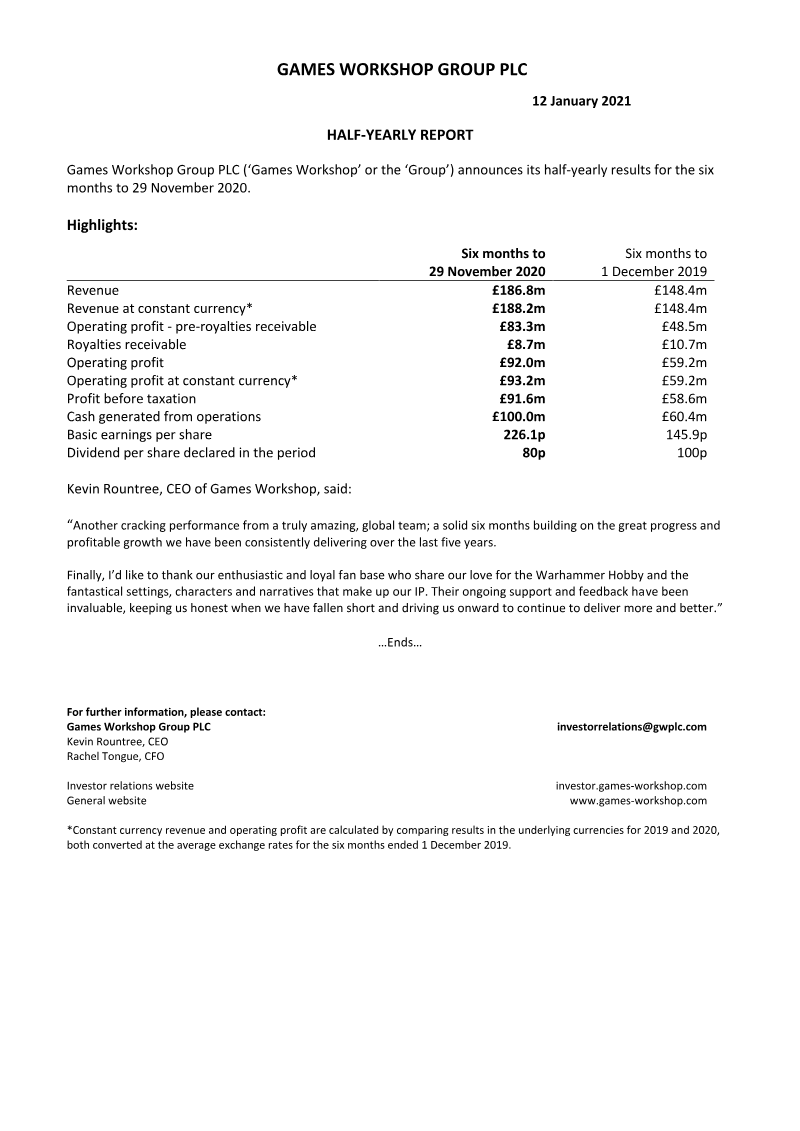
Games Workshop Group PLC reported revenue of £186.8 million for the six months ending 29 November 2020, an increase from £148.4 million during the same period in 2019.
Revenue growth remained strong even when adjusted for currency fluctuations, reaching £188.2 million at constant currency compared to £148.4 million in the prior year.
The company achieved an operating profit of £83.3 million before accounting for royalties receivable during the six-month period ending 29 November 2020.
Market Analysis
Investment
Global
+2
Games Workshop Group
Report
20 pages
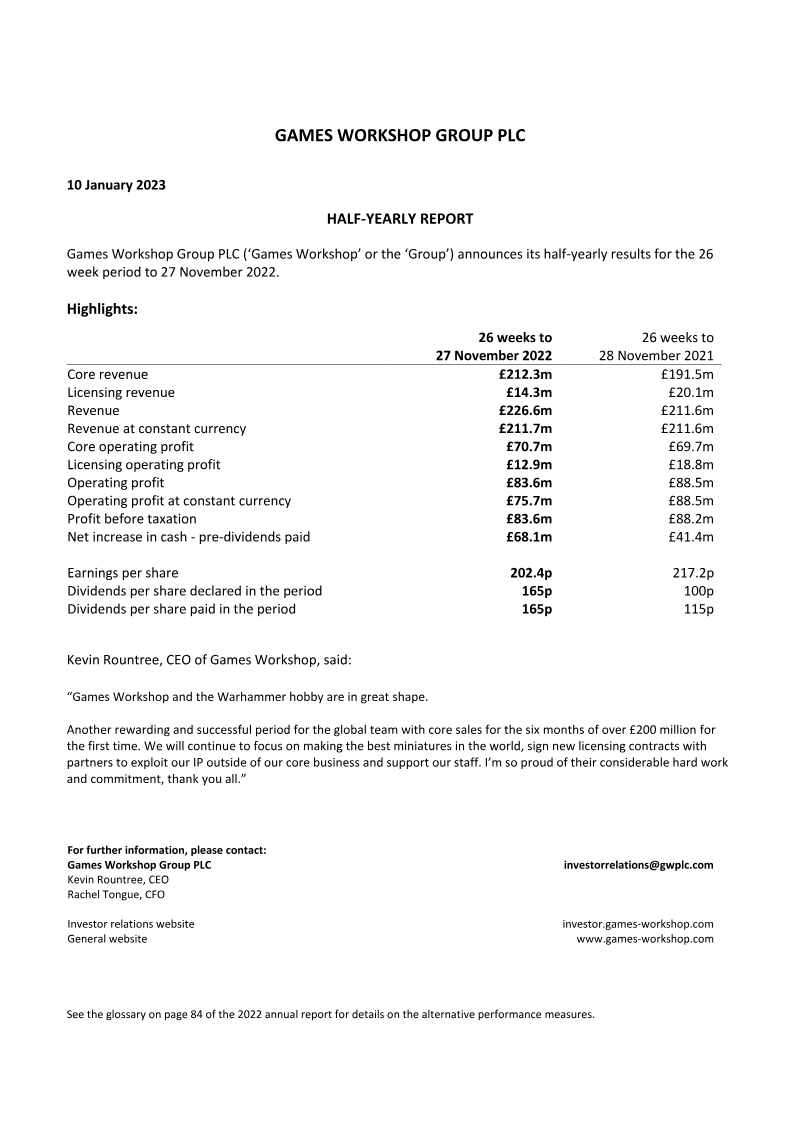
Half-Yearly Report: 2022-2023
Games Workshop Group PLC reported core revenue of £212.3 million for the 26-week period ending November 27, 2022, an increase from £191.5 million in the same period of 2021.
Licensing revenue declined to £14.3 million for the 26 weeks ending November 27, 2022, compared to £20.1 million during the equivalent period in 2021.
Market Analysis
Monetization
Investment
+1
Games Workshop Group
Report
20 pages
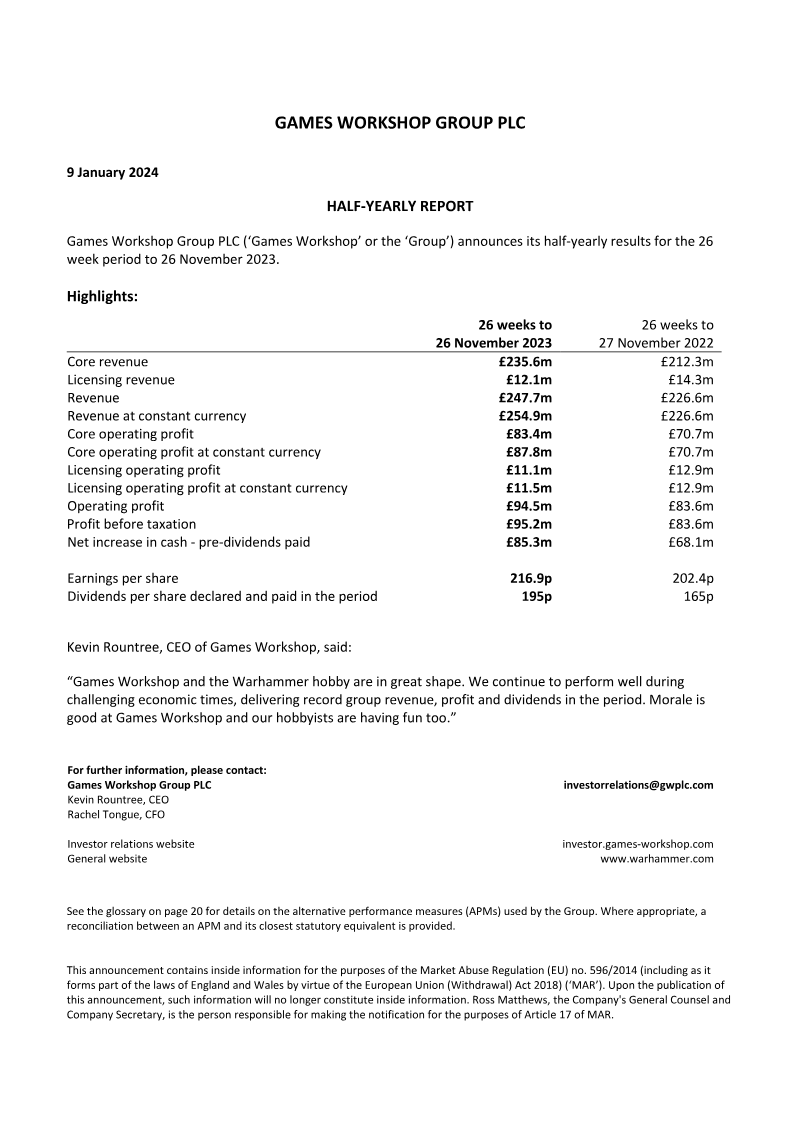
Half-Yearly Report: 26 Weeks to 26 November 2023
Games Workshop Group PLC reported total revenue growth for the 26-week period ending 26 November 2023 compared to the same period in 2022.
Core revenue increased to £235.6 million for the 26 weeks to 26 November 2023, up from £212.3 million during the equivalent period in 2022.
Licensing revenue declined to £12.1 million for the 26 weeks ending 26 November 2023, compared to £14.3 million in the prior year's period.
Market Analysis
Investment
Global
Games Workshop Group
Previous
1
…
13
14
15
…
63
Next