
Zen Match
GameBy Good Job Games · Released Aug 1, 2021
Documents about Zen Match
Report40 pages
2024 Casual Gaming Apps Report
Mobile gaming is emerging from its post-pandemic slump, with consumer spend rebounding and the casual segment reshaping itself.
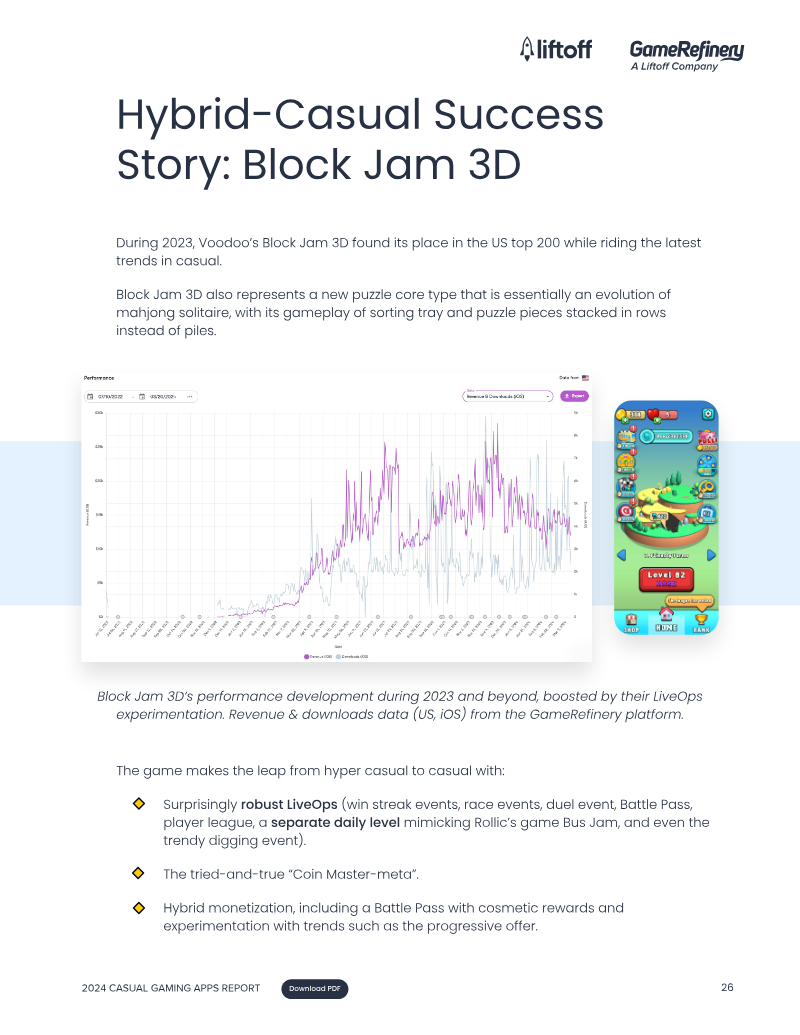
- The casual gaming market is shifting from hyper-casual titles toward hybrid-casual and 3D match models, with 3D Match category market share on US iOS increasing fivefold between April 2023 and April 2024.
- Developers are increasingly bypassing app store fees by adopting proprietary web stores and engagement-linked offers, a strategy now utilized by 70% of top-performing US casual games.
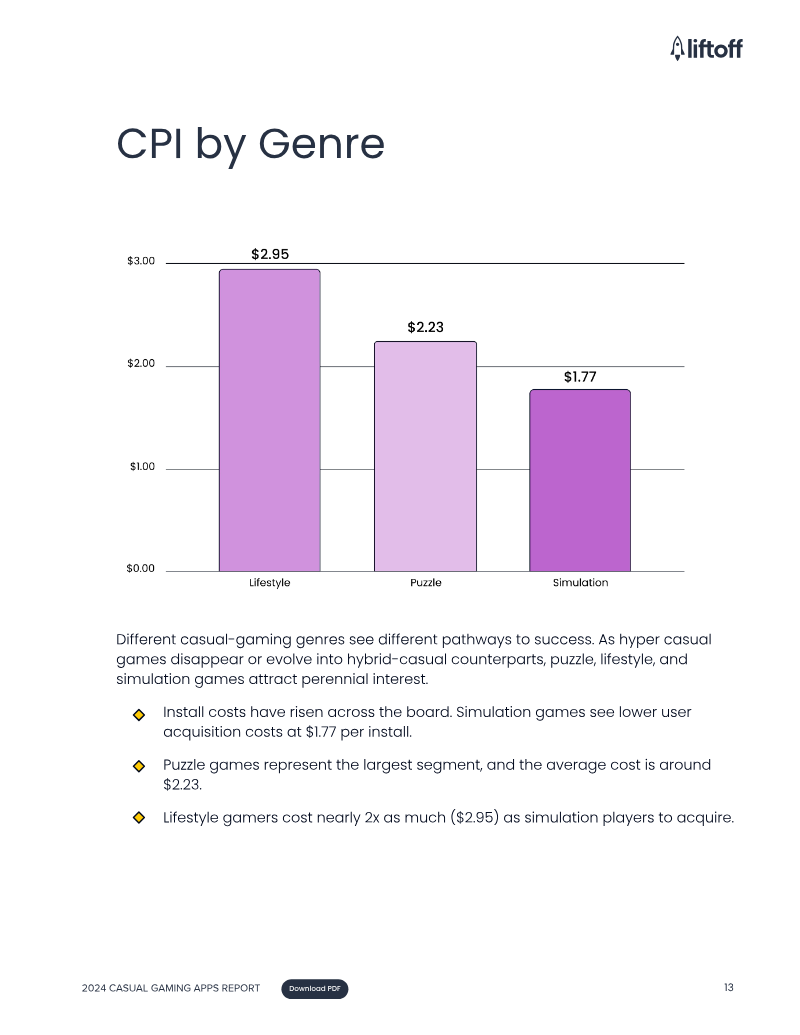
- User acquisition costs are highly bifurcated, with iOS installs averaging $4.83 compared to $0.65 on Android, though iOS maintains a superior Day 7 return on ad spend.
LiftoffApr 2024
Report31 pages
Motivations and Demographics Snapshot Report: The Motivations Driving Top Mobile Games, February 2022
Player motivation, rather than genre alone, explains who plays top mobile games and why they spend.
- Gender and age are primary indicators of genre preference, with women comprising 63% of the audience for Match3 and Hidden Object games, while men make up 76% to 84% of the audience in 4X strategy and synchronous PvP titles.
- Every top-grossing casual game released between 2020 and 2022 has integrated renovation and customization elements to increase player expression and broaden market appeal.
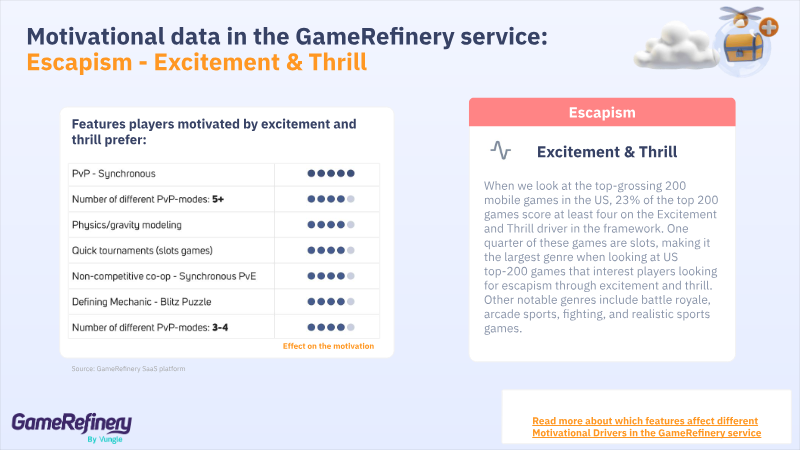
- Motivational drivers are demographic-specific; younger males prefer high-sensomotoric challenges like Battle Royales, while players aged 45 and older seek similar thrills through low-sensomotoric experiences like Slots.
GameRefineryFeb 2022


Report34 pages
Casual Gaming Apps Report 2022
Liftoff's 2022 Casual Gaming Apps Report benchmarks user acquisition and monetization performance across casual mobile games, drawing on data from 1 May 2021 to 1 May 2022, covering 76.1 billion impressions, 3.4 billion clicks, and 58.5 million installs.
- Mobile gaming maintains over 60% of the total industry market share despite experiencing its first year-over-year global spending decline in Q1 2022.
- Android is significantly more cost-effective for user acquisition than iOS, with an average CPI of $0.75 compared to $2.27, while both platforms deliver comparable Day 30 ROAS.
- Lifestyle games are the most lucrative segment for developers, yielding the highest returns despite carrying higher-than-average acquisition costs.
GameRefineryJan 2022
Companies behind it

As the documents state it.