The Game
Game
Documents about The Game
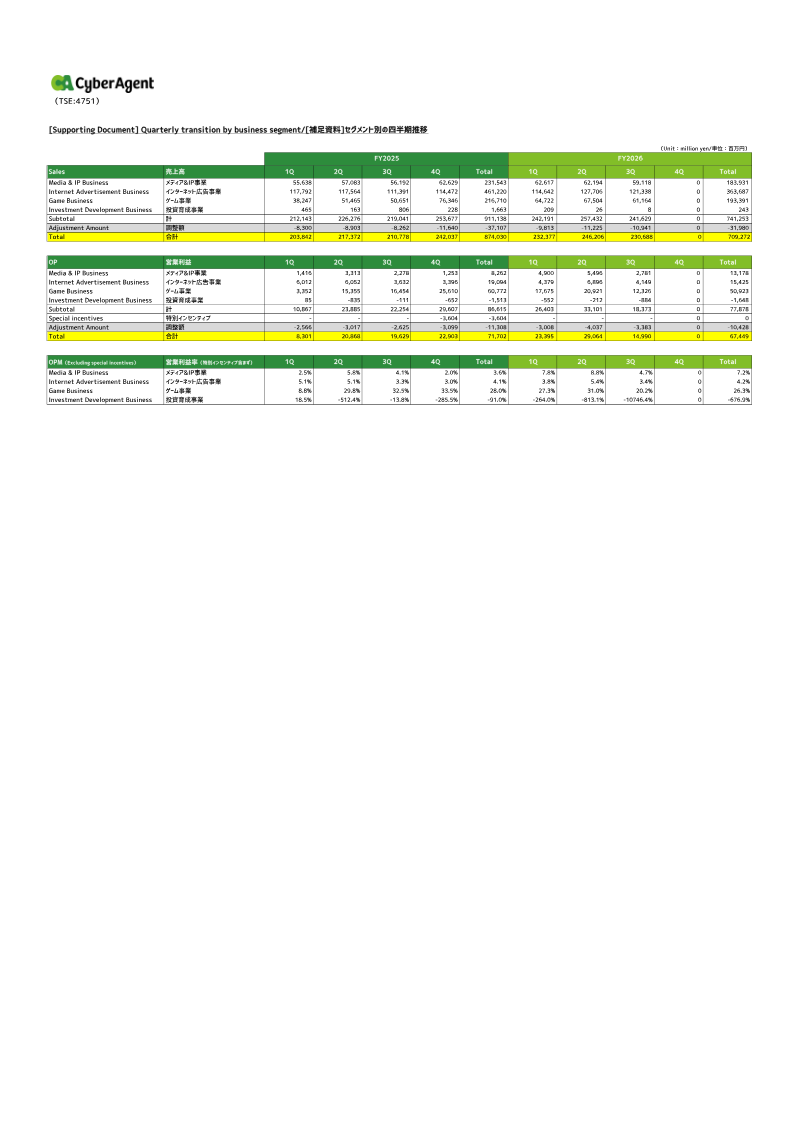
Quarterly Transition by Business Segment: FY2026 Third Quarter
CyberAgent’s financial performance for the third quarter of fiscal year 2026 reflects a period of contraction across its primary business segments compared to the preceding quarter.
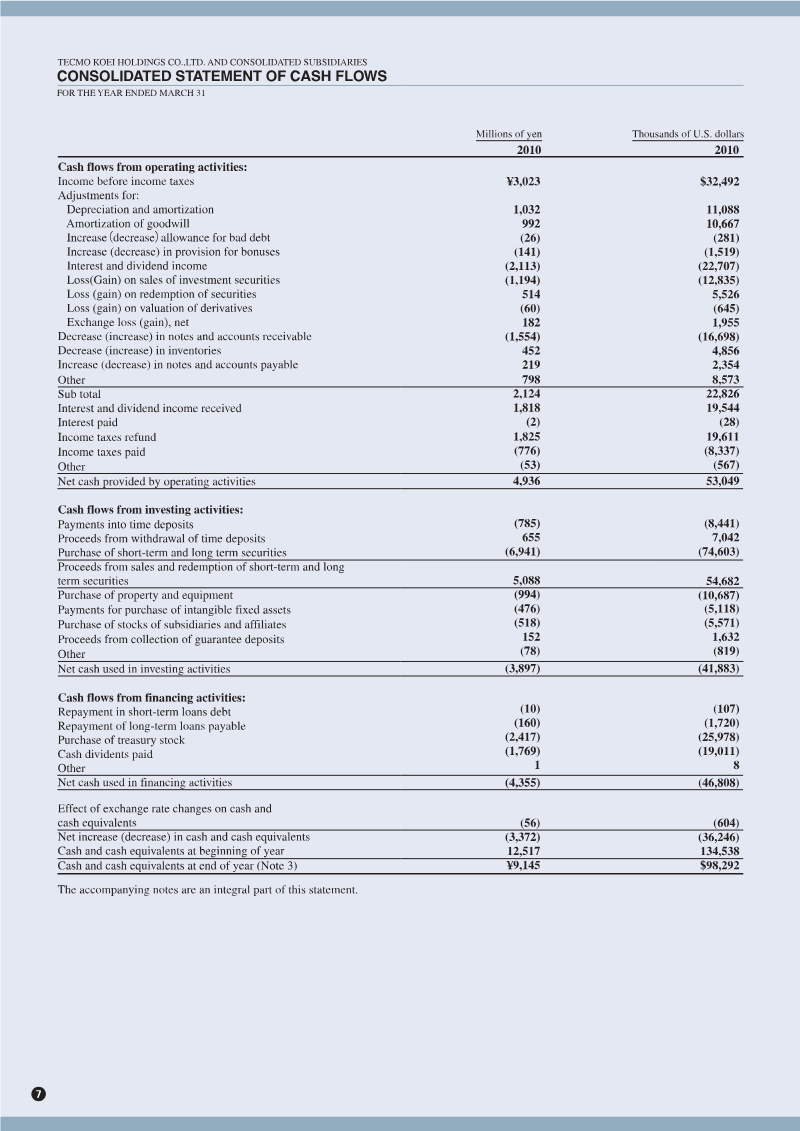
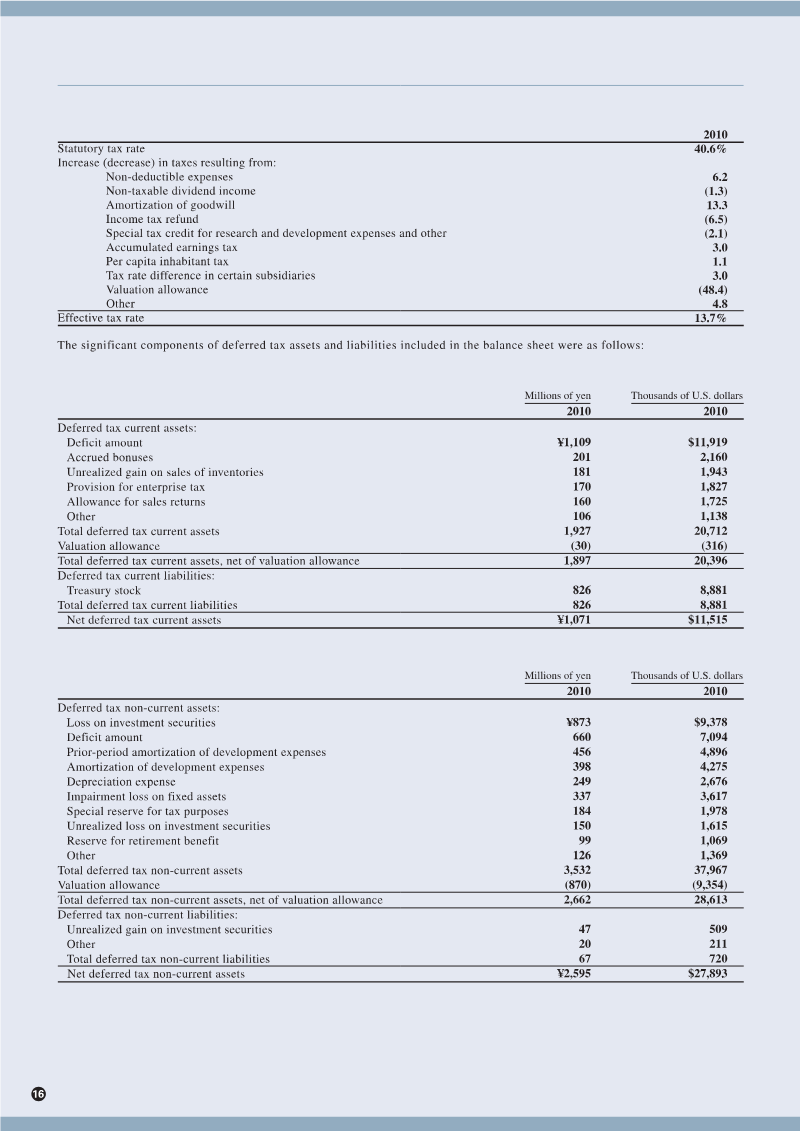

Tecmo Koei Holdings Annual Report 2010
Tecmo Koei Holdings navigated a transformative fiscal year ending March 31, 2010, following the strategic merger of Tecmo and Koei.
- Tecmo Koei Holdings reported net sales of 34.5 billion yen and a consolidated net income of 2.6 billion yen for the fiscal year ending March 31, 2010.
- The company completed a post-merger reorganization into three specialized business units: Tecmo Koei Games, Tecmo Koei Wave, and Tecmo Koei Net.
- The Game Software segment served as the primary revenue driver, supported by successful title launches in both Japanese and North American markets.
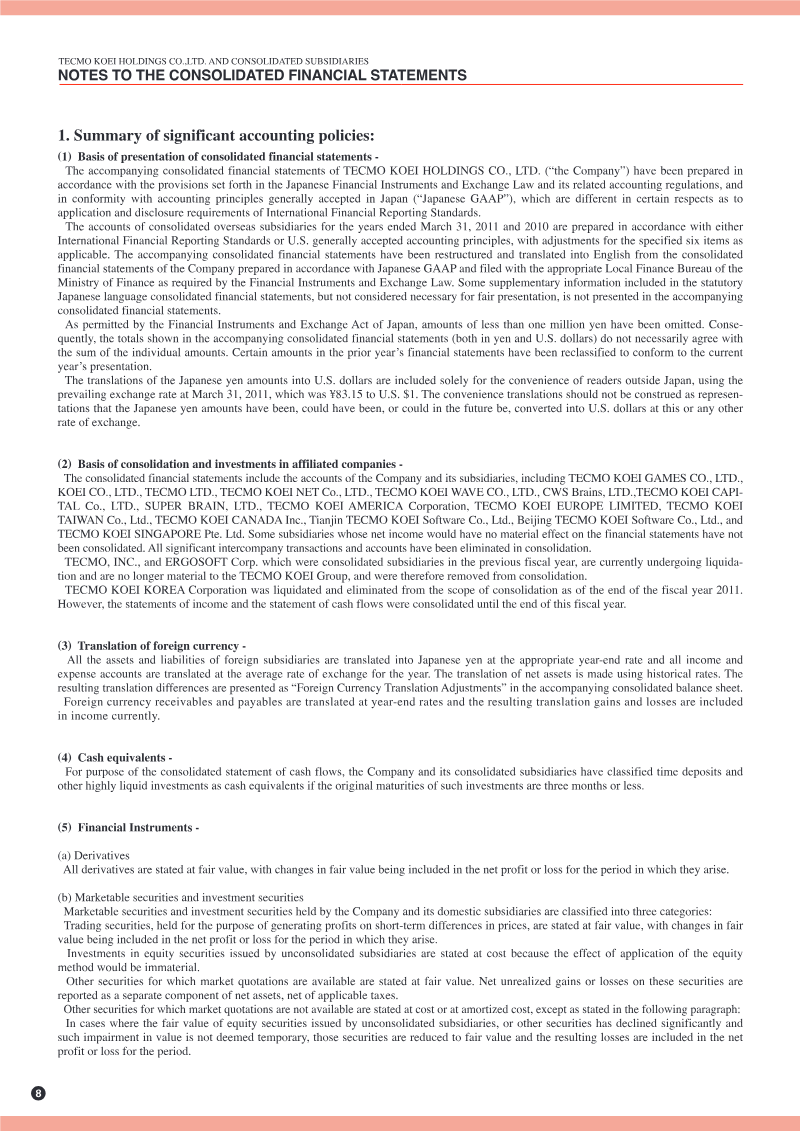

Tecmo Koei Holdings Annual Report 2011
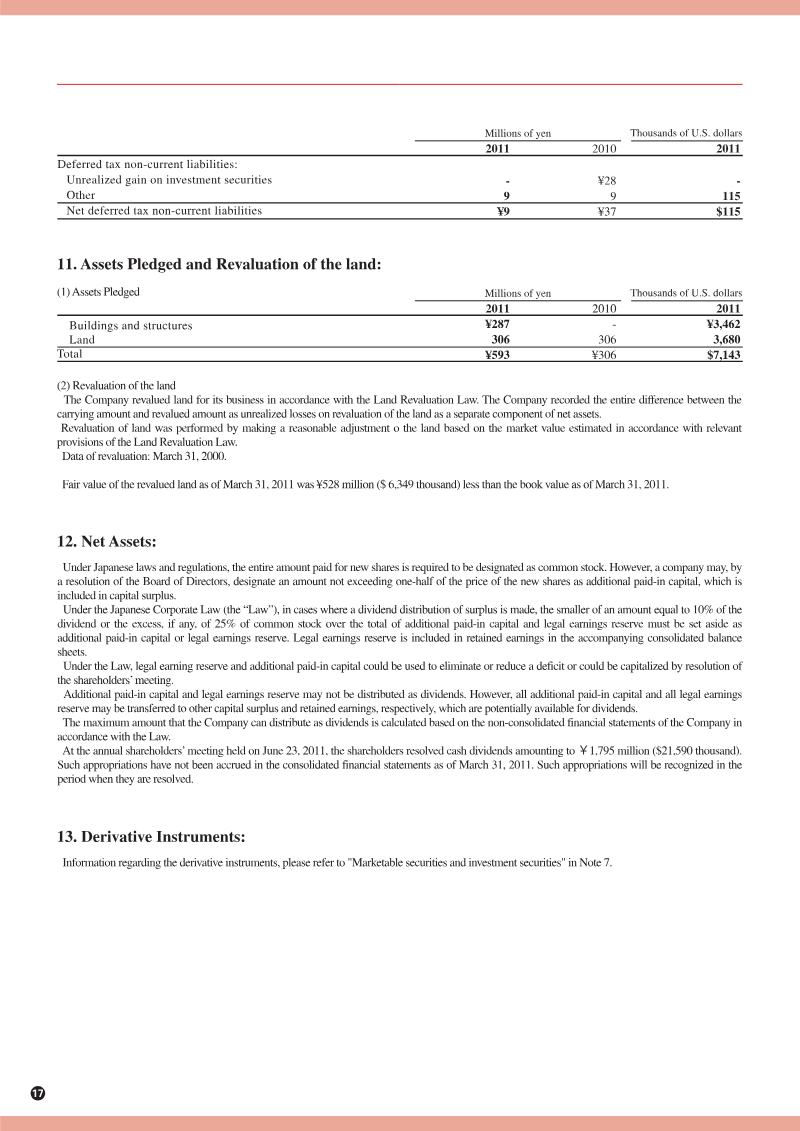
Tecmo Koei Holdings navigated a challenging fiscal year ending March 31, 2011, characterized by operational disruptions following the Great East Japan Earthquake.
- Tecmo Koei Holdings achieved a consolidated net income of 2.7 billion yen and total net sales of 385.8 million dollars for the fiscal year ending March 31, 2011.
- The company completed the integration of Koei Co., Ltd. and Tecmo, Ltd. into a single entity, Tecmo Koei Games Co., Ltd., to streamline operations.
- Operational performance was negatively impacted by release delays caused by the Great East Japan Earthquake, though the Game Software division remained the primary revenue driver.
DeNA Q2 FY2024 Operating Results
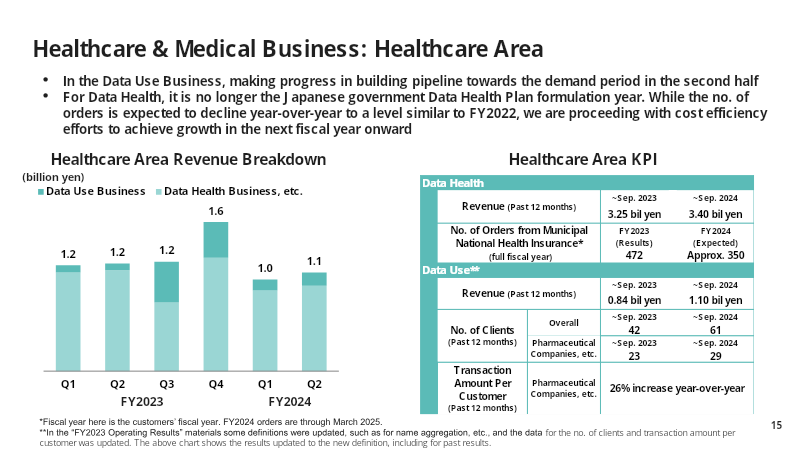
The operating results for the second quarter of fiscal year 2024 reflect a period of strategic portfolio management and operational adjustment across DeNA’s diversified business segments.
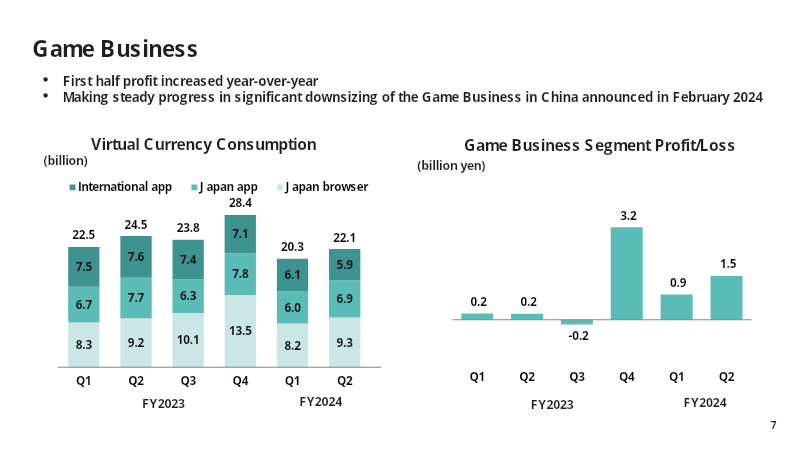
- DeNA reported a 7% year-over-year decline in first-half consolidated revenue to 70.3 billion yen, yet achieved a 14% increase in operating profit to 5.5 billion yen.
- The Game Business segment saw a 14% revenue drop due to downsizing in China, but segment profit surged 463% to 2.4 billion yen.
- The Sports Business remains a primary growth driver, supported by record-high stadium attendance and championship success for the Yokohama DeNA BayStars.
Q3 FY2024 Operating Results: DeNA
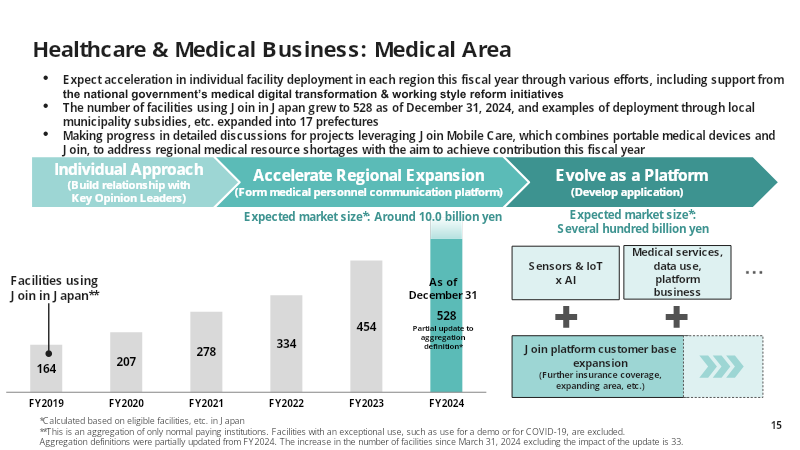
DeNA’s Q3 FY2024 operating results demonstrate a significant financial turnaround, characterized by a substantial increase in consolidated revenue and operating profit compared to the previous fiscal year.
- DeNA reported a significant financial turnaround in Q3 FY2024, with consolidated revenue reaching 46.5 billion yen, a 60% increase year-over-year, and operating profit surging to 15.5 billion yen.
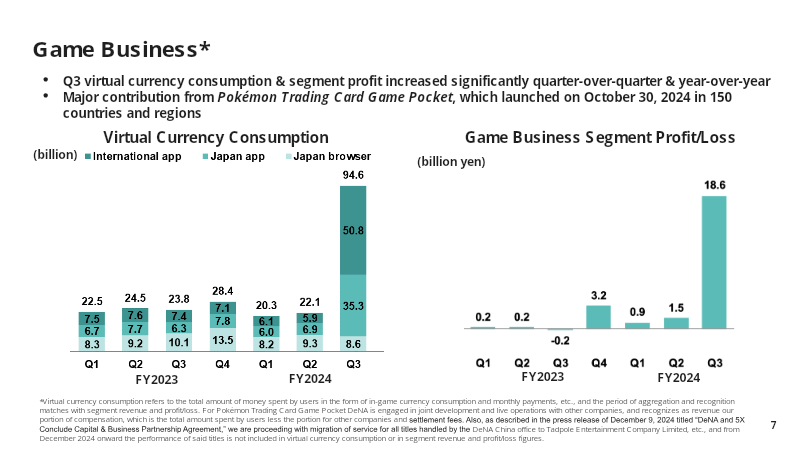
- The Game segment was the primary growth driver, generating 28.0 billion yen in revenue—a 147% quarter-over-quarter increase—largely fueled by the global launch of Pokémon Trading Card Game Pocket.
- Pokémon Trading Card Game Pocket achieved 60 million global downloads by December 2024 and maintained high user retention rates.


Presentation Material: 2Q FY2026
CyberAgent’s second-quarter fiscal year 2026 results demonstrate strong financial momentum, characterized by record-high consolidated sales and operating profit.
- CyberAgent achieved record-high 2Q FY2026 consolidated sales of 246.2 billion yen (up 13.3% YoY) and an operating profit of 29.0 billion yen (up 39.3% YoY).
- The Game segment was the primary growth driver, with sales rising 31.2% to 67.5 billion yen and operating profit increasing 36.3% to 20.9 billion yen.
- International expansion significantly bolstered gaming performance, with overseas sales increasing 3.5-fold, largely driven by the English release of 'Umamusume: Pretty Derby'.
FY2026 3Q Financial Results Briefing: GREE Holdings
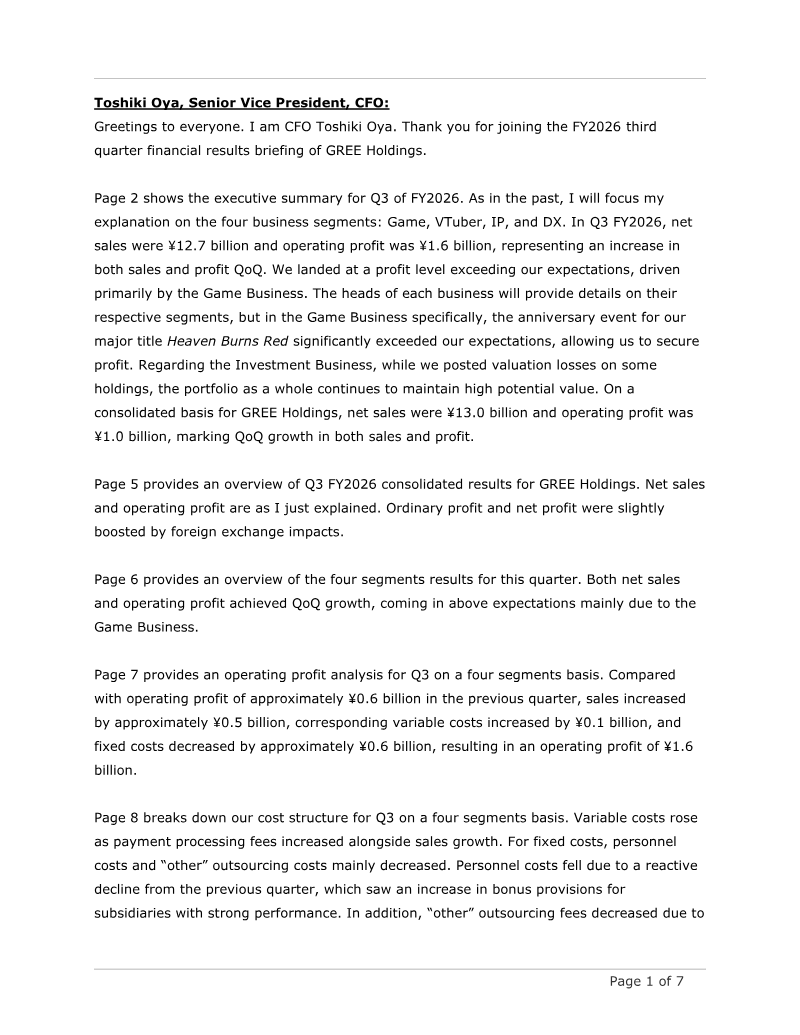
GREE Holdings’ third-quarter financial results for fiscal year 2026 demonstrate a period of growth, with consolidated net sales reaching ¥12.7 billion and operating profit totaling ¥1.6 billion.
- GREE Holdings revised its FY2026 full-year operating profit forecast upward to ¥4.4 billion, exceeding the initial estimate of ¥3.6 billion.
- Third-quarter consolidated net sales reached ¥12.7 billion with an operating profit of ¥1.6 billion, driven by strong performance in anniversary events for major game titles.
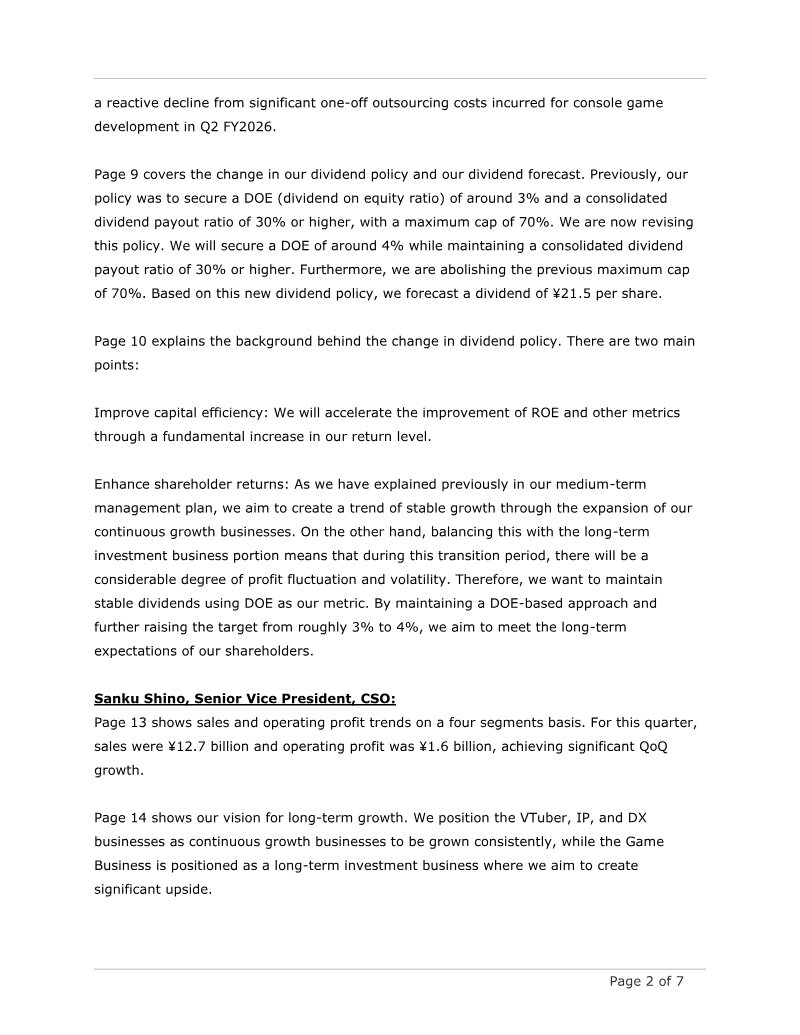
- The company increased its target Dividend on Equity (DOE) ratio from 3% to 4% and removed the 70% payout ratio cap to enhance shareholder returns.


Consolidated Results Supplementary Information: Q1 FYE March 2026
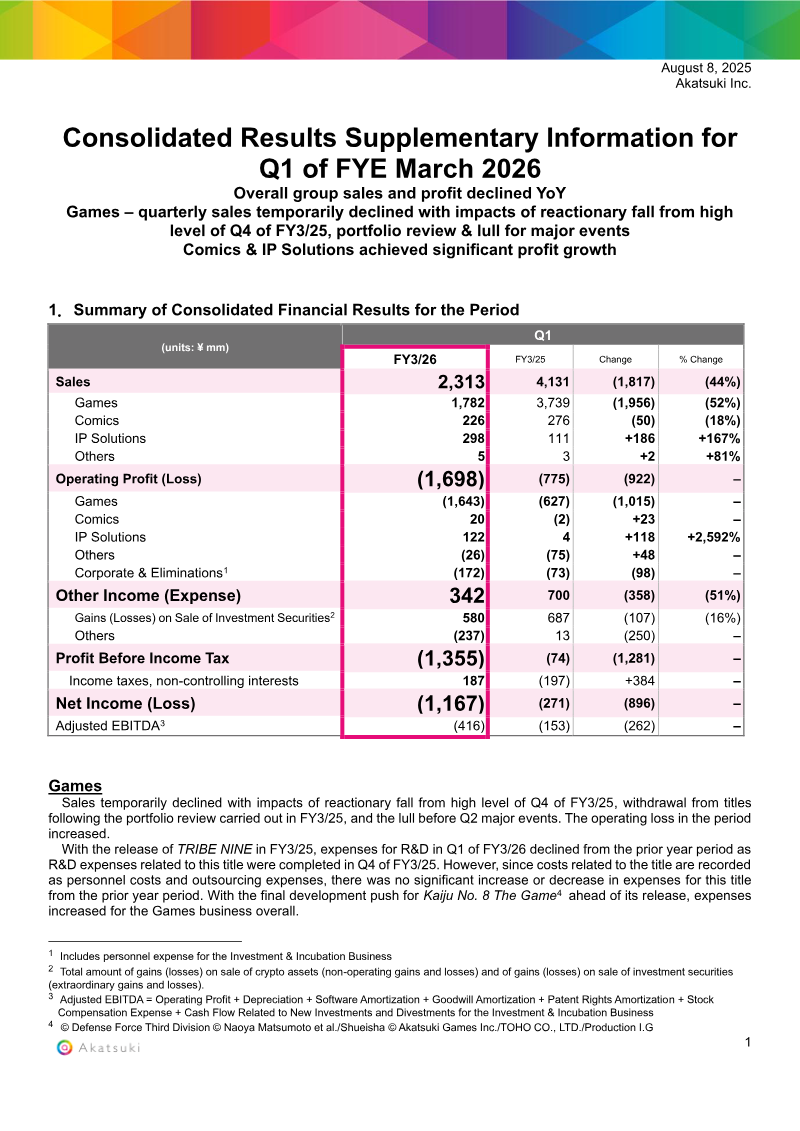
Akatsuki Inc. reported a sharp decline in consolidated sales and operating results for Q1 of the fiscal year ending March 2026, with total group sales falling 44% YoY to ¥2,313 million.
- Akatsuki Inc. reported a 44% year-over-year decline in total consolidated sales to ¥2,313 million for Q1 FYE March 2026, resulting in a net loss of ¥1,167 million.
- The Games segment experienced a 52% sales drop to ¥1,782 million and an operating loss of ¥1,643 million, driven by a portfolio review withdrawal and a lack of major new releases.
- The IP Solutions unit achieved significant growth, with sales increasing 167% to ¥298 million and operating profit rising 2,592% to ¥122 million, bolstered by the 'Slash Gift' online lottery and the consolidation of CRAYON, Inc.

FY2024 Third Quarter Consolidated Financial Results: Japan
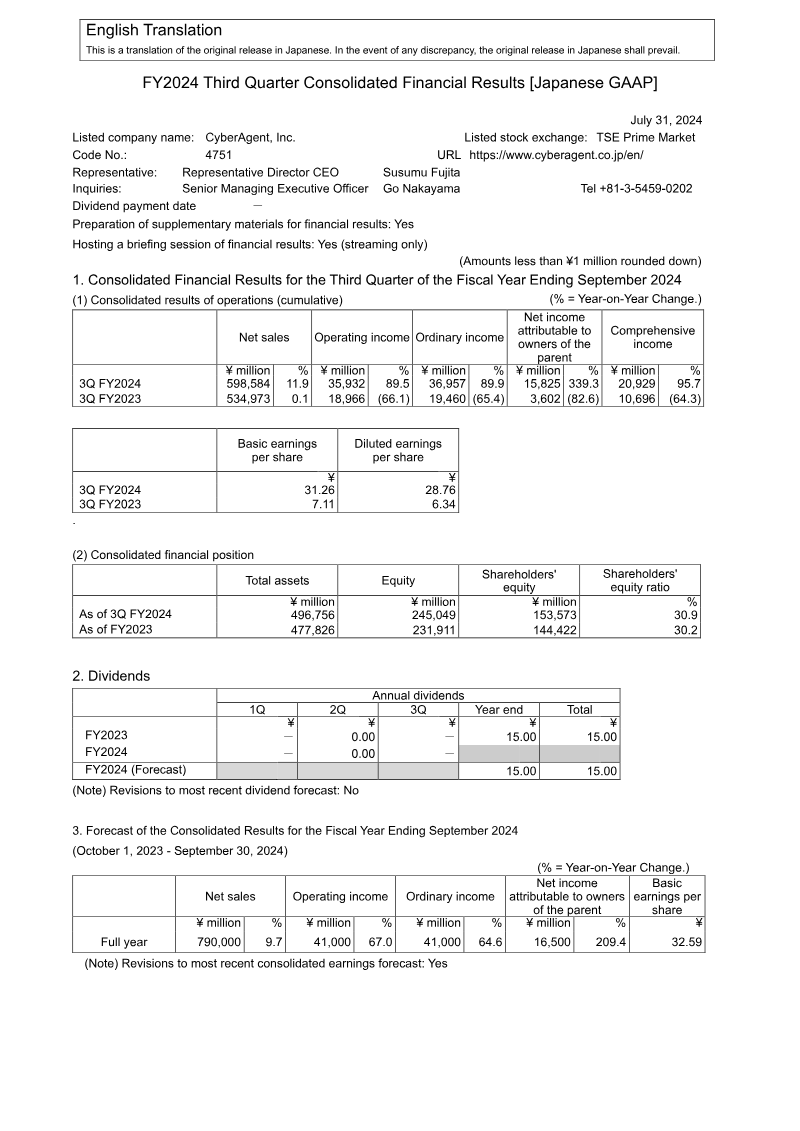
CyberAgent, Inc. reported a strong third-quarter performance for FY2024, with net sales rising 11.9% year-on-year to ¥598 584 million and operating income increasing 89.5% to ¥35 932 million.
- CyberAgent reported strong FY2024 Q3 growth with net sales rising 11.9% to ¥598,584 million and operating income surging 89.5% to ¥35,932 million.
- Net income attributable to owners increased 339% year-on-year to ¥15,825 million, with diluted earnings per share rising from ¥6.34 to ¥28.76.
- The Game Business and Internet Advertisement segments were primary growth drivers, contributing ¥151,070 million and ¥324,839 million in sales respectively.
Quarterly Transition by Business Segment: Japan
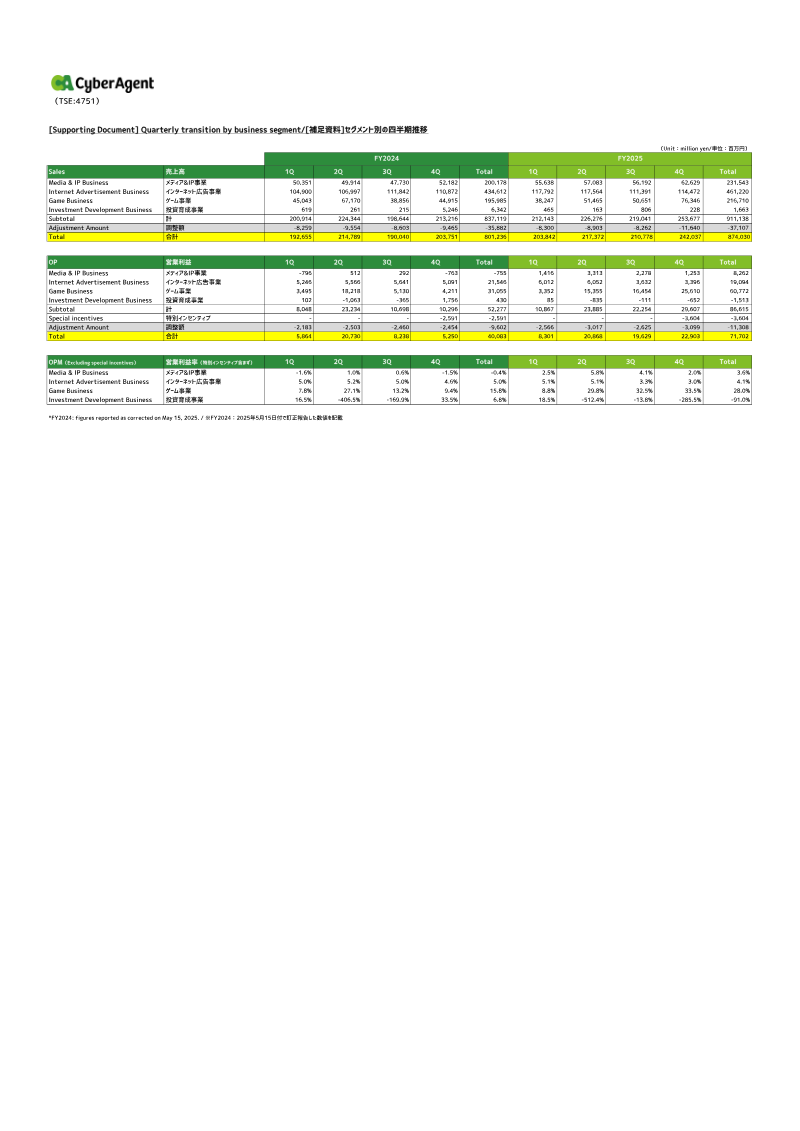
The quarterly transition analysis for Japan’s business segments presents detailed financial performance for FY2024 and FY2025, focusing on Media & IP, Internet Advertisement, Game, and Investment Development divisions.
- The Game Business is the company's most profitable segment, maintaining a FY2025 average operating profit margin of 28% and peaking at 33.5% in Q3 FY2024.
- Internet Advertisement is the largest revenue generator, growing from ¥434,612 million in FY2024 to ¥461,220 million in FY2025, though it operates on thin margins of approximately 5%.
- Game Business revenue is highly volatile, experiencing a sharp decline from a peak of ¥67,170 million in Q2 FY2024 to ¥38,856 million in Q3 FY2024.