Board
Company
Documents about Board
Sustainability at Embracer Group: FY 2025/26 ESG Fact Sheet
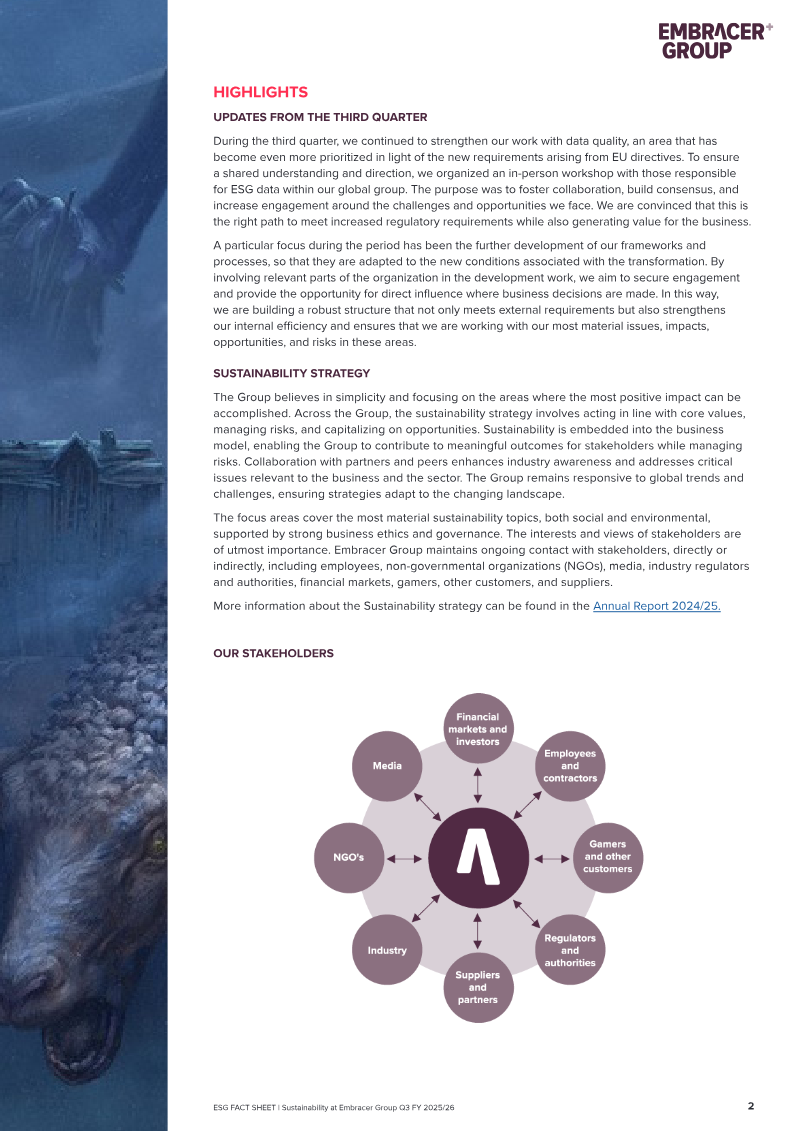
Embracer Group’s sustainability strategy for the 2025/26 fiscal year centers on integrating environmental, social, and governance (ESG) principles into its core business model to drive long-term value for stakeholders.
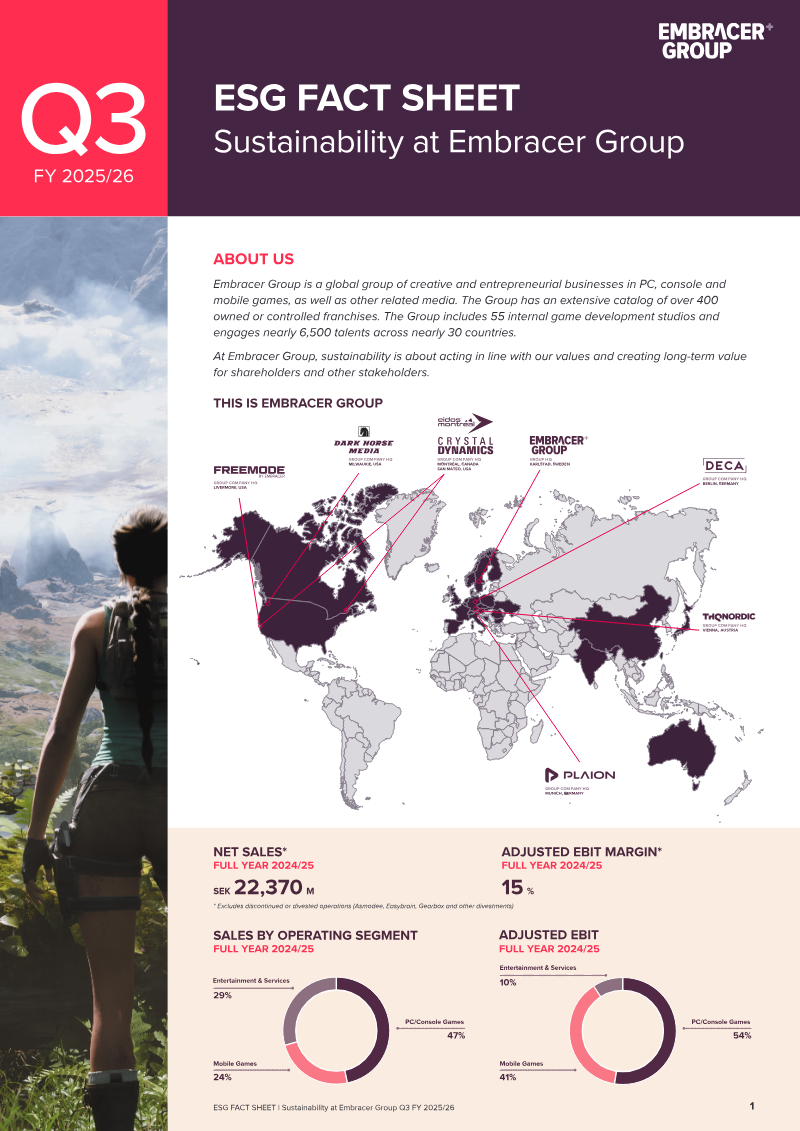
- Embracer Group operates 55 internal studios with nearly 6,500 employees across 30 countries, utilizing a double materiality framework to assess both environmental/social impact and financial sustainability risks.
- The company reported net sales of SEK 22,370 million for the 2024/25 fiscal year, with PC and console games accounting for 47% of total revenue and an adjusted EBIT margin of 15%.
- The workforce is geographically concentrated with 64% of employees in Europe and 31% in North America, while maintaining a gender distribution of 27% women and 73% men.

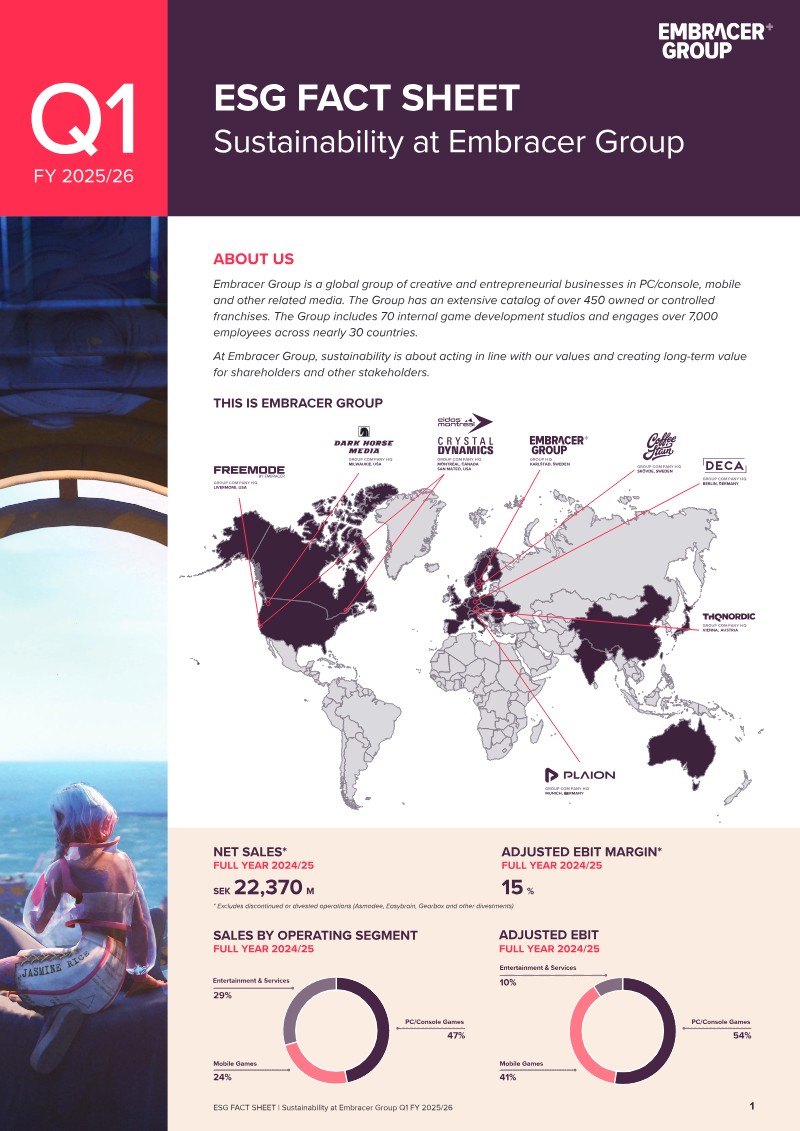
Sustainability at Embracer Group: ESG Fact Sheet
The Embracer Group’s sustainability framework centers on integrating environmental, social, and governance (ESG) principles into its global operations to drive long-term value for stakeholders.
- Embracer Group operates a global network of 70 internal game development studios with over 7,000 employees across nearly 30 countries.
- The company reported net sales of SEK 22,370 million for the 2024/25 fiscal year.
- The workforce is geographically concentrated with 64% based in Europe and 31% in North America.
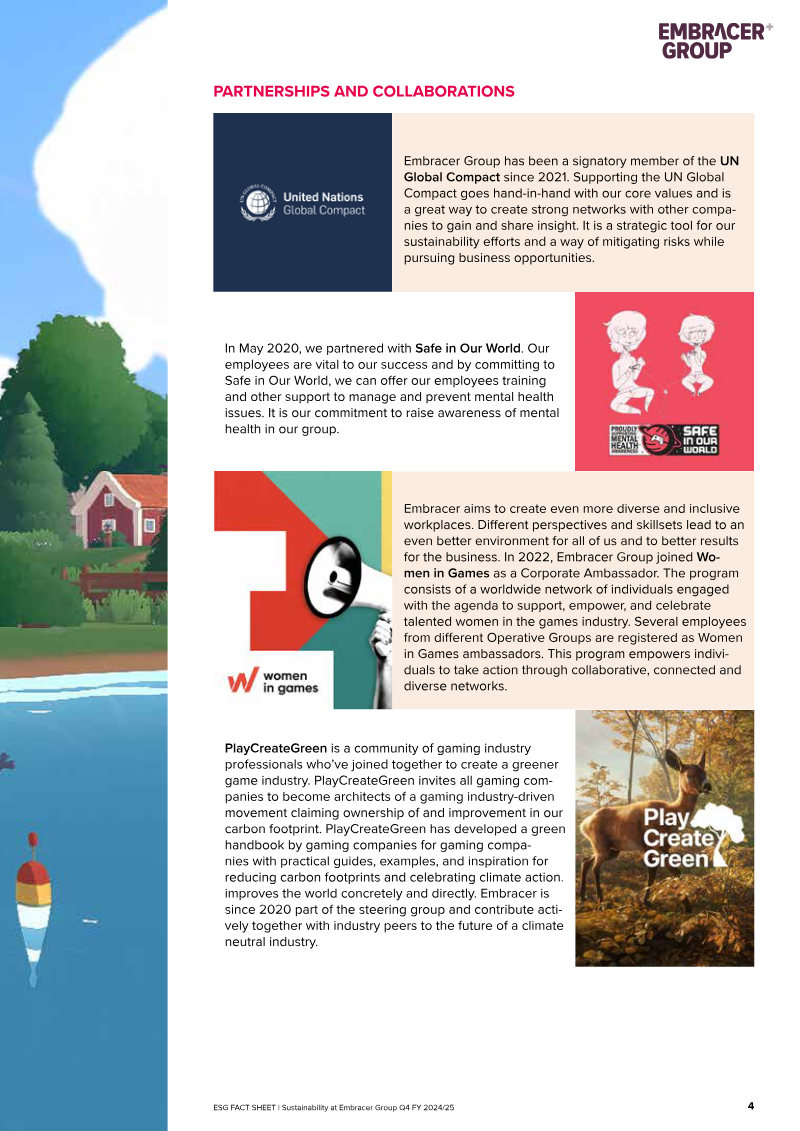
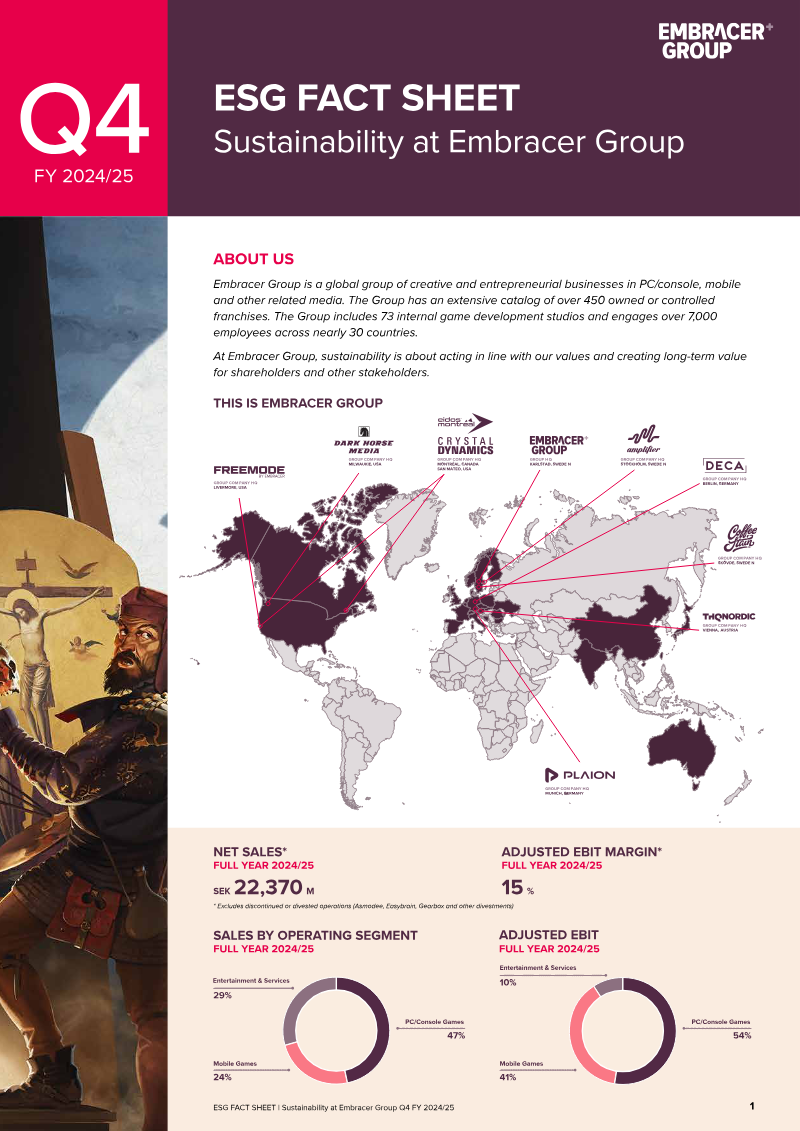
Sustainability at Embracer Group: FY 2024/25 ESG Fact Sheet
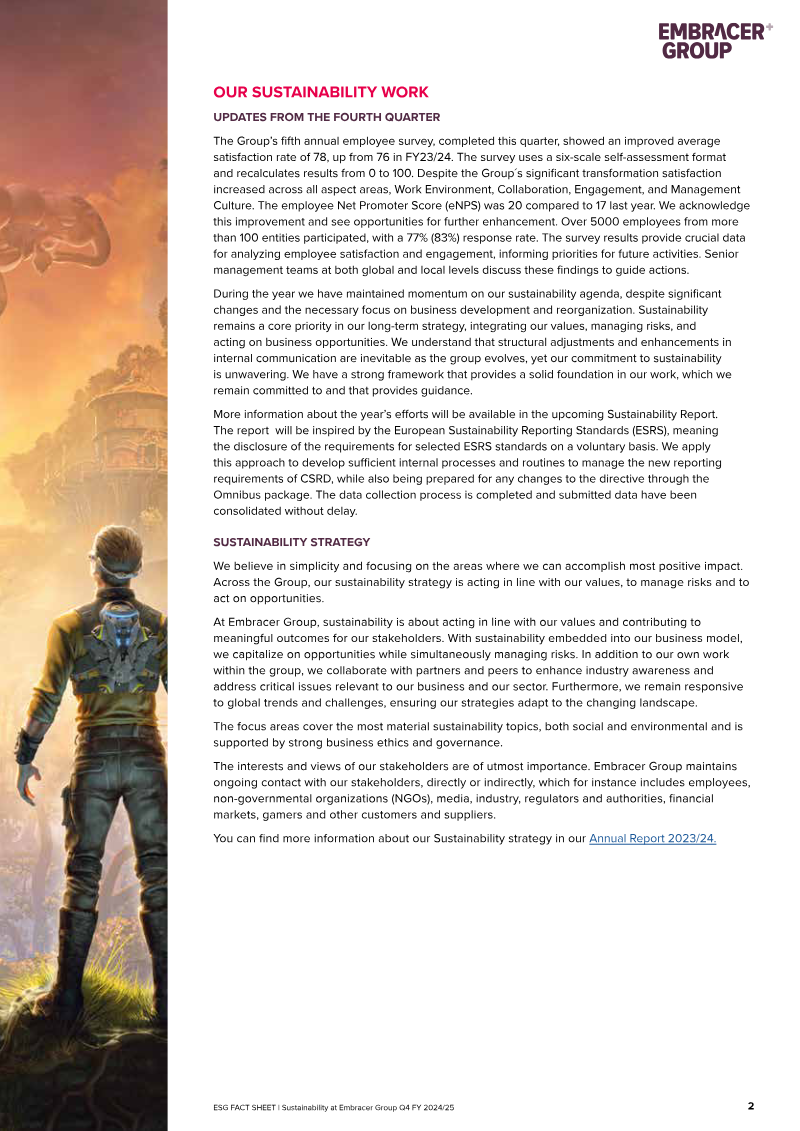
The Embracer Group’s FY 2024/25 ESG Fact Sheet outlines the organization’s commitment to integrating sustainability into its core business model, emphasizing value creation for stakeholders through risk management and ethical governance.
- Embracer Group reported net sales of SEK 22,370 million and an adjusted EBIT margin of 15% for the FY 2024/25, a period marked by significant structural transformation and divestment.
- Employee satisfaction improved to 78 out of 100, up from 76 in the previous year, with a 77% response rate from over 5,000 participants and an employee Net Promoter Score of 20.
- The organization manages its sustainability and governance through a framework of 17 group-wide policies and 17 instructional guidelines covering anti-corruption, privacy, and AI ethics.

Embracer Group Annual General Meeting 2024: Presentation
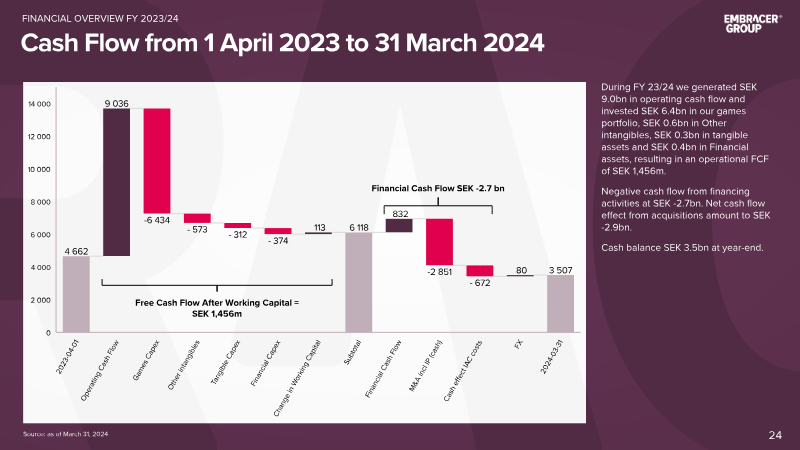
Embracer Group concluded the 2023/24 fiscal year with a stable financial performance, reporting net sales of SEK 42.2 billion, representing a 12 percent year-over-year increase, alongside an adjusted EBIT of SEK 7.06 billion.
- Embracer Group is splitting into three independent, publicly listed entities: Asmodee, Coffee Stain & Friends, and Middle-Earth & Friends.
- The company reported fiscal year 2023/24 net sales of SEK 42.2 billion, a 12 percent year-over-year increase, with an adjusted EBIT of SEK 7.06 billion.
- The corporate restructuring follows a rigorous program initiated in 2023 that included the divestment of non-core assets and 54 Board of Directors meetings.
Finland Games Industry: 2018 Year in Review
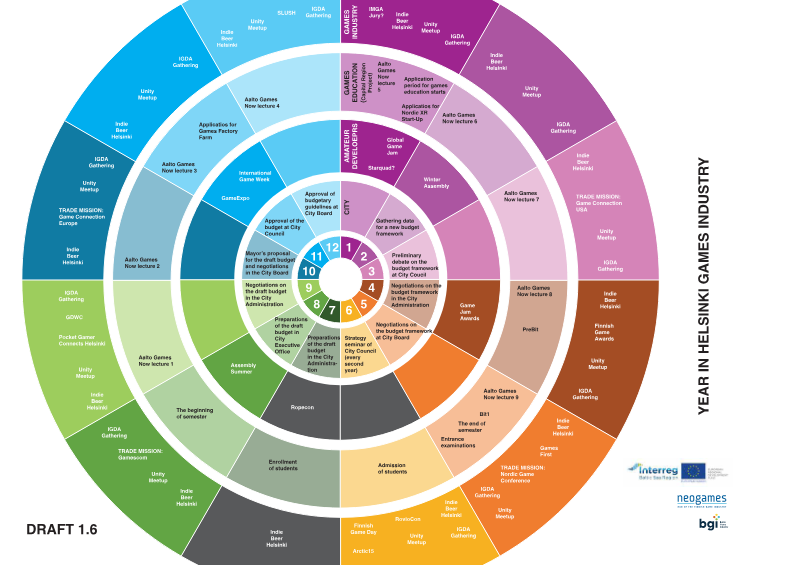
The Helsinki games industry ecosystem in 2018 functioned through a dense, highly integrated network of academic institutions, professional organizations, and municipal governance.
- The Helsinki games industry in 2018 operated through a highly integrated ecosystem connecting municipal governance, academic institutions, and professional organizations.
- Municipal support was a primary driver of stability, with the Helsinki City Council and City Board aligning budgetary cycles and long-term planning with industry needs.
- Aalto University and specialized Unity-focused programs served as the primary talent pipeline, with the industry's professional rhythm dictated by the academic calendar.
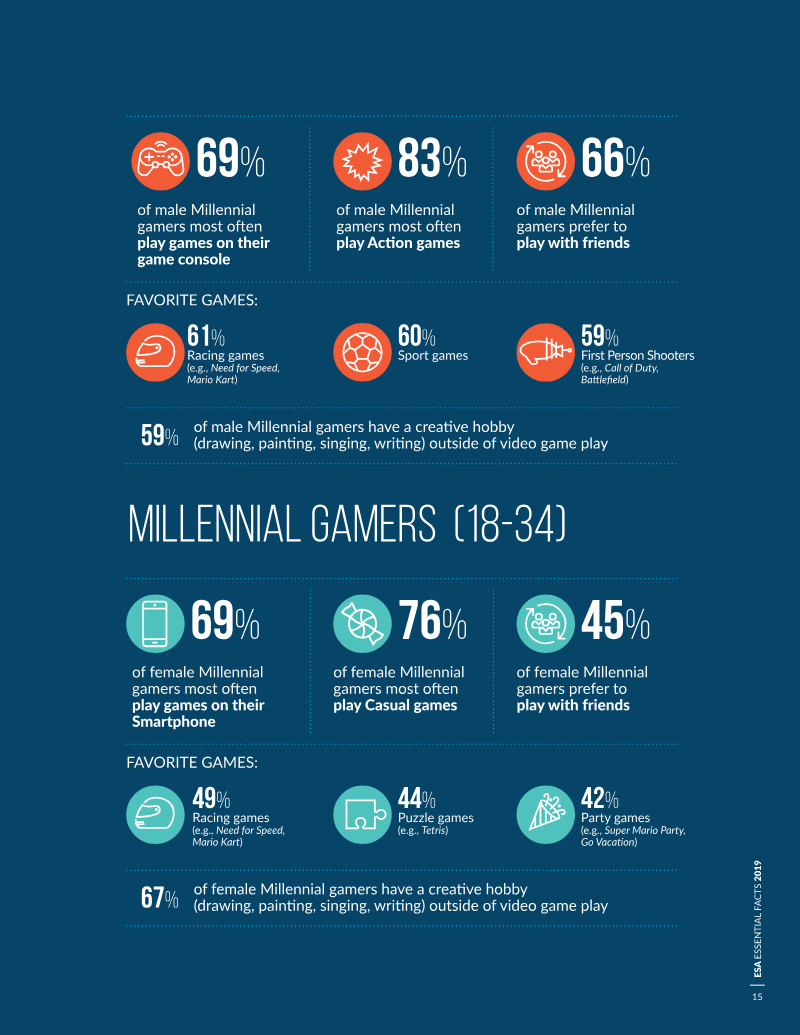

2019 Essential Facts About the Computer and Video Game Industry
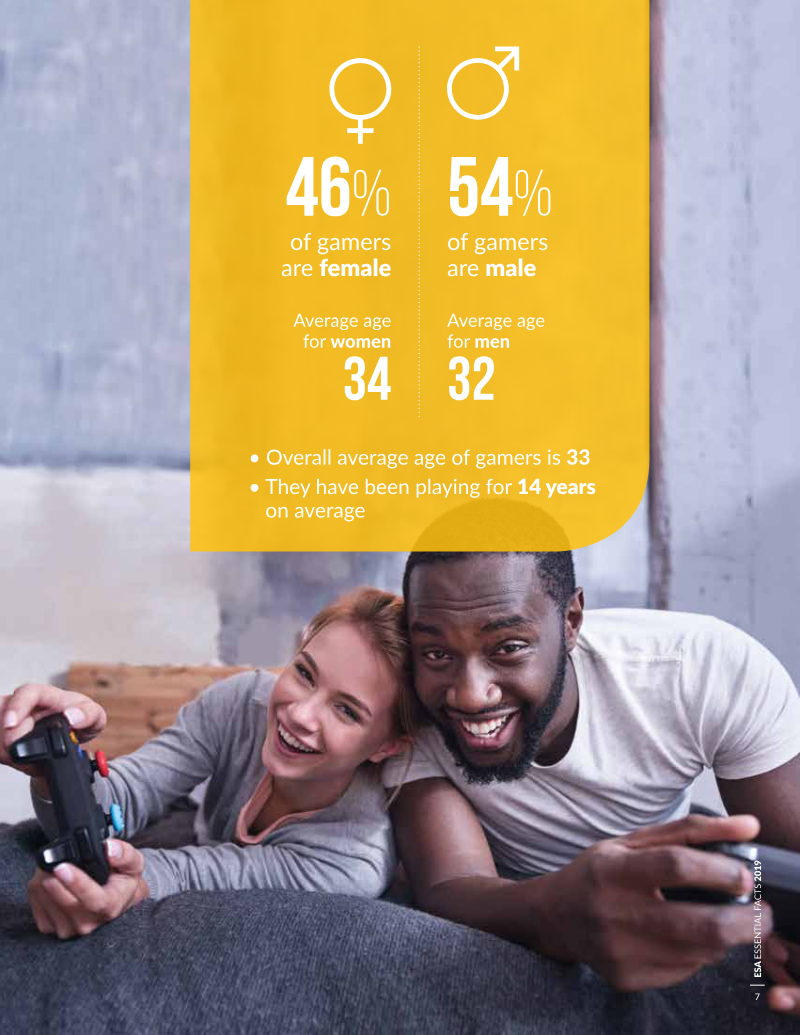
The 2019 Essential Facts About the Computer and Video Game Industry provides a comprehensive overview of the American gaming landscape, highlighting the industry's record-breaking performance and the diverse demographics of its player base.
- The U.S. video game industry generated $43.4 billion in total sales during 2018.
- Digital distribution dominated the market in 2018, accounting for 83% of all physical and digital format sales.
- Gaming is a pervasive household activity, with 75% of American households containing at least one gamer.
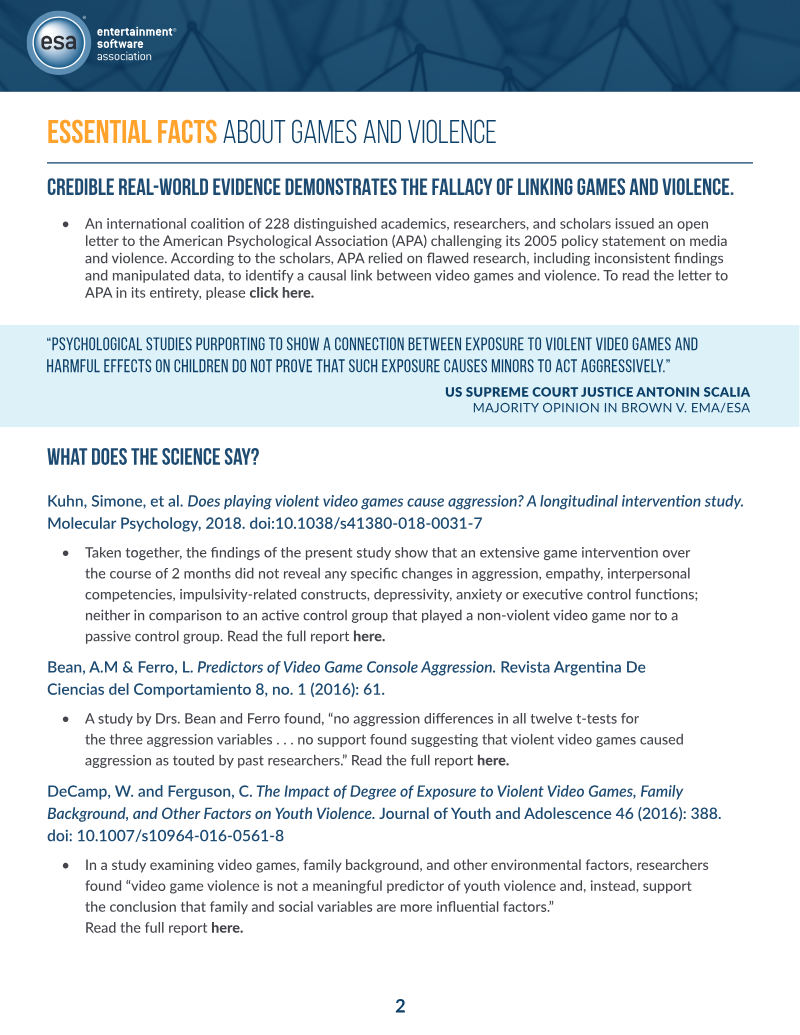
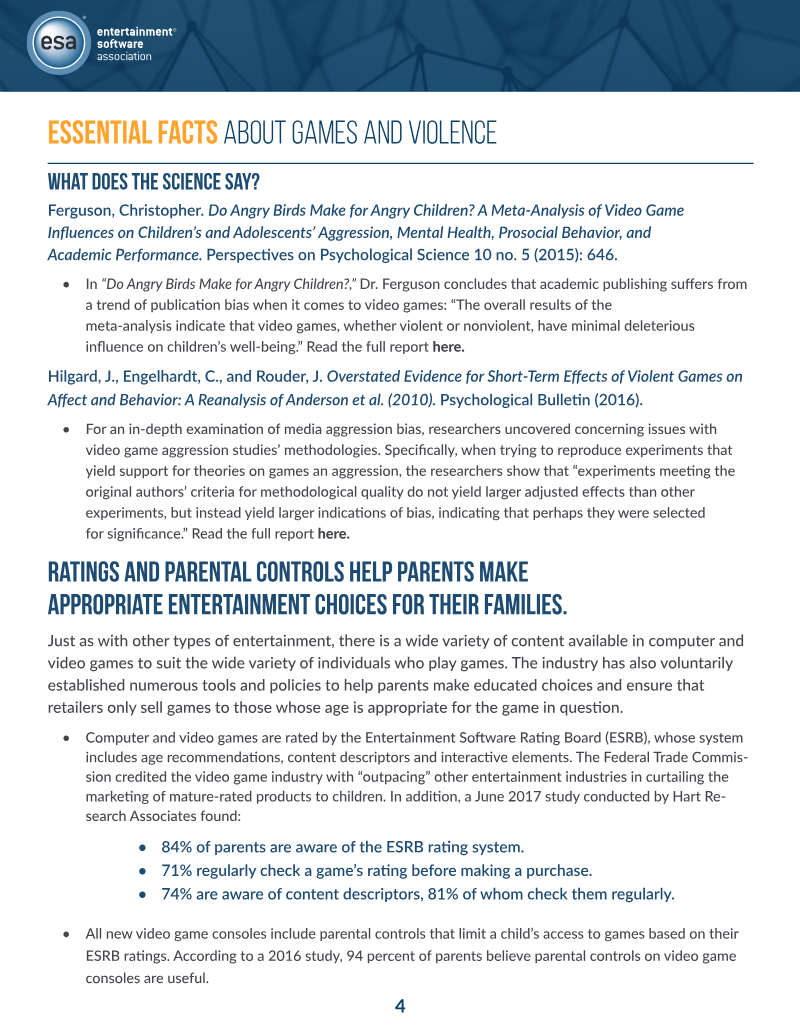
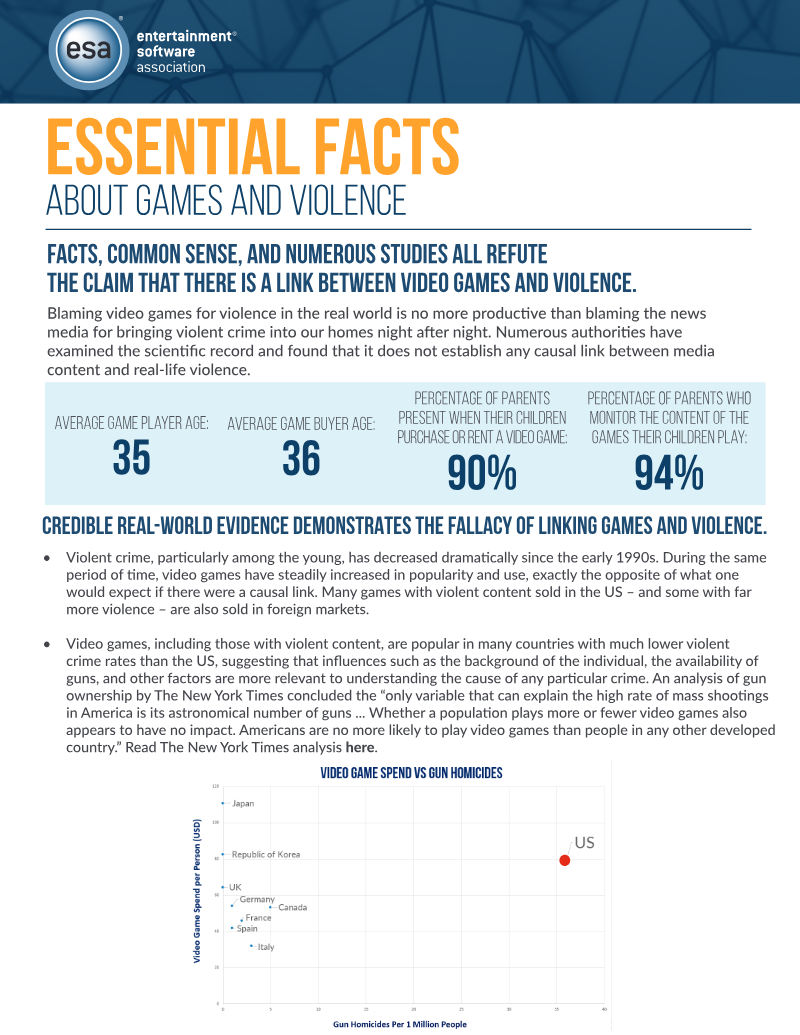
Essential Facts About Video Games and Violence
The primary purpose of this analysis is to refute the existence of a causal link between video game consumption and real-world violence.
- Longitudinal studies and meta-analyses consistently show no causal link between violent video game consumption and future aggression or criminal behavior.
- Violent crime rates in the United States have reached multi-decade lows during the same period that the video game industry has experienced significant expansion.
- Primary drivers of violent conduct are identified as family environment, mental health, and individual personality traits rather than media consumption.
Mobile Gaming Benchmarks: 2018
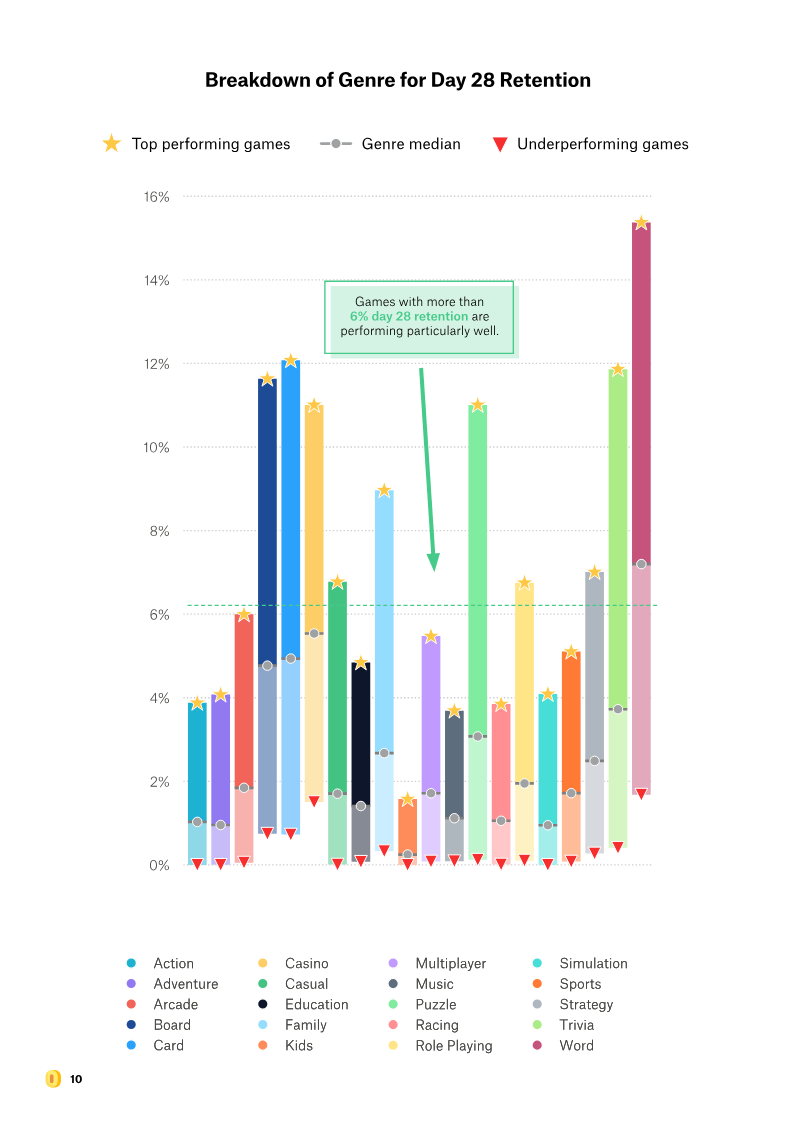
The 2018 mobile gaming benchmark study analyzes performance across more than 60 000 titles that each attract at least 1,000 daily users, drawing on data from 850 million monthly active players over a full calendar year (July 2017-June 2018).
- Top-tier mobile games achieve day-28 retention rates of 6.5–7% during the winter months, significantly outperforming the industry median of 1.5%.
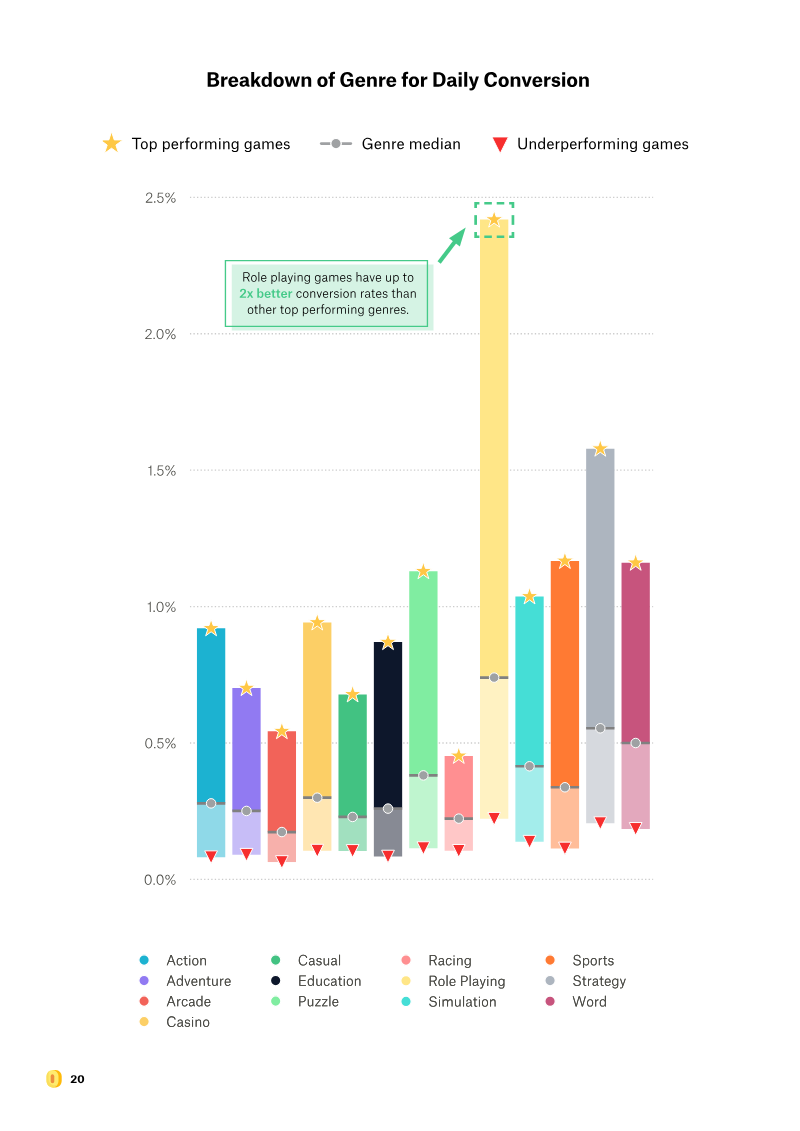
- Role-playing games lead the market in ARPDAU, with top titles generating 6–7 times the revenue of the median performer.
- Strategy games consistently outperform the broader market, achieving double the ARPDAU and conversion rates of average mobile titles.
Essential Facts 2013: Canada
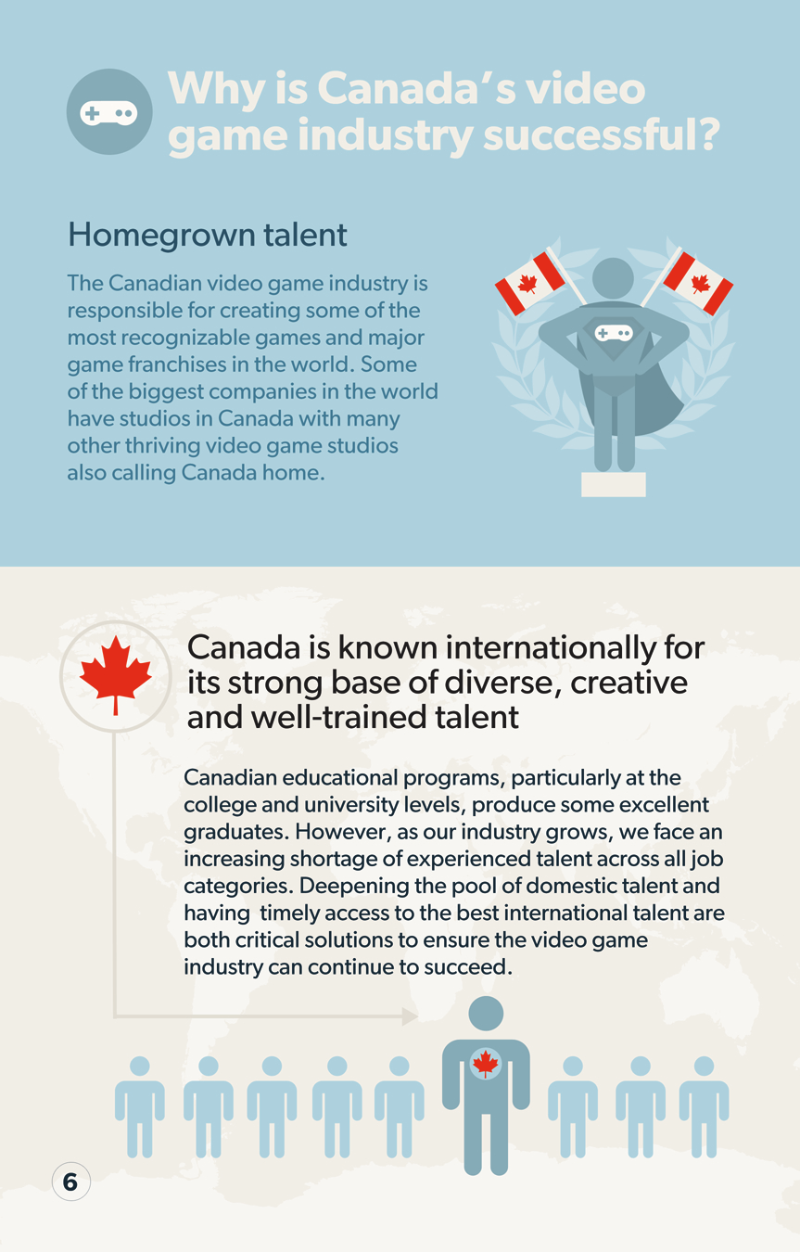
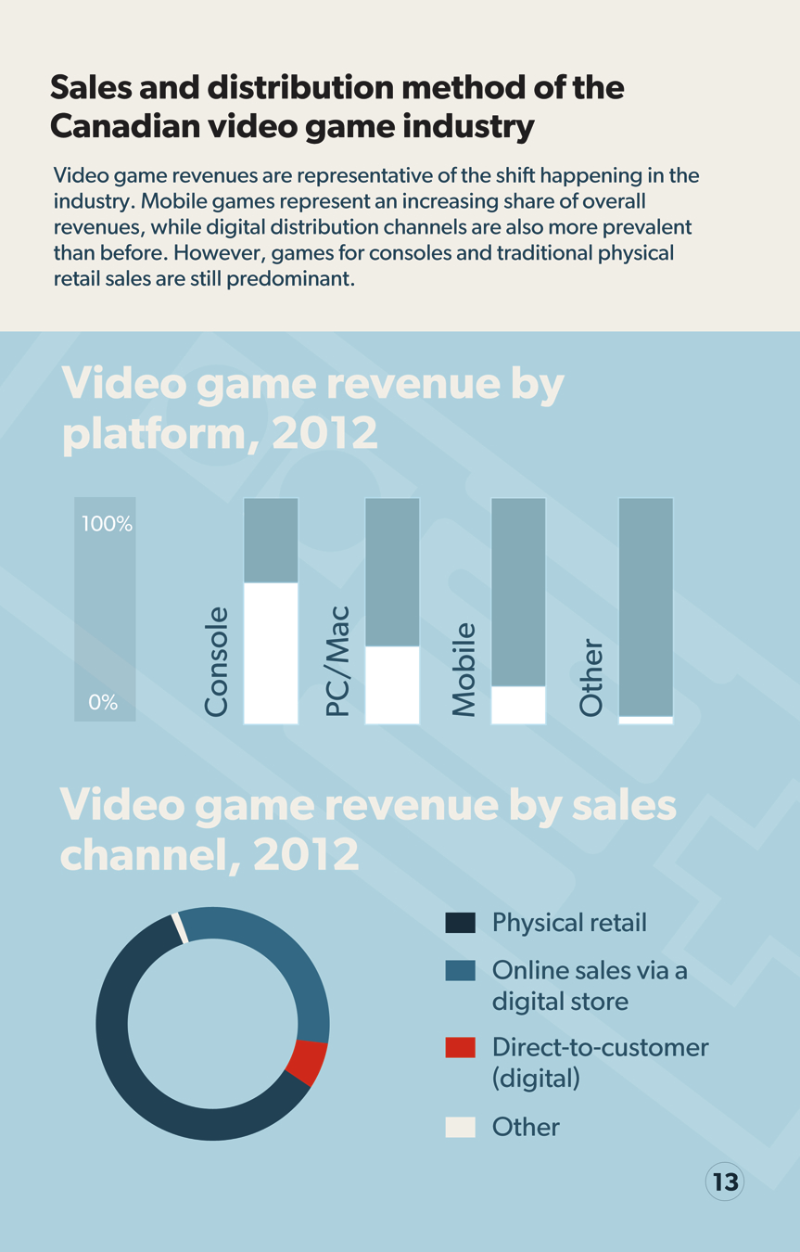
The 2013 industry analysis of the Canadian video game sector highlights a robust, globally significant market that serves as the third-largest video game development hub in the world.
- The U.S. computer and video game industry generated $21.53 billion in total revenue during 2013.
- Consumer spending on game content reached $15.39 billion, representing the largest portion of total industry revenue.
- Digital format sales experienced an 11 percent year-over-year growth rate in 2013.
CESA Game Development Technology Roadmap: 2010 Edition
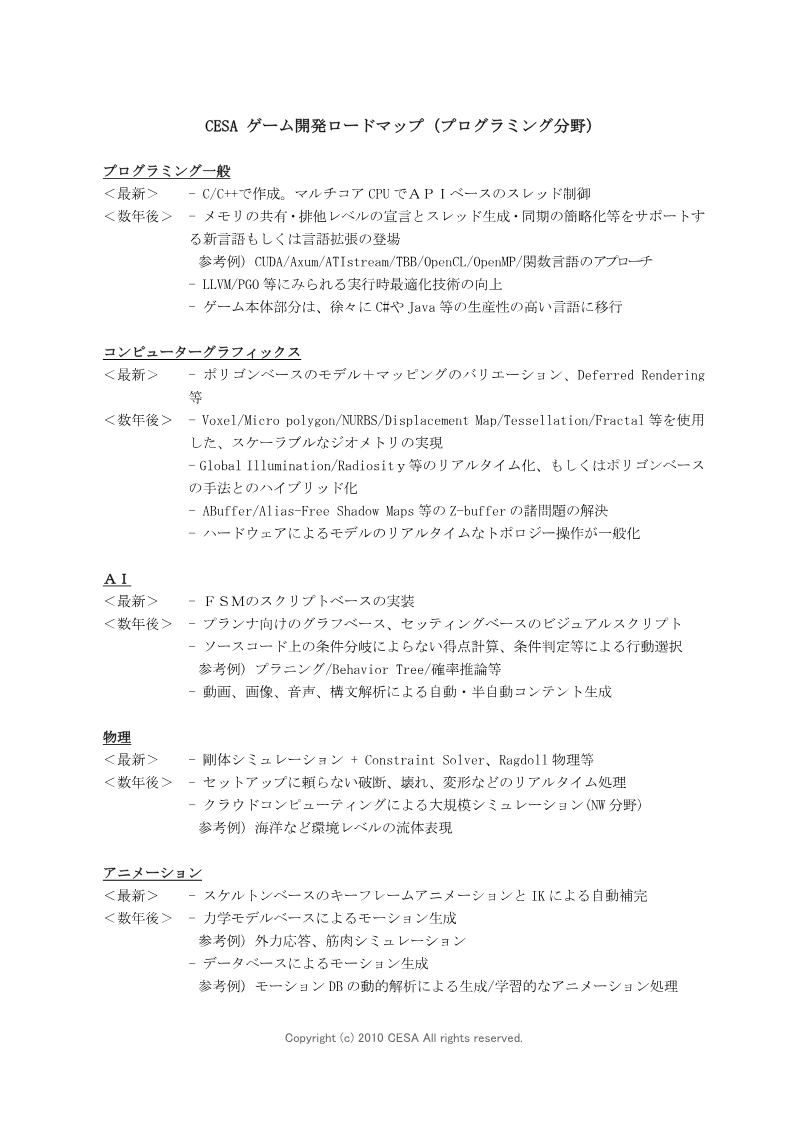
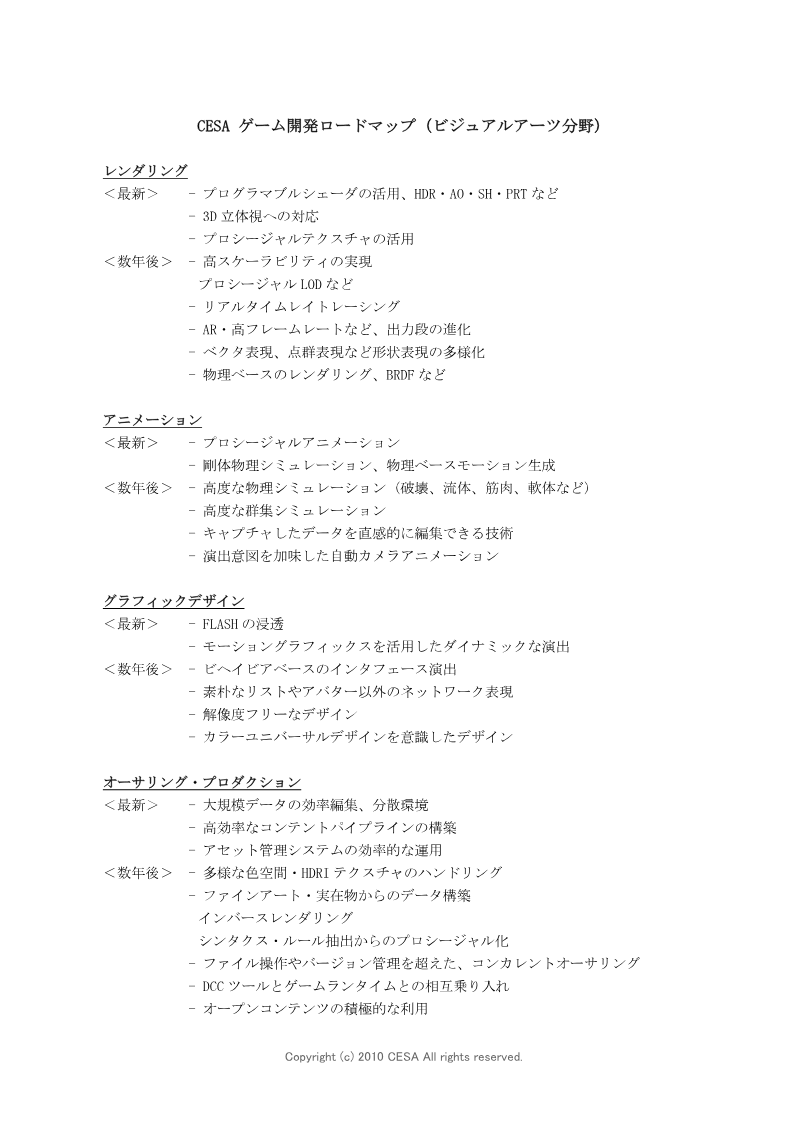
The CESA Game Development Technology Roadmap 2010 serves as a strategic guide for game developers, researchers, and industry stakeholders to navigate current and emerging technical trends.
- The industry is shifting toward increased automation, cloud integration, and cross-platform scalability to support device-agnostic gaming environments.
- Programming and visual arts workflows are transitioning from traditional C/C++ toward higher-level languages and the integration of real-time physics, global illumination, and procedural generation.
- Game design is increasingly utilizing data-driven insights, psychological modeling, and the standardization of motion-control interfaces.
COLOPL Integrated Report 2022
COLOPL is navigating a period of strategic transition following a challenging 2022 fiscal year, during which the company experienced a 13.9% decline in net sales and a 27.7% decrease in operating profit within its core Entertainment Business.
- COLOPL experienced a significant financial downturn in fiscal year 2022, with net sales declining by 13.9% and operating profit falling by 27.7% in its Entertainment Business.
- The company maintains a strong balance sheet to support its turnaround strategy, reporting approximately 55 billion yen in cash and 76.6 billion yen in total net assets as of September 2022.
- Management has set a target to reverse the current downward financial trend by the fiscal year ending September 2024 through a focus on high-quality IP and emerging technology integration.

COLOPL Integrated Report 2024
COLOPL is navigating a period of significant strategic transition following a challenging fiscal year ending September 2024, during which the company recorded net sales of 25,975 million yen and an operating loss of 1,208 million yen.
- COLOPL reported a fiscal year 2024 net loss of 1,208 million yen on 25,975 million yen in sales, driven by delayed title releases and the sunsetting of legacy games.
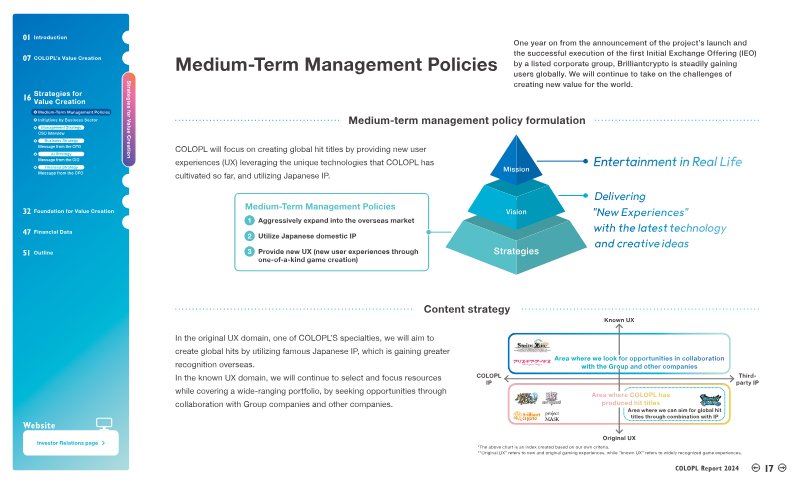
- The company is pivoting from a domestic mobile-only focus to a diversified strategy encompassing global expansion, console development, and blockchain integration.
- A central pillar of the new strategy is the Brilliantcrypto project, which established the company as the first Japanese listed corporate group to issue its own token.