Alliance
Company
Documents about Alliance

GDEV Inc Q3 2024 Financial Results
The Q3 2024 financial results for GDEV Inc. demonstrate a period of strategic operational refinement and improved profitability.
- GDEV Inc. reported a Q3 2025 profit of $24 million, up from $15 million in the same period of the previous year.
- Adjusted EBITDA increased to $26 million in Q3 2025, with the margin improving to 27% from 16% in Q3 2024.
- Total costs and expenses were reduced to $72.7 million, primarily driven by a significant decrease in selling and marketing expenditures.

GDEV Inc Q3 2024 Financial Results
GDEV Inc’s financial results for the second quarter of 2025 demonstrate a period of operational growth and improved profitability, despite a decline in certain user engagement metrics.
- GDEV Inc reported Q2 2025 revenue of $119.9 million, an increase from $105.8 million in Q2 2024.
- Profit for the period rose to $16.6 million, up from $14.7 million in the same quarter of the previous year.
- Adjusted EBITDA reached $22 million in Q2 2025, improving from $17 million in Q2 2024.



Q3 2024 Financial Results
The financial results for the third quarter of 2024 reveal a period of stabilization and shifting cost structures within the gaming portfolio.
- The company achieved a $15 million profit in Q3 2024, marking a significant recovery from the $3 million net loss recorded in Q1 2024.
- Total revenue reached $111 million, representing a 5% increase over the previous quarter but an 8% decline compared to Q3 2023.
- Monthly Paying Users (MPUs) grew 21% year-over-year to 381,000, though Average Bookings Per Paying User (ABPPU) dropped 11% to $92.


Q2 2024 Financial Results
The second quarter 2024 financial results for the organization reveal a period of strategic transition characterized by a slight decline in revenue alongside a significant recovery in profitability.
- The company achieved a net profit of $15 million in Q2 2024, a significant turnaround from the $1 million loss reported in the previous quarter.
- Revenue reached $106 million, representing an 8% year-over-year decline, while adjusted EBITDA improved to $16 million from a negative $3 million in Q1 2024.
- The Hero Wars franchise remains the primary revenue driver, accounting for 89% of total earnings across its Alliance and Dominion Era titles.


GDE 1Q 2024 Financial Results
This financial presentation details the unaudited operational and financial performance of a gaming company for the first quarter of 2024, providing comparative data against the same periods in 2022 and 2023.
- The company achieved a positive operating profit of $1.9 million in Q1 2024, a significant turnaround from the $13.5 million operating loss recorded in Q1 2023.
- Net loss narrowed substantially to $1.4 million in Q1 2024, down from $8.2 million in the same period last year.
- Total revenue declined 10.4% year-over-year, falling from $119.3 million in Q1 2023 to $106.9 million in Q1 2024.


FY and 4Q 2023 Financial Results
GDEV’s financial and operational performance for the fourth quarter and full fiscal year of 2023 reveals a period of strategic transition characterized by improved profitability despite declining year-over-year revenues.
- GDEV achieved a full-year profit of $46 million in 2023, a significant recovery from $7 million in 2022, driven by a reduction in total costs from $454 million to $420 million.
- Full-year revenue declined to $465 million from $480 million, with fourth-quarter revenue falling 19% year-over-year to $109 million.
- The company remains highly concentrated on the Hero Wars franchise, which accounted for 89% of total bookings in the fourth quarter of 2023.

Stillfront Interim Report: Third Quarter 2021
Stillfront’s third-quarter 2021 interim report highlights a period of robust financial expansion and operational scaling, characterized by a 28% year-over-year increase in net revenue to 1,311 MSEK.
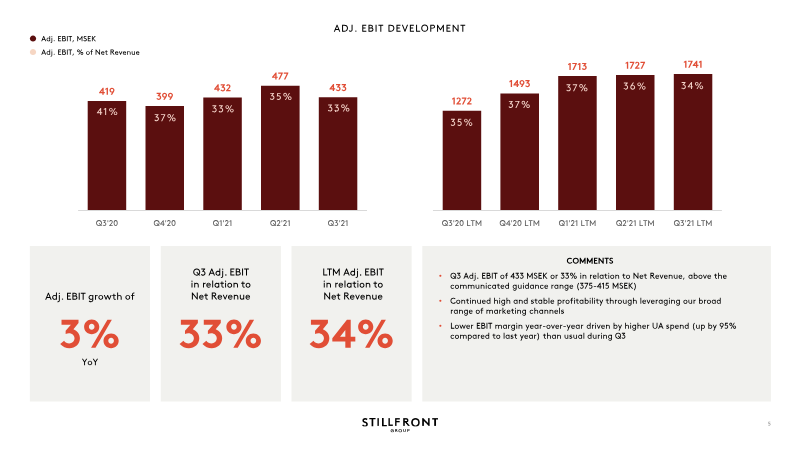
- Stillfront reported a 28% year-over-year increase in net revenue to 1,311 MSEK for Q3 2021, supported by a strong adjusted EBIT of 433 MSEK and a 33% margin.
- User acquisition (UA) spending increased by 95% compared to the prior year as the company prepared for seasonally stronger quarters and stabilized mobile advertising markets.
- The company maintained a healthy balance sheet with a 1.2x leverage ratio, remaining below its 1.5x target following a directed share issuance and 486 MSEK in operational cash flow.
Digital Turbine Quarterly Report: Q2 FY2018
Digital Turbine’s financial performance for the second quarter of fiscal year 2018 reflects a strategic transition toward higher-margin advertising services, characterized by revenue growth and narrowing losses.
- Digital Turbine reported a significant improvement in profitability for the three months ended September 30, 2017, with gross profit rising 133.5% to $7.36 million and operating loss narrowing by 80.2% to $1.25 million compared to the prior year.
- Net revenue for the quarter grew 22.2% year-over-year to $27.89 million, driven by the company's advertising and content distribution services.
- Revenue concentration remains high, with four major customers—Singapore Telecommunications (20.0%), AOL (14.2%), Telstra (12.5%), and Machine Zone (10.6%)—accounting for a combined 57.3% of net revenues during the quarter.
Digital Turbine Q1 Fiscal 2018 10-Q
Digital Turbine’s financial performance for the first quarter of fiscal 2018 reflects a strategic pivot toward high-margin advertising solutions, specifically the Ignite platform, which experienced a 120.6% revenue surge.
- Digital Turbine's core product, Ignite, is a mobile application management platform that monetizes device activations and life-cycle usage for mobile operators and OEMs through CPI, CPP, and CPA advertising arrangements.
- Total operating expenses decreased by 13.3% year-over-year for the quarter ended June 30, 2017, falling from $9.38 million to $8.14 million, primarily driven by a 25.1% reduction in general and administrative costs.
- As of June 30, 2017, the company reported $20.14 million in net accounts receivable, up from $16.55 million at the end of March 2017, with $8.96 million of that balance representing unbilled revenue.
Summary of Key Questions and Answers From Earnings Results Briefing for Q4 FY2016
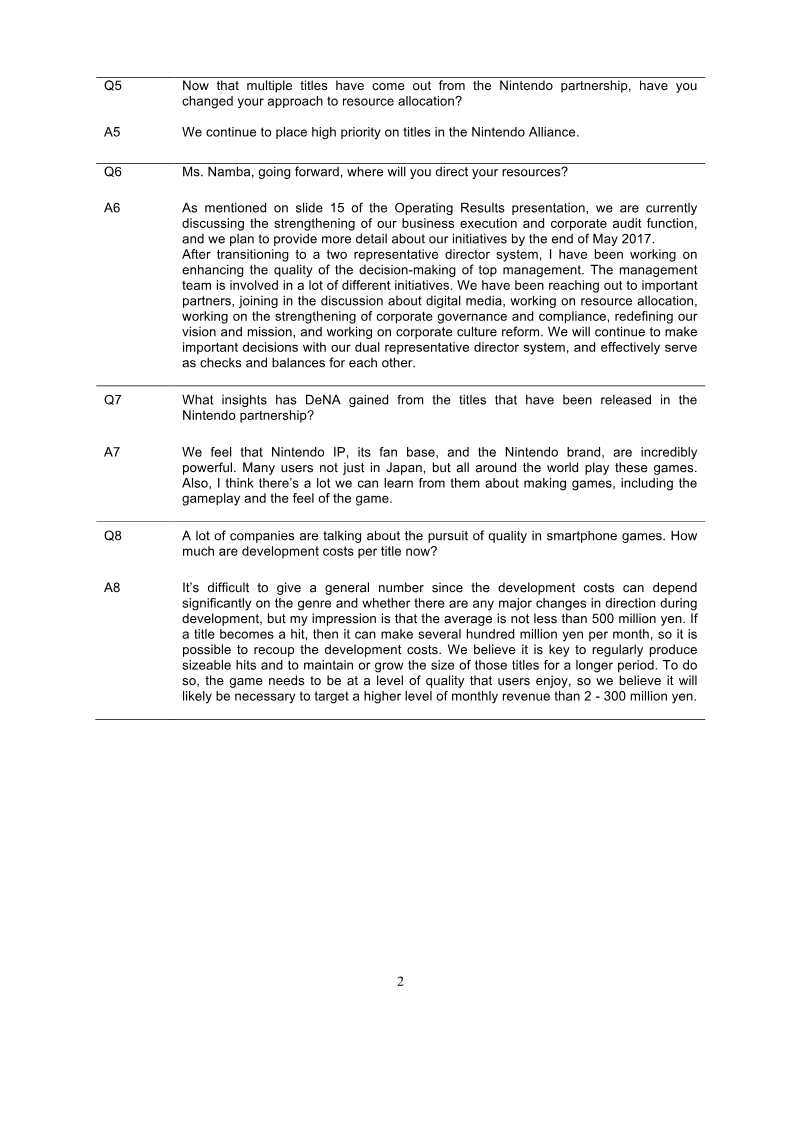
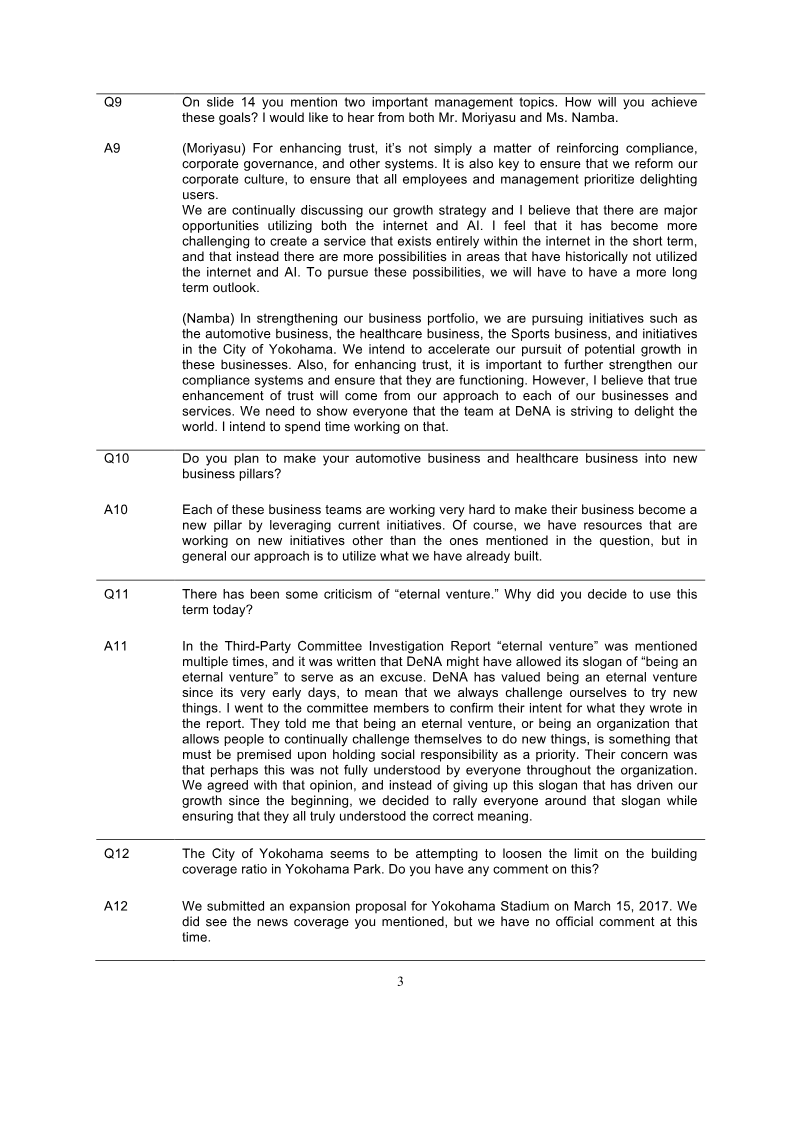
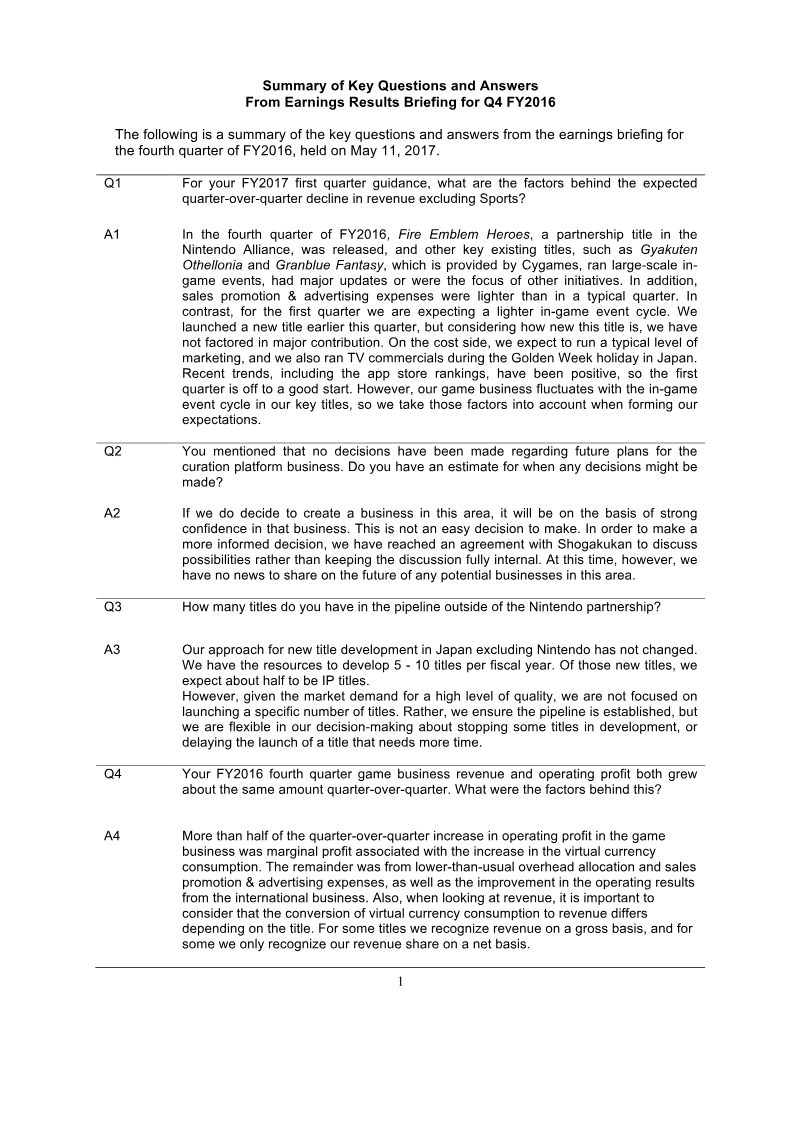
This summary outlines the key insights from the DeNA earnings results briefing for the fourth quarter of fiscal year 2016, held in May 2017.
- Development costs for high-quality smartphone games have reached a minimum threshold of 500 million yen per title, necessitating a focus on long-term revenue sustainability.
- DeNA maintains a consistent development pipeline of five to ten new gaming titles per fiscal year to mitigate revenue fluctuations caused by in-game event cycles.
- Q4 FY2016 operating profit growth was driven by increased virtual currency consumption, reduced overhead costs, and improved international performance.
Notice Regarding Capital and Business Alliance with Sony Music Entertainment (Japan) Inc.
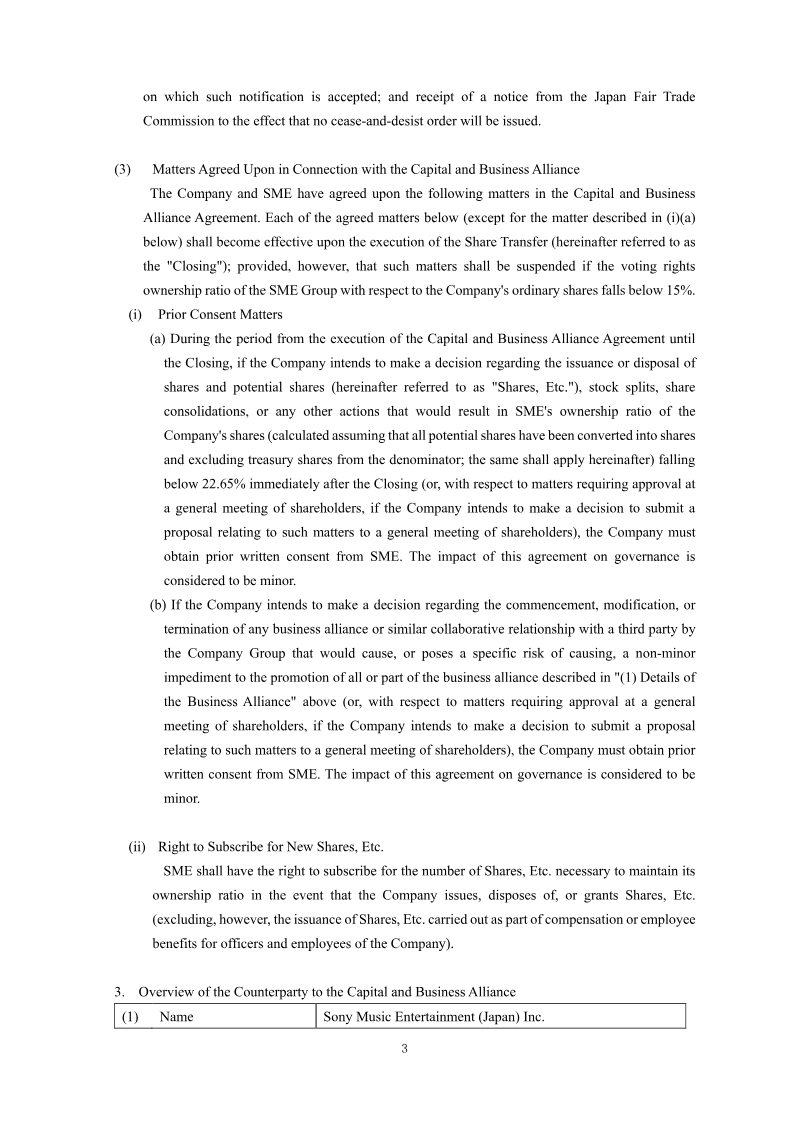
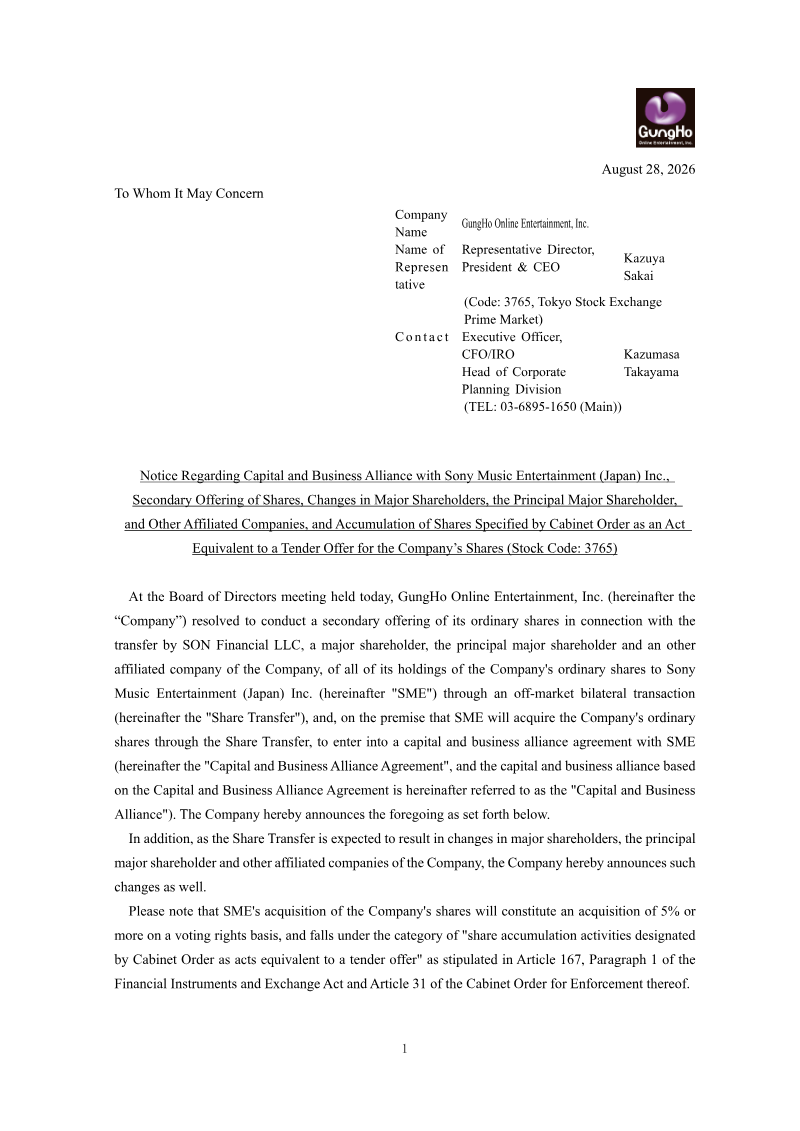
GungHo Online Entertainment, Inc. has entered into a strategic capital and business alliance with Sony Music Entertainment (Japan) Inc. (SME).
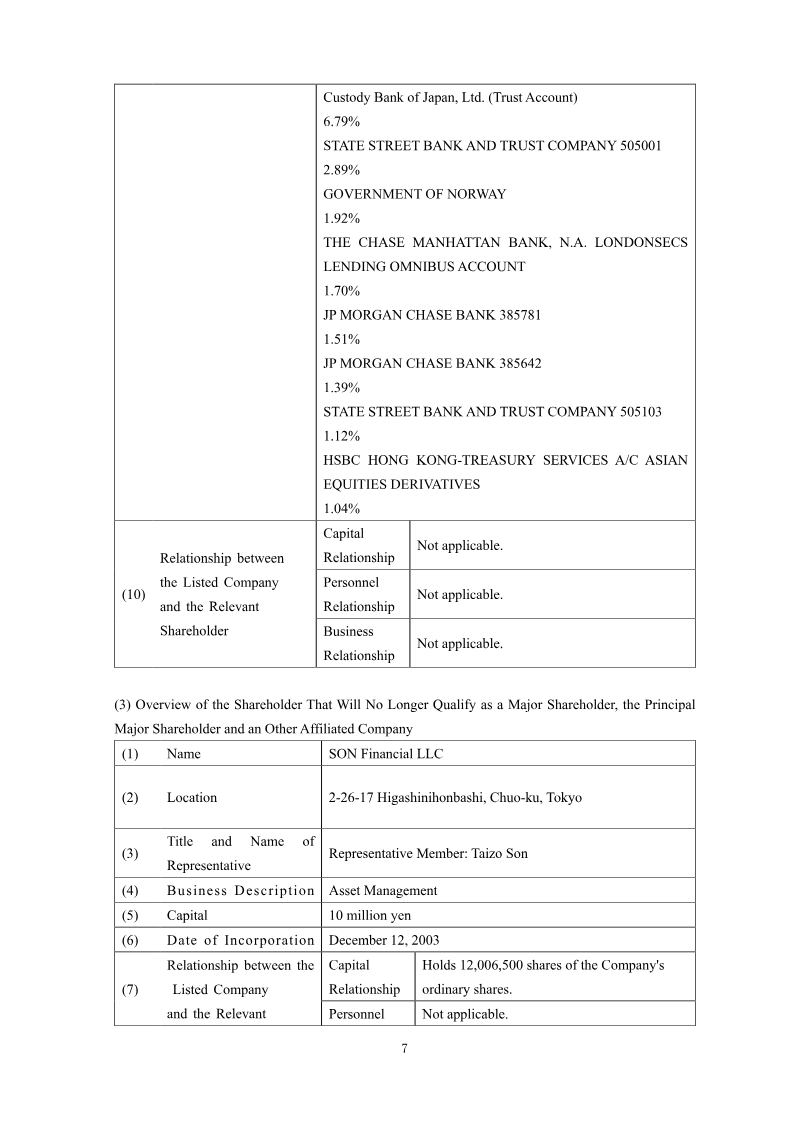
- Sony Music Entertainment (Japan) Inc. (SME) will acquire a 22.93% stake in GungHo Online Entertainment, representing 23.29% of total voting rights, through an off-market transaction with SON Financial LLC.
- The share transfer is scheduled for completion on December 30, 2026, making SME and Sony Group Corporation major shareholders and affiliated companies of GungHo.
- The partnership focuses on the joint development and operation of smartphone, console, and PC games, alongside the integration of the SME Group’s content portfolio into new projects.
Notice Regarding the Termination of the Capital and Business Alliance
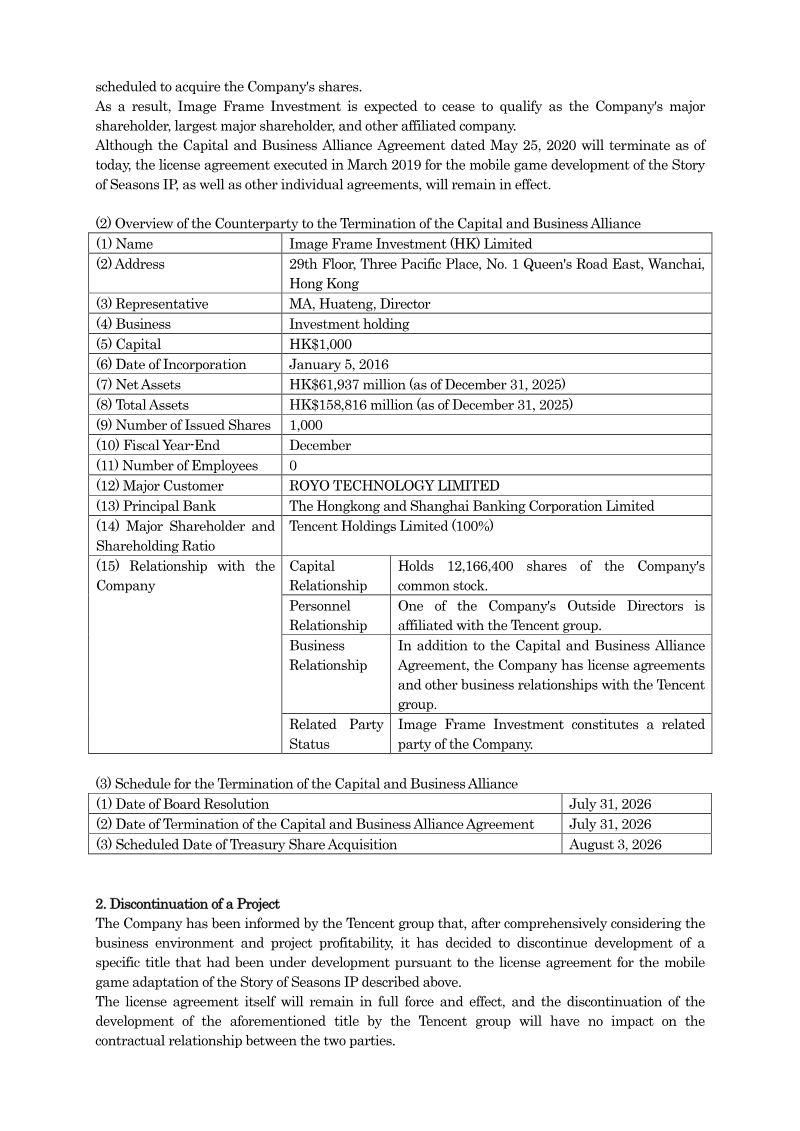
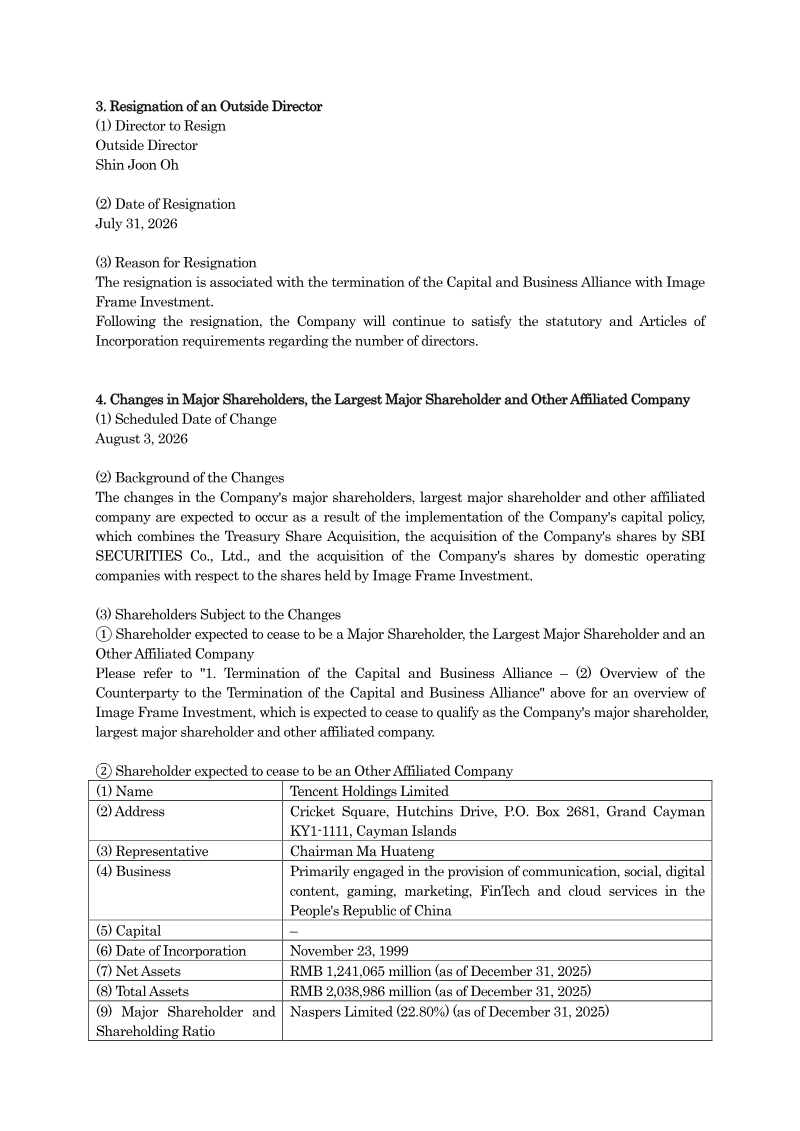
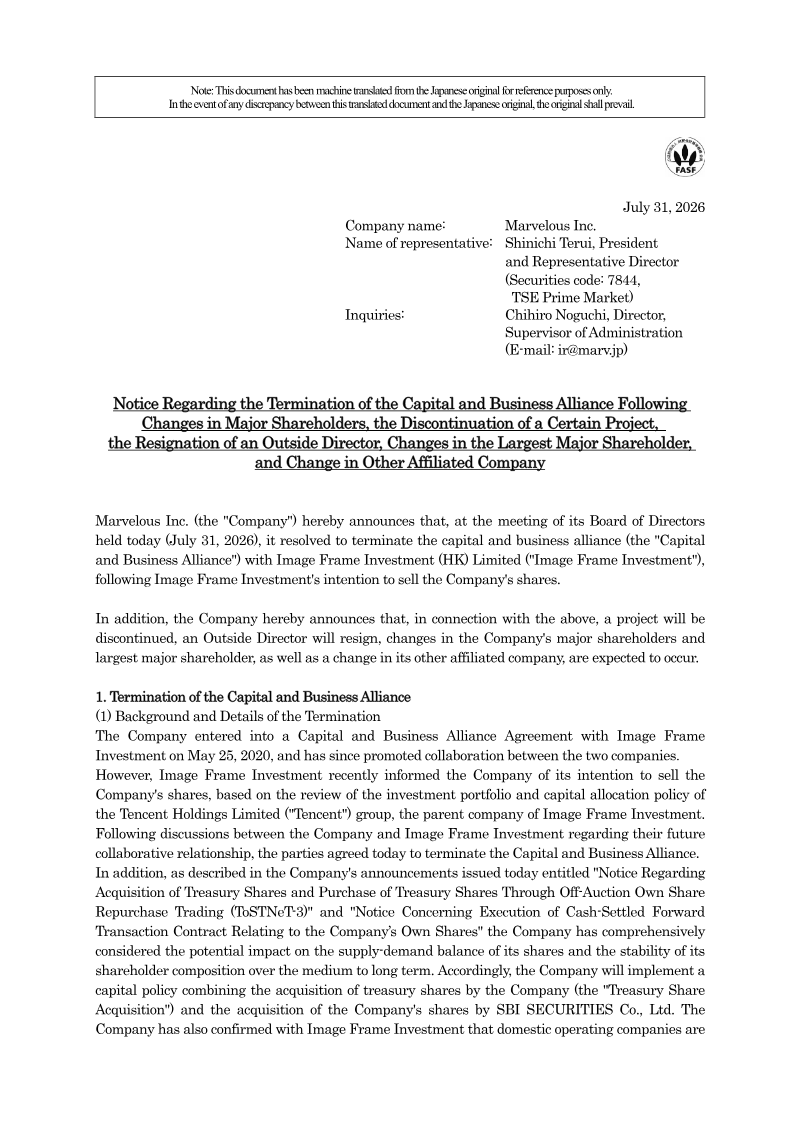
Marvelous Inc. has formally resolved to terminate its capital and business alliance with Image Frame Investment (HK) Limited, a subsidiary of Tencent Holdings Limited, effective July 31, 2026.
- Marvelous Inc. will terminate its capital and business alliance with Tencent subsidiary Image Frame Investment (HK) Limited, effective July 31, 2026.
- Tencent is divesting its shareholding in Marvelous Inc., resulting in the loss of its status as the company's largest major shareholder and an affiliated company.
- The partnership dissolution includes the cancellation of a specific mobile game project under development, though existing license agreements for the Story of Seasons IP remain in effect.