GDev
Game Co.16 documents
Documents
Financial3 pages
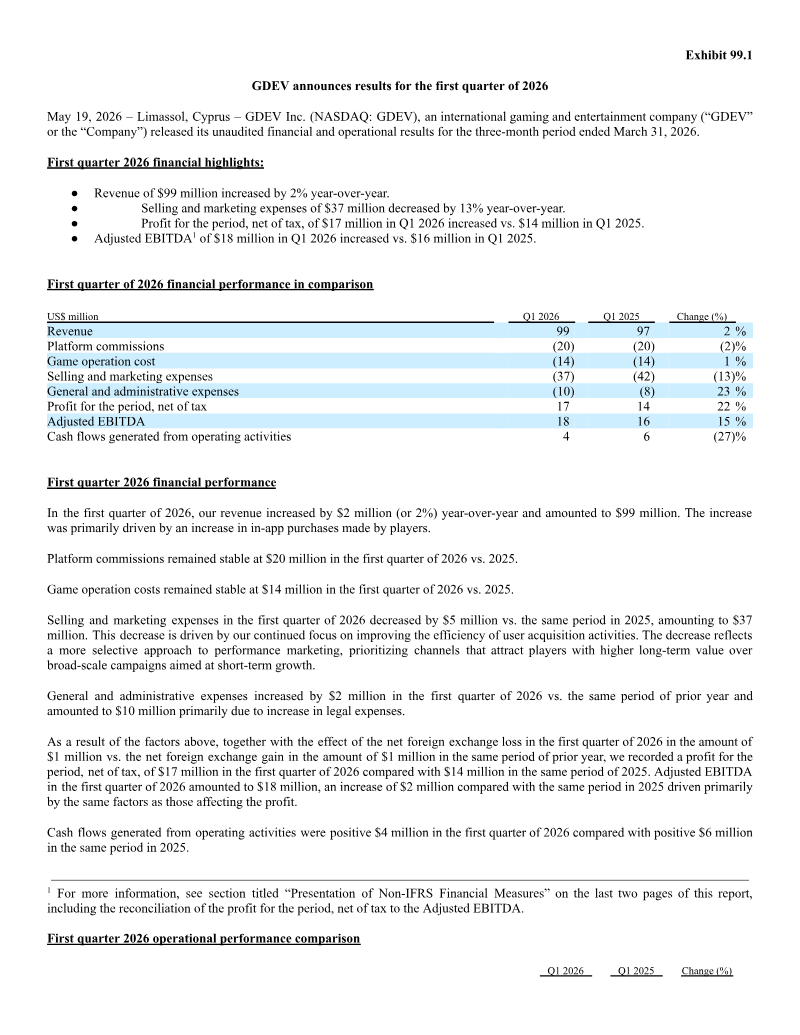
GDEV Results for the First Quarter of 2026
GDEV Inc. reported its financial and operational results for the first quarter of 2026, demonstrating growth in profitability and revenue despite a shift in user engagement metrics. The company generated $99 million in revenue, a 2% year-over-year increase, primarily driven by higher in-app purchases. Net profit rose to $17 million from $14 million in the same period of 2025, while Adjusted EBITDA grew to $18 million from $16 million.
Operational data reveals a strategic pivot in user acquisition and platform focus. While the Monthly Paying Users (MPU) count declined by 5% to 269,000, the Average Bookings Per Paying User (ABPPU) increased by 8% to $97, indicating a successful shift toward higher-value players. This transition was supported by a 13% reduction in selling and marketing expenses, reflecting a more selective approach to performance marketing. Geographically, the company saw a decline in bookings from the United States and Asia, which was offset by growth in Europe and other regions. Additionally, the mobile platform’s share of total bookings expanded to 64%, up from 59% in the prior year.
The company maintains a stable cost structure, with platform commissions and game operation costs remaining consistent with 2025 levels. Although cash flows from operating activities decreased from $6 million to $4 million, the overall financial performance reflects a focus on long-term value and operational efficiency. These results underscore the company's ongoing efforts to optimize its franchise portfolio across global markets while managing administrative expenses, which rose slightly due to increased legal costs.
- GDEV Inc. reported Q1 2026 revenue of $99 million, a 2% year-over-year increase, with net profit rising to $17 million from $14 million in 2025.
- The company successfully pivoted toward higher-value players, as evidenced by an 8% increase in Average Bookings Per Paying User (ABPPU) to $97, despite a 5% decline in Monthly Paying Users (MPU) to 269,000.
- Operational efficiency improved through a 13% reduction in selling and marketing expenses, reflecting a more selective approach to performance marketing.
- Mobile platform dominance grew, with mobile bookings accounting for 64% of total revenue compared to 59% in the prior year.
- Geographic performance was mixed, as growth in Europe and other regions offset declines in bookings from the United States and Asia.
+1
GDev

Report4 pages
Is There a Shift from Content to Tech Startups Among Gaming VCs?
The analysis examines venture capital activity in the gaming sector from 2020 to early 2024, focusing on whether investment priorities are shifting from traditional content creation and publishing toward technology‑driven startups. Data show that, across all stages, content creators and publishers continue to dominate VC allocations, representing over half of both capital deployed (≈$1.76 billion) and the number of deals in early‑, mid‑, and late‑stage rounds. However, a closer look at seed and Series A financing reveals a notable trend: PC and console studios now secure more funding than mobile startups, indicating a pivot toward higher‑budget, platform‑centric projects.
In the last twelve months, gaming‑focused VC funds have increased their exposure to technology and platform companies. Capital deployed by select funds such as VENTURES, BEHOLD Venture, and Lightspeed Lvp. rose from roughly $1.3 billion in early 2020 to over $2.4 billion by H1 2024, while the number of rounds led by these funds grew from 67 to 289. This shift is evident across multiple funds, with several moving a larger share of their capital into tech‑centric ventures rather than pure content studios.
Geographically, the data encompass global markets with a concentration in North America and Europe, covering all major gaming segments—mobile, PC, console, and emerging platform technologies. The methodology aggregates publicly disclosed VC‑led rounds from 2020 through H1 2024, using capital deployed and round counts as primary metrics. The findings suggest that while content remains the core focus, gaming VCs are progressively allocating more resources to technology and platform innovations, reflecting an evolving investment landscape in the industry.
- Content creators and publishers remain the primary focus of gaming VC, accounting for over half of all capital deployed (approximately $1.76 billion) and the majority of deal volume across all stages.
- Gaming-focused VC funds, including VENTURES, BEHOLD Venture, and Lightspeed Lvp., significantly increased their activity between 2020 and H1 2024, with capital deployed rising from $1.3 billion to over $2.4 billion.
- The number of VC-led funding rounds grew substantially from 67 in early 2020 to 289 by H1 2024, reflecting an overall increase in investment activity.
- While content dominates total funding, there is a clear strategic pivot among VCs toward technology and platform-centric startups, particularly within seed and Series A financing.
- Within the content sector, investment is shifting toward higher-budget, platform-centric projects, as evidenced by PC and console studios now securing more funding than mobile startups.
+3
InvestGame

Report8 pages
The Take-Two Diaspora: Why Alumni Win Big in Mobile, Not AAA
The analysis examines the investment trajectory of companies founded by former senior executives from Take‑Two Interactive and its subsidiaries. From 2020 to the present, alumni have launched 23 startups that collectively attracted $1.2 billion in capital across 43 deals, with the most substantial transaction being Dream Games’ $2.5 billion sale in July 2025. The portfolio spans mobile casual titles, instant‑play games, sports apps, and publishing ventures, but shows a pronounced skew toward mobile platforms rather than AAA titles.
Key financial metrics reveal that alumni‑led firms secured an average early‑stage check of $12 million, with mobile projects commanding the largest median ($22.6 million) and multiplatform deals following closely. In 2021–2022, the cohort’s subsequent‑round funding rate was nearly four times the industry average, and 60 % of companies raised a second round within a year versus 20 % for comparable VC‑backed gaming startups. The most active investors include Dream Ventures, Balderton Capital, and LORIC, each contributing between $40 million and $575 million across multiple alumni deals.
Geographically the activity is concentrated in North America, with notable studios such as Dream Games (San Francisco), Build a Rocket Boy (London), and Spyke Games (Los Angeles). The time frame covers 2020–2025, covering both pre‑pandemic and post‑pandemic market dynamics. Methodologically, the study aggregates venture, corporate, and strategic investment data from public filings, press releases, and proprietary databases, focusing on firms whose founders held senior roles at Take‑Two or its subsidiaries. The findings underscore a robust pipeline of mobile‑centric startups emerging from the Take‑Two alumni network, delivering high valuation exits and rapid follow‑on funding relative to broader gaming benchmarks.
- Former Take-Two senior executives founded 23 startups between 2020 and 2025, securing $1.2 billion in capital across 43 deals.
- Dream Games, a prominent alumni-led studio, achieved a $2.5 billion exit in July 2025, highlighting the high valuation potential of these ventures.
- Alumni-led firms significantly outperform industry benchmarks, with a 60% rate of raising a second funding round within one year compared to the 20% industry average.
- Investment is heavily skewed toward mobile platforms, which command the highest median early-stage funding at $22.6 million per deal.
- Between 2021 and 2022, the alumni cohort secured subsequent-round funding at nearly four times the rate of comparable VC-backed gaming startups.
+2
InvestGame

Report9 pages
Beyond the Game: How Gamification is Becoming Mainstream
The analysis examines how gamification—applying game‑like mechanics such as streaks, leaderboards, and reward loops—to non‑gaming consumer apps has shifted the mobile app economy over a five‑year period (2020‑2025). Data from 208 transactions totaling $20.7 billion reveal that EdTech, Fitness & Wellness, and Entertainment & Social are the primary verticals, with deal value shares of roughly 40 %, 37 %, and 23 % respectively. EdTech dominates both deal volume (43 %) and exit activity, accounting for 45 % of exits and 34 % of exit value, indicating a mature market attractive to strategic buyers. Fitness & Wellness shows concentrated exits in two mega‑deals (Headspace $3 billion, Fitbit $2.1 billion) but a broader spread of capital across many platforms, suggesting growth potential beyond the top brands. Entertainment & Social receives steady, diversified investment; its exits lean toward IPOs (e.g., Reddit, NetEase Cloud Music) rather than M&A, reflecting limited strategic buyer appetite.
Capital flows peaked during the 2020‑21 COVID boom but recovered quickly for gamified apps, with 2024 stabilizing and 2025 YTD already surpassing full‑year 2024 figures. Seed and Series A rounds remain active, while late‑stage activity accelerated in 2025 following earlier Series A momentum. Early‑stage capital is evenly split between Fitness & Wellness and Entertainment & Social, highlighting a white‑space opportunity, whereas EdTech shows limited early‑stage activity due to market consolidation.
The report underscores that non‑gaming apps have overtaken mobile games in net revenue (Q2 '25: $21.2 billion vs. $19.8 billion) and are driving 24 % YoY mobile spend growth, while games stagnated. This structural shift signals that institutional capital increasingly targets gamified consumer apps across these three verticals, with strategic buyers actively consolidating the EdTech segment and exploring IPO pathways in Entertainment & Social.
- Gamified non-gaming apps have surpassed mobile games in net revenue, generating $21.2 billion in Q2 2025 compared to $19.8 billion for games.
- Gamified apps are driving a 24% year-over-year growth in mobile consumer spending, while traditional mobile gaming revenue has stagnated.
- EdTech, Fitness & Wellness, and Entertainment & Social account for $20.7 billion in transaction value, with EdTech dominating deal volume (43%) and exit activity (45%).
- Capital flow for gamified apps has recovered from the post-2021 decline, with 2025 year-to-date investment already exceeding the total figures for 2024.
- Fitness & Wellness shows high growth potential with capital spread across many platforms, despite being anchored by mega-deals like the $3 billion Headspace and $2.1 billion Fitbit acquisitions.
+2
InvestGame

Report9 pages
Where the UGC Dollars Flow: Mapping $9B Investments in Creator Economy
The analysis maps a $9 billion investment wave in user‑generated content (UGC) gaming from 2020 to 2025, covering roughly 80 companies and titles. Early‑stage rounds (pre‑seed to Series A) account for $0.5 billion, while late‑stage and corporate deals bring the total to $8.9 billion, including major platform names such as Roblox, Epic Games (Fortnite), Linden Lab, and Sandbox. Corporate venture capital and strategic investors contribute $3.5 billion, with notable commitments from Sony/Kirkbi ($2 billion in 2022) and Disney ($1.5 billion in 2024). Modding ecosystems—overwolf, mod.io, CurseForge—receive $0.4 billion in VC or M&A activity.
The report tracks engagement metrics, noting Roblox’s 73.5 billion logged hours in 2024 and a peak concurrent user base of 21 million, while Fortnite Creative stabilizes around 1.3 million concurrent users. Creator payouts have risen sharply, with Roblox and Fortnite together disbursing approximately $1.5 billion to developers in 2024, and quarterly earnings showing a 38 % increase from Q2 23 to Q3 23.
Funding follows a classic hype cycle: an initial surge during Roblox’s IPO and metaverse buzz (2020‑21), a pullback in 2022, and renewed strategic investment from incumbents in 2023‑24. Early‑stage rounds remain steady, averaging 12–15 deals per year, targeting “next Roblox/Fortnite” platforms and infrastructure. The largest early‑stage investments include $50 million raised by YAHAHA in 2020 and multiple $15–40 million Series A rounds for platforms such as ZAllbaba, Manticore, and Lighforge.
Overall, the data illustrate a mature UGC ecosystem that has evolved from hobbyist modding to professionalized creator economies, with sustained capital inflows and growing monetization pathways for both platforms and individual creators.
- The UGC gaming sector attracted $9 billion in total investment between 2020 and 2025, with $8.9 billion concentrated in late-stage and corporate deals.
- Strategic investment from industry incumbents is a primary driver, highlighted by Sony/Kirkbi’s $2 billion commitment in 2022 and Disney’s $1.5 billion investment in 2024.
- Creator monetization is scaling rapidly, with Roblox and Fortnite collectively disbursing approximately $1.5 billion to developers in 2024 and reporting a 38% quarterly earnings increase between Q2 and Q3 2023.
- Roblox remains the dominant platform with 73.5 billion logged hours in 2024 and 21 million peak concurrent users, while Fortnite Creative maintains a stable base of 1.3 million concurrent users.
- Early-stage funding remains consistent at 12–15 deals per year, focusing on infrastructure and platforms attempting to replicate the success of established leaders like Roblox and Fortnite.
+3
InvestGame
Article
Form 20-F: Fiscal Year 2025
REE Automotive Ltd., an Israeli‑incorporated electric‑vehicle technology firm, filed its 2025 Form 20‑F under U.S. GAAP to disclose a year marked by continued losses, liquidity constraints and strategic uncertainty. The company reported a net loss of $55.8 million on revenues of only $1.3 billion, a sharp decline from the $111.8 million loss in 2024. Operating expenses exceeded $90 million, driven by high R&D and SG&A costs that were partially offset by a 24% reduction in SG&A. A $15.9 million inventory write‑down and a $24.3 million long‑lived asset impairment further eroded profitability, while cash reserves fell to $14.2 million against an expiring $18 million credit facility, leaving a runway that may end mid‑2026 without additional financing or revenue growth.
The firm’s capital structure is heavily weighted toward convertible notes and warrants, with Level 3 fair‑value liabilities totaling $1.12 million in derivatives and $2.68 million in warrants, reflecting significant fair‑value volatility. Management has raised equity through multiple public and private placements—$44.9 million in September 2024, $27.1 million in March 2025—yet still faces substantial going‑concern doubts.
Strategic risks are concentrated in supply‑chain disruptions, tariff uncertainty, and the unproven “software‑defined vehicle” (SDV) business model. Production of the P7 truck line was paused in May 2025, and future revenue hinges on securing design wins, regulatory approvals, and OEM licensing agreements. The company’s dual‑class share structure concentrates voting power with founders, potentially limiting shareholder influence.
Geographically, REE operates primarily in North America and Europe, with revenue concentrated in Germany (≈$801 k) and Japan (≈$408 k), while U.S. sales are minimal. The firm’s exposure to Israeli geopolitical instability, U.S. tax implications under Section 7874 and potential PFIC status adds further complexity to its financial outlook. Overall, REE remains in a precarious position, requiring immediate capital infusion and successful execution of its SDV strategy to avoid default or delisting.
- REE Automotive faces a critical liquidity crisis with only $14.2 million in cash reserves against an expiring $18 million credit facility, creating a runway that may exhaust by mid-2026.
- The company reported a $55.8 million net loss for fiscal year 2025, compounded by a $15.9 million inventory write-down and a $24.3 million long-lived asset impairment.
- Operational viability is under significant pressure following the May 2025 production pause of the P7 truck line and the company's reliance on an unproven software-defined vehicle (SDV) business model.
- Despite raising $72 million through equity placements between September 2024 and March 2025, the firm continues to face substantial going-concern doubts and potential delisting risks.
- Operating expenses remain high at over $90 million, though the company achieved a 24% reduction in SG&A costs during the fiscal year.
GDevMay 2026

Financial1 pages
Annual Report on Form 20-F: Fiscal Year 2024
SEC 20-F filing for GDEV, filed 2025-05-15.
- REE reported a net loss of $111.8 million in 2024, following a $114.2 million net loss in 2023. As of December 31, 2024, cash and cash equivalents were $72.3 million, including $18 million from a credit facility.
- The independent registered public accounting firm expressed substantial doubt about REE's ability to fund its obligations for the next twelve months, indicating a going concern risk.
- Achieving 'design wins' with OEM customers does not guarantee revenue, as contracts typically do not specify purchase quantities or prices, and sales can be impacted by vehicle model success, OEM decisions, or pricing pressures.
- REE's products, including its X-by-Wire software control technology and REEcorner® system, are designed for features like low TCO, quick REEcorner® swaps, preventative maintenance, and autonomous driving readiness.
- Rajesh Goel joined REE's board of directors on November 15, 2024, bringing experience from various board positions, including Motherson International Limited and Honda Cars India Ltd.
+1
GDevMay 2025

Financial11 pages
Q3 2024 Financial Results
The financial results for the third quarter of 2024 reveal a period of stabilization and shifting cost structures within the gaming portfolio. Revenue for the quarter reached $111 million, reflecting a 5% increase from the previous quarter but an 8% decline compared to the same period in 2023. Profitability showed significant recovery from a net loss of $3 million in the first quarter of 2024 to a profit of $15 million in the third quarter, while Adjusted EBITDA remained steady at $16 million.
Operating metrics indicate a transition in user engagement and monetization. Monthly Paying Users (MPUs) grew to 381,000, a 21% increase year-over-year, though Average Bookings Per Paying User (ABPPU) declined by 11% to $92. Total bookings for the quarter stood at $108 million, showing a 6% year-over-year decrease but remaining relatively flat compared to the first half of 2024. The geographic distribution of revenue remains concentrated in the United States at 53%, followed by Europe at 22% and Asia at 14%.
The product portfolio is led by the Hero Wars franchise, with Hero Wars: Alliance and Hero Wars: Dominion Era accounting for 37% and 34% of revenue, respectively. Island Hoppers has emerged as a significant contributor, growing its revenue share from 4% in Q3 2023 to 7% in Q3 2024. Platform distribution remains dominated by mobile at 62%, with PC contributing 38%. Cost management efforts are evident in the reduction of total costs and expenses (excluding depreciation and amortization) to $94 million, down 13% from the prior year, driven largely by a decrease in selling and marketing expenses which now represent 25% of the cost base.
- The company achieved a $15 million profit in Q3 2024, marking a significant recovery from the $3 million net loss recorded in Q1 2024.
- Total revenue reached $111 million, representing a 5% increase over the previous quarter but an 8% decline compared to Q3 2023.
- Monthly Paying Users (MPUs) grew 21% year-over-year to 381,000, though Average Bookings Per Paying User (ABPPU) dropped 11% to $92.
- Operating costs were reduced to $94 million, a 13% year-over-year decrease driven primarily by lower selling and marketing expenses.
- The Hero Wars franchise remains the primary revenue driver, with Hero Wars: Alliance and Hero Wars: Dominion Era accounting for 37% and 34% of total revenue, respectively.
GDevNov 2024
Financial12 pages
Q2 2024 Financial Results
The second quarter 2024 financial results for the organization reveal a period of strategic transition characterized by a slight decline in revenue alongside a significant recovery in profitability. Revenue for the quarter reached $106 million, representing an 8% year-over-year decrease. However, the company reported a net profit of $15 million, a substantial improvement from the $1 million loss recorded in the first quarter of 2024. Adjusted EBITDA followed a similar trajectory, rising to $16 million in the second quarter after a negative $3 million result in the previous period.
Operating metrics indicate a stabilizing user base with 381,000 monthly paying users, consistent with the first quarter but down from 392,000 in the prior year. Average bookings per paying user stood at $88, reflecting a 6% year-over-year decline. The company’s portfolio remains heavily reliant on the Hero Wars franchise, with Hero Wars: Alliance and Hero Wars: Dominion Era accounting for a combined 89% of revenue. Geographically, the United States remains the primary market at 51% of revenue, followed by Europe at 22% and Asia at 15%.
Strategic highlights for the period include the successful launch of Pixel Gun 3D on PC via Steam, which recouped development costs on its first day without dedicated marketing spend. Additionally, a high-profile collaboration between Hero Wars and the Tomb Raider brand drove a 25% year-over-year increase in new payers during the month of the campaign. While mobile remains the dominant platform at 58% of revenue, the PC segment grew to 42%, up from 38% in the same period last year, signaling a successful push toward platform diversification. These unaudited results suggest that while top-line growth remains pressured, disciplined cost management and brand collaborations are effectively supporting the bottom line.
- The company achieved a net profit of $15 million in Q2 2024, a significant turnaround from the $1 million loss reported in the previous quarter.
- Revenue reached $106 million, representing an 8% year-over-year decline, while adjusted EBITDA improved to $16 million from a negative $3 million in Q1 2024.
- The Hero Wars franchise remains the primary revenue driver, accounting for 89% of total earnings across its Alliance and Dominion Era titles.
- Platform diversification is progressing, with the PC segment growing to 42% of total revenue, up from 38% in the same period last year.
- A collaboration between Hero Wars and the Tomb Raider brand successfully increased new payers by 25% year-over-year during the campaign month.
GDevSept 2024

Financial1 pages
Annual Report: 20-F 2023
SEC 20-F filing for GDEV, filed 2024-03-27.
- REE's dual-class capital structure makes it ineligible for inclusion in certain stock indices like the Russell 2000 and the S&P Composite 1500, potentially depressing its valuation compared to other similar companies.
- REE's production strategy focuses on building to order to maximize capital efficiency and align with its order book for successful scaling to mass production.
- REE aims to lower customer acquisition costs by leveraging its dealer network for after-sales parts and service, and offers financing solutions for dealers through an agreement with Mitsubishi HC Capital America.
- Research and development expenses, which include costs for engineering staff, third-party consultants, and development projects, are expected to increase as REE continues to develop its products and technology.
- Selling, general, and administrative expenses are anticipated to rise with increased overall activity levels once REE begins mass production.
GDevMar 2024
Financial11 pages
FY and 4Q 2023 Financial Results
GDEV’s financial and operational performance for the fourth quarter and full fiscal year of 2023 reveals a period of strategic transition characterized by improved profitability despite declining year-over-year revenues. The company reported a full-year profit of $46 million, a significant recovery from the $7 million reported in 2022. However, fourth-quarter revenue fell 19% year-over-year to $109 million, and full-year revenue declined from $480 million to $465 million. This shift in the bottom line was supported by a reduction in total costs and expenses, which dropped from $454 million in 2022 to $420 million in 2023.
Operational metrics show a mixed engagement landscape. Monthly Paying Users (MPUs) grew to 359,000 in the fourth quarter of 2023, up 14% from the previous year, yet Average Bookings Per Paying User (ABPPU) decreased by 18% to $92. Total bookings for the quarter reached $106 million, representing a 4% year-over-year increase. The company’s portfolio remains heavily reliant on the Hero Wars franchise, with Hero Wars: Alliance and Hero Wars: Dominion Era accounting for a combined 89% of bookings. Geographically, the United States remains the primary market at 34% of bookings, followed by Europe at 27% and Asia at 24%.
The financial position as of December 31, 2023, shows total assets of $321 million and a cash balance of $72 million. While the company generated $18 million in net cash from operating activities during the year, this was a sharp decline from the $116 million generated in 2022, largely due to changes in deferred revenue and platform commissions. The methodology for these results relies on IFRS financial statements supplemented by non-IFRS measures like Adjusted EBITDA, which totaled $43 million for the full year, to provide a clearer view of core operating performance by excluding non-cash impairments and one-time charges.
- GDEV achieved a full-year profit of $46 million in 2023, a significant recovery from $7 million in 2022, driven by a reduction in total costs from $454 million to $420 million.
- Full-year revenue declined to $465 million from $480 million, with fourth-quarter revenue falling 19% year-over-year to $109 million.
- The company remains highly concentrated on the Hero Wars franchise, which accounted for 89% of total bookings in the fourth quarter of 2023.
- Monthly Paying Users (MPUs) increased 14% year-over-year to 359,000 in Q4 2023, though Average Bookings Per Paying User (ABPPU) dropped 18% to $92.
- Net cash from operating activities fell sharply to $18 million in 2023, down from $116 million in 2022, due to shifts in platform commissions and deferred revenue.
GDevMar 2024
Financial7 pages
AI’s Ever‑Growing Presence in Gaming: $1.8B in VC Investments
The analysis tracks venture‑capital financing of AI‑driven gaming startups from 2020 through 2024, quantifying how artificial‑intelligence tools have reshaped investment patterns across three verticals: in‑game content generation, development‑infrastructure platforms, and ancillary AI applications such as marketing, analytics and community management. By filtering for companies that received external VC funding and excluding studios that merely use AI internally, the study aggregates deal counts and monetary values from public financing announcements, creating a comprehensive view of market dynamics over a five‑year horizon.
Across the period, investors allocated roughly $1.8 billion to AI‑focused gaming ventures, with $1.2 billion directed toward content‑generation tools, $0.4 billion to infrastructure solutions, and $0.2 billion to other AI‑enabled services. Deal activity accelerated markedly, rising from 35 transactions in 2020 to 73 in 2024, and the total deal value expanded at an estimated compound annual growth rate of 35 percent between 2022 and 2024. By the end of 2024, AI‑centric startups accounted for about 65 percent of all gaming‑related VC deals, indicating a strategic shift from broad platform bets toward specialized, scalable AI tooling.
The largest financing rounds highlight the sector’s appetite for high‑impact content generators: stability.ai secured a $101 million seed round in October 2022, Parametrix.ai raised $100 million in a Series B the following month, and Pika closed an $80 million Series B in June 2024. Andreessen Horowitz emerged as the most active investor, participating in 20 deals worth $233 million, followed by BITKRAFT with 12 deals totaling $177 million and Y Combinator with eight deals for $23 million. Early‑stage rounds dominate the landscape; although the average check size tripled from 2020 to 2024, the majority of investments—124 deals—
- Venture capital investment in AI-driven gaming startups reached $1.8 billion between 2020 and 2024, with $1.2 billion specifically allocated to content-generation tools.
- AI-centric startups captured 65% of all gaming-related VC deals by the end of 2024, marking a strategic pivot toward specialized, scalable AI infrastructure and tooling.
- Deal activity in the sector doubled from 35 transactions in 2020 to 73 in 2024, with total deal value growing at a 35% compound annual growth rate between 2022 and 2024.
- Andreessen Horowitz is the most active investor in the space, participating in 20 deals totaling $233 million, followed by BITKRAFT with 12 deals worth $177 million.
- High-impact content generation remains the primary driver of capital, evidenced by major rounds such as Stability.ai’s $101 million seed round, Parametrix.ai’s $100 million Series B, and Pika’s $80 million Series B.
+1
GDevJan 2024