Usa

48 documents·26 publishers

Documents

Page 1
Report16 pages

The State of Games Media Buying United States Spotlight

The United States mobile gaming market maintained its position as a global leader in advertising activity during the first half of 2024. While the region ranks first globally in the total volume of app advertisers, it holds the second position for ad impressions, trailing only Southeast Asia. Despite this high ranking, the market shows signs of maturation and consolidation. The number of active advertisers grew by a marginal 0.25% year-over-year, while the proportion of new advertisers entering the space saw a significant decline of 29%. Similarly, while total ad purchases increased slightly by 0.46%, the volume of new ad creatives decreased by 12%, suggesting a shift toward established players and proven assets.

Shifts in genre performance and creative strategy define the current landscape. Puzzle games have overtaken Match games to claim the top spot in ad impression rankings, while the Sports and Shooting genres experienced the most rapid growth, rising six and four places respectively. Conversely, Hypercasual games saw a decline in impression share. Video ads remain the dominant creative format across all major genres, particularly in the Match category where they account for 87% of the ad mix. Playable ads remain a niche but specialized tool, utilized in 13% of Hypercasual campaigns compared to just 1% for Role-Playing Games.

Campaign longevity varies significantly by genre, reflecting different monetization and retention strategies. Sports games feature the most enduring campaigns, averaging 47 days, whereas Role-Playing Game campaigns typically run for only 23.6 days. To navigate this competitive environment, publishers are increasingly moving away from pure Hypercasual models toward Hybrid-casual structures, utilizing intelligent bidding and Target ROAS strategies to balance user acquisition costs with long-term profitability. This data, collected between the second half of 2023 and the first half of 2024, indicates that success in the U.S. market now requires a data-driven approach focused on retention and optimized media buying across both major platforms and programmatic SDK networks.

  • The U.S. mobile gaming ad market is maturing, evidenced by a marginal 0.25% growth in active advertisers and a 29% decline in new market entrants during the first half of 2024.
  • Publishers are prioritizing established assets over experimentation, as total ad purchases grew by only 0.46% while the volume of new ad creatives dropped by 12%.
  • Genre dominance is shifting, with Puzzle games now leading in ad impressions, while Sports and Shooting genres saw the fastest growth, rising six and four places respectively.
  • Video ads remain the primary creative format, accounting for 87% of the ad mix in the Match genre, while playable ads remain a niche strategy used in only 13% of Hypercasual campaigns.
  • Campaign longevity is highly genre-dependent, ranging from an average of 47 days for Sports games to just 23.6 days for Role-Playing Games.
+2
MintegralJan 2024
Page 1
Report17 pages

Essential Facts About the U.S. Video Game Industry

The U.S. video game industry has evolved into a mainstream, multigenerational pastime that encompasses 190.6 million weekly players. Findings indicate that 61% of the American population plays at least one hour of video games per week. The demographic profile of the average player has shifted significantly over the last two decades; the average age is now 36, compared to 29 in 2004. This aging player base has fostered a strong culture of family gaming, with 83% of gaming parents playing alongside their children to strengthen bonds and improve communication.

Technological advancements have fundamentally altered how and where Americans engage with games. Mobile devices are now the primary platform, used by 78% of players, a dramatic increase from 33% in 2012. Furthermore, the rise of internet connectivity has transformed gaming into a social hub, with 88% of players engaging in online gameplay and 72% agreeing that video games create a sense of community. Beyond entertainment, players report significant mental health and cognitive benefits, with over 75% of adults agreeing that games provide stress relief, mental stimulation, and joy.

Economically, the industry remains a powerhouse, contributing nearly $66 billion to the U.S. GDP in 2023 and supporting over $101 billion in total economic impact. Total consumer spending reached $57.2 billion during the same period. The data, gathered by YouGov via a survey of 5,000 respondents and supplemented by qualitative ethnography, highlights that 63% of players view video games as providing the highest value for their money compared to other entertainment media. This comprehensive look at the 2023-2024 landscape confirms that video games are an inclusive, essential component of American social and economic life.

  • The U.S. video game industry contributed nearly $66 billion to the GDP in 2023, with total consumer spending reaching $57.2 billion.
  • Video games are a mainstream activity in the U.S., with 190.6 million weekly players representing 61% of the total population.
  • Mobile devices have become the dominant gaming platform, utilized by 78% of players compared to only 33% in 2012.
  • The average age of a U.S. gamer has risen to 36 years old, up from 29 in 2004, driving a trend where 83% of gaming parents play with their children.
  • Gaming is a primary social outlet, with 88% of players engaging in online play and 72% reporting that games foster a sense of community.
Entertainment Software AssociationJan 2024
Page 1
Report36 pages

Mobile Games: State of the Market & Playtime Q3 2023

Mobile games: state of the market & playtime Joint report of Apptica & Gamelight The purpose of this study is to analyse the state of gaming category in Q3 2023. All data presented in this report has been collected from Apptica and Gamelight platforms. "Games" category is defined by a store's tag. The basis of this analysis is made up of data from the Apptica's Store, Ad and Market Intelligence sections and Gamelight's playtime and app usage data.

  • iOS remains the dominant platform for mobile gaming revenue, accounting for 56.01% of the total global share compared to 43.99% for Android.
  • The United States and Japan are the leading revenue generators among major markets, contributing $2.92 billion and $2.03 billion respectively, with the six analyzed countries accounting for 59% of global gaming revenue.
  • South Korea experienced the highest growth in game installs at 32% compared to Q3 2022, while the United States and France saw declines of 5% and 0.7%, respectively.
  • Card games are the most engaging genre globally with an average playtime of 41.68 minutes, consistently ranking as the top genre for user engagement across analyzed regions.
  • Average daily playtime is higher on iOS (38.69 minutes) than on Android (32.17 minutes) across the studied markets.
+6
AppticaJan 2023
Page 1
Report14 pages

State of Mobile Games: Cognitive and Psychological Benefits

The report investigates how mobile games influence cognitive and psychological well‑being, drawing on a large U.S. sample of 483 participants (252 men, 213 women, 18 non‑binary) and a series of 28 individual game studies. Personality was measured with the Big 5 inventory, while gaming habits included frequency, genre preference and primary motivations. The study found that personality traits significantly moderate game effects: extraverts gravitate toward social and action games, while introverts prefer relaxation‑oriented titles; openness predicts immersion and inspiration motives.

Mood impact was quantified using Cohen’s d effect sizes for pre‑ to post‑play changes. Several games produced moderate to large positive effects on focus (e.g., Sound Sky, d = 0.90), creativity (Colorize, d = 1.17), determination (Nature Video, d = 0.76) and calmness (Color Breathing, d = 0.61). Puzzle‑centric titles consistently boosted creativity and curiosity, whereas timed or competitive games enhanced focus and grit. Non‑game controls such as a dripping faucet video yielded negative mood shifts, underscoring the relative benefit of game interventions.

The findings suggest that mobile games can serve as low‑cost, scalable tools for improving mental well‑being, particularly when game design incorporates personalization to match diverse personality profiles. Recommendations target developers (to broaden appeal through adjustable difficulty and genre alignment), players (to select games aligned with desired emotional outcomes), and health professionals (to consider mobile gaming as adjunct therapy for mood disorders or attention deficits). The report calls for future research incorporating real‑time behavioral metrics to refine these insights.

  • Mobile games function as effective, scalable tools for mental well-being, with specific titles demonstrating significant positive effects on creativity (Colorize, d=1.17), focus (Sound Sky, d=0.90), determination (Nature Video, d=0.76), and calmness (Color Breathing, d=0.61).
  • Personality traits significantly dictate user engagement, as extraverts favor social and action-oriented games while introverts prefer relaxation-focused titles, and openness correlates with immersion and inspiration motives.
  • Game mechanics directly influence psychological outcomes: puzzle-centric titles consistently boost creativity and curiosity, whereas timed or competitive games are more effective at enhancing focus and grit.
  • Mobile gaming interventions outperform passive non-game stimuli, as evidenced by negative mood shifts observed in control groups watching neutral content like a dripping faucet video.
  • Developers can maximize user retention and therapeutic impact by incorporating personalization features, such as adjustable difficulty settings and genre-alignment options, to cater to diverse personality profiles.
+2
SkillprintJan 2023
Page 1
Report40 pages

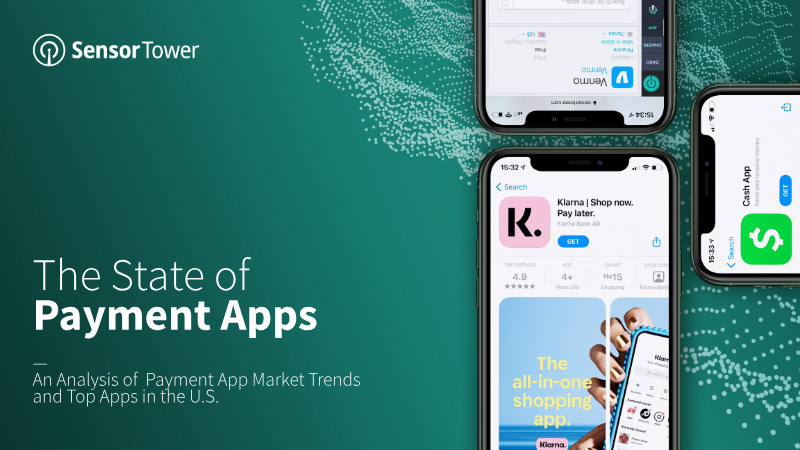
The State of Payment Apps: An Analysis of Payment App Market Trends and Top Apps in the U.S.

The United States payment application market underwent a period of unprecedented expansion between 2020 and early 2021, catalyzed by the COVID-19 pandemic and the distribution of federal stimulus payments. Total downloads reached a record 35 million in the second quarter of 2020 as consumers transitioned toward digital-first financial tools and safer, contactless payment methods. While established platforms like Cash App maintained overall market leadership, the landscape became increasingly competitive due to aggressive promotional strategies and significant app relaunches. Google Pay, for instance, achieved a 347% year-over-year surge in early 2021 by leveraging referral incentives and expanded feature sets including cryptocurrency integration and cashback rewards.

The "Buy Now, Pay Later" (BNPL) segment emerged as a primary driver of industry growth, particularly during the 2020 holiday season. Services such as Klarna and Afterpay saw exceptional adoption rates, with Klarna surpassing one million monthly installs by optimizing its App Store presence and pivoting toward influencer-led video advertising and gaming-related messaging. This growth was further bolstered by deep integrations with major retail applications, positioning BNPL as a mainstream alternative to traditional credit. Simultaneously, money transfer services like Western Union and Remitly experienced a peak in adoption in April 2020, growing 85% over the previous year as users sought reliable digital channels for domestic and international remittances.

As the market continues to diversify, leading payment applications are evolving into comprehensive financial ecosystems. The integration of advanced financial management tools and cryptocurrency support reflects a broader shift in consumer expectations. To maintain dominance, top-tier apps are increasingly relying on strategic keyword bidding and multi-channel marketing to capture a user base that now prioritizes versatility and digital integration in their financial transactions. This evolution signifies a permanent shift in the American financial landscape toward decentralized and flexible payment solutions.

  • The U.S. payment app market peaked at 35 million downloads in Q2 2020, driven by pandemic-related shifts toward digital-first and contactless financial tools.
  • Google Pay achieved a 347% year-over-year growth in early 2021 by utilizing referral incentives, cryptocurrency integration, and cashback rewards.
  • Buy Now, Pay Later (BNPL) services like Klarna and Afterpay became a primary growth driver, with Klarna exceeding one million monthly installs through influencer-led marketing and retail integrations.
  • Money transfer services, including Western Union and Remitly, saw an 85% year-over-year adoption increase in April 2020 as users prioritized reliable digital remittance channels.
  • Leading payment platforms are evolving into comprehensive financial ecosystems by integrating advanced management tools, cryptocurrency support, and strategic multi-channel marketing to maintain market share.
Sensor TowerJan 2023
Page 1
Report31 pages

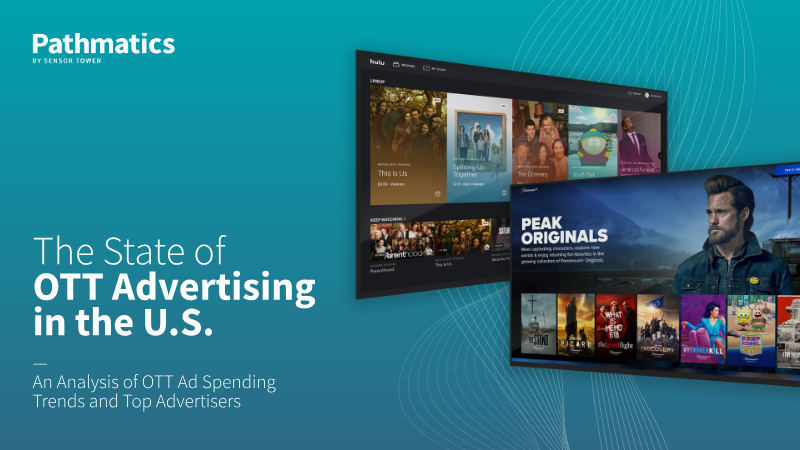
The State of OTT Advertising in the U.S.: An Analysis of OTT Ad Spending Trends and Top Advertisers

Over the course of late 2021 through 2022, the United States Over-the-Top (OTT) advertising market solidified its position as a critical component of the digital landscape, averaging $3.26 billion in quarterly expenditures. This investment represents nearly 15% of all digital advertising spend, signaling a maturation of the sector. While Financial Services previously led the market, Consumer Packaged Goods emerged as the primary spending category by mid-2022. Simultaneously, the automotive industry demonstrated aggressive expansion with a 74% year-over-year increase in ad spend, reflecting a broader trend of traditional industries pivoting toward streaming platforms to capture shifting consumer attention.

Platform dynamics reveal a competitive environment where established services and rising challengers cater to distinct demographics. Hulu and Peacock maintain a strong foothold among viewers under the age of 35, while Tubi has distinguished itself as the fastest-growing publisher, recording a 37% increase in ad revenue. This growth is mirrored by specific service sectors, particularly travel and food delivery, which utilized OTT to drive direct consumer actions. For instance, strategic campaigns from brands like Booking.com and UberEats resulted in measurable performance gains, such as significant spikes in mobile app installations following targeted high-spend periods.

The transportation and grocery sectors further illustrate the shift toward OTT-centric digital strategies. Companies like Turo now allocate more than half of their total digital budgets to streaming advertisements, while grocery delivery services saw a 14% year-over-year increase in investment. These trends underscore a broader industry conclusion: OTT has evolved from a secondary experimental channel into a primary driver for brand visibility and user acquisition across the American economy. As brands like United Airlines and Instacart dominate their respective niches, the ability to track creative impressions and seasonal spikes remains essential for navigating this high-growth advertising vertical.

  • The U.S. OTT advertising market reached a mature state between late 2021 and 2022, averaging $3.26 billion in quarterly spend and accounting for nearly 15% of total digital advertising investment.
  • Consumer Packaged Goods replaced Financial Services as the leading spending category by mid-2022, while the automotive industry increased its OTT ad spend by 74% year-over-year.
  • Tubi emerged as the fastest-growing publisher with a 37% increase in ad revenue, while Hulu and Peacock remain the dominant platforms for reaching viewers under the age of 35.
  • OTT has transitioned from an experimental channel to a primary driver for user acquisition, evidenced by brands like Turo allocating over 50% of their total digital budgets to streaming ads.
  • Grocery delivery services increased their OTT investment by 14% year-over-year, contributing to a broader trend where sectors like food delivery and travel use streaming to drive measurable mobile app installations.
Sensor TowerJan 2023
Page 1
Report25 pages

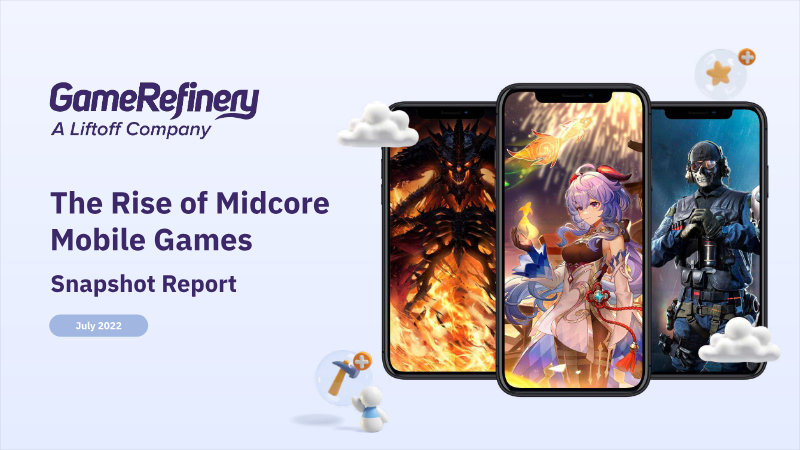
The Rise of Midcore Mobile Games

This analysis explores the significant growth and evolving landscape of midcore mobile games, particularly in the United States market as of mid-2022. While casual and hyper-casual titles historically dominated the mobile space, midcore games—often high-quality AAA experiences ported from PC and console franchises—are increasingly capturing market share. Data indicates that midcore titles accounted for nearly 37% of US iOS mobile game revenue in Q1 2022, representing the only category to see year-over-year growth during that period.

The findings highlight a clear performance gap between top-tier midcore games and their competitors. In a 365-day sample, nine midcore titles maintained positions in the top-200 grossing US charts, compared to only three casual titles. Success in this segment is driven by three primary pillars: sophisticated control systems that emulate the precision of console gaming, massive content cadence through live events, and diversified monetization strategies. Notably, 75% of top-grossing midcore games utilize Battle Passes, and over 65% feature five or more distinct gacha mechanics.

The scope of the research focuses on the US iOS market, utilizing a proprietary three-layered taxonomy to analyze genre-specific trends. Key case studies include Diablo Immortal, Apex Legends Mobile, and Genshin Impact, which are cited for their ability to balance core gameplay depth with mobile-specific monetization. Additionally, the analysis identifies an emerging trend of publishers implementing external web stores to bypass traditional app store commission fees. The methodology relies on data-driven analysis from the GameRefinery SaaS platform, incorporating feature-level comparisons and revenue tracking to distinguish the design elements that define market leaders.

  • Midcore mobile games accounted for 37% of US iOS mobile game revenue in Q1 2022 and were the only category to experience year-over-year growth.
  • Top-tier midcore titles demonstrate superior retention, with nine midcore games maintaining top-200 grossing positions over a 365-day period compared to only three casual titles.
  • Monetization in top-grossing midcore titles is heavily standardized, with 75% of games utilizing Battle Passes and over 65% incorporating five or more distinct gacha mechanics.
  • Success in the midcore segment is driven by a combination of console-quality control systems, high-frequency content updates via live events, and diversified monetization.
  • Major titles such as Diablo Immortal, Apex Legends Mobile, and Genshin Impact serve as benchmarks for balancing core gameplay depth with mobile-specific monetization.
+1
GameRefineryJul 2022
Page 1
Report28 pages

Essential Facts About the Video Game Industry 2022

The 2022 Essential Facts About the Video Game Industry provides a comprehensive analysis of the American gaming landscape, asserting that video games have become a vital tool for social connection, skill-building, and mental well-being. The central thesis posits that the high levels of engagement sparked during the pandemic have become permanent fixtures of American life, with 90% of players maintaining or increasing their playtime since the pandemic's peak.

The findings are based on a February 2022 study conducted by The NPD Group, which surveyed approximately 4,000 Americans. The data reveals that 66% of Americans—roughly 215.5 million people—play video games at least weekly. The player base is diverse and aging, with an average age of 33; 48% of players identify as female and 52% as male. While smartphones remain the most popular device (70%), the majority of players utilize multiple platforms. Puzzle and arcade games lead in popularity, though preferences shift by generation, with older adults specifically valuing games for cognitive stimulation.

Social connectivity is a primary driver of modern gaming habits. The research shows that 83% of players engage with others, and 46% have met a significant other or close friend through gaming. Beyond entertainment, 97% of Americans see games as beneficial, citing stress relief and the development of cognitive and teamwork skills. Parents also view the medium favorably, with 77% playing games with their children weekly and 84% expressing awareness of ESRB ratings to manage household gaming habits.

Economically, the industry reached $60.4 billion in total U.S. sales in 2021, driven largely by content spending. Purchase decisions are primarily influenced by game quality and price, with 67% of players engaging in in-game purchases. The scope of the report covers the 2021-2022 period, focusing on U.S. demographics, market trends, and the evolving social role of interactive entertainment.


  • The U.S. gaming industry generated $60.4 billion in total sales in 2021, with 67% of players participating in in-game purchases.
  • Approximately 215.5 million Americans, or 66% of the population, play video games at least weekly.
  • Pandemic-era engagement levels have stabilized, with 90% of players maintaining or increasing their playtime since the peak of the pandemic.
  • The player base is gender-balanced at 48% female and 52% male, with an average age of 33 years old.
  • Smartphones are the primary gaming device for 70% of players, though most users engage with multiple platforms.
+1
Entertainment Software AssociationJun 2022
Page 1
Report31 pages

Motivations and Demographics Snapshot Report: The Motivations Driving Top Mobile Games, February 2022

The mobile gaming landscape in the United States is defined by a complex interplay between player demographics and a diverse set of motivational drivers. Analysis of the top 200 grossing titles as of early 2022 reveals that while certain motivations like excitement and thrill are universal, their execution is highly demographic-specific. Younger male audiences gravitate toward high-sensomotoric challenges such as Battle Royales, whereas players aged 45 and older seek similar thrills through low-sensomotoric experiences like Slots. A significant shift in the casual market is also evident, as every top-grossing casual game released between 2020 and 2022 has integrated renovation and customization elements to broaden appeal and foster player expression.

Gender and age remain primary indicators of genre preference and monetization behavior. Thinking and solving motivations, prevalent in Match3 and Hidden Object games, attract a 63% female audience that frequently monetizes through level retries. Conversely, strategic planning and mastery drivers are dominated by male players, who make up 76% to 84% of the audience in 4X strategy and synchronous PvP titles. However, these gender lines blur in specific sub-genres; for instance, while men dominate resource optimization in strategy games, women represent 61% of the audience for similar mechanics within the Tycoon and Crafting categories.

The integration of secondary motivational drivers has become a standard industry practice to enhance retention and engagement. Collection mechanics have permeated nearly all genres, with Slots and character-driven RPGs leading the trend. Social drivers are increasingly facilitated through non-competitive co-op and guild systems, particularly among men aged 25 to 44, while exploration is driven by live events and sandbox elements. Ultimately, the most successful mobile titles are those that layer multiple drivers—such as milestone completion, skill improvement, and social interaction—to appeal to the nuanced psychological profiles of their target demographics.

  • Gender and age are primary indicators of genre preference, with women comprising 63% of the audience for Match3 and Hidden Object games, while men make up 76% to 84% of the audience in 4X strategy and synchronous PvP titles.
  • Every top-grossing casual game released between 2020 and 2022 has integrated renovation and customization elements to increase player expression and broaden market appeal.
  • Motivational drivers are demographic-specific; younger males prefer high-sensomotoric challenges like Battle Royales, while players aged 45 and older seek similar thrills through low-sensomotoric experiences like Slots.
  • Gender-based genre preferences are not absolute, as evidenced by women representing 61% of the audience for resource optimization mechanics within Tycoon and Crafting categories.
  • Secondary engagement drivers such as collection mechanics have become industry-standard, with Slots and character-driven RPGs leading the trend to improve retention.
+2
GameRefineryFeb 2022
Page 1
Report31 pages

Motivations and Demographics Snapshot Report

The mobile gaming landscape in the United States is defined by a complex interplay between game mechanics and player psychology, categorized through a framework of twelve distinct motivational drivers. Analysis of the top 200 grossing titles reveals that while broad categories like Excitement and Thrill account for nearly a quarter of the market, the specific implementation of these drivers varies significantly across demographic lines. Younger male audiences typically engage with high-action PvP environments to satisfy mastery and competition, whereas players aged 45 and older gravitate toward progressive jackpots in social slots.

A significant shift in the casual gaming sector demonstrates the universal appeal of renovation and customization mechanics. Every top-100 grossing casual title released within the last two years has integrated renovation elements, signaling that Expression—the desire to customize and decorate—has become a fundamental requirement for modern engagement. This trend is particularly pronounced among female players, who show a strong preference for tycoon games and creative customization, while male players remain more focused on role-playing elements and reaction-based skill mastery.

Strategic drivers such as Management and Exploration show varying levels of market penetration. While Exploration is widely utilized through gacha mechanics and sandbox discovery, Management remains a specialized niche dominated by 4X strategy titles, which account for 70% of that segment. These findings underscore the necessity for developers to align specific gameplay features with the nuanced motivational profiles of their target age and gender groups to achieve commercial success in the competitive US mobile market.

  • Renovation and customization mechanics are now a fundamental requirement for casual gaming, appearing in 100% of the top-100 grossing casual titles released in the last two years.
  • Motivational drivers for US mobile gaming are highly demographic-specific, with younger males prioritizing mastery and competition in PvP, while players aged 45 and older favor social slots.
  • The 'Expression' driver, centered on customization and decoration, is a primary engagement factor particularly among female players who show a strong preference for tycoon and creative titles.
  • Excitement and Thrill-based mechanics account for nearly 25% of the market across the top 200 grossing titles.
  • The Management genre is a specialized niche in the US market, with 4X strategy titles currently controlling 70% of that segment.
+1
GameRefineryFeb 2022
Page 1
Report11 pages

Key Insights Into American Gamers

The United States represents the second-largest gaming market globally, generating $47.3 billion in revenue from a population of 191 million gamers. Research conducted in 2022 indicates that 72% of the American online population are game enthusiasts, a broad category encompassing those who play, watch, or socially engage with video games. While 71% of the population plays games, there is a significant overlap with viewership, as 44% of the population watches gaming video content and 18% engages with esports.

The demographic profile of American gamers is nearly evenly split by gender, with 52% identifying as male and 47% as female. Engagement spans all age groups, though the 21-35 bracket is the most active at 35%. Player motivations are diverse, led by social interaction (37%), action (37%), and achievement (36%). While mobile is the most popular platform by reach, capturing 48% of players, console gaming commands the highest engagement time, averaging six hours per week.

Economic engagement is high, with 49% of the online population spending money on games. The primary drivers for spending include the desire to play with friends or family, taking advantage of sales, and unlocking exclusive content. Popular titles like Fortnite, Grand Theft Auto V, and Call of Duty dominate the market, with shooters and adventure games ranking as the top genres by monthly active users. This data is derived from a 2022 consumer insights survey of 3,054 online respondents in the U.S., part of a broader global study covering 36 markets.

  • The U.S. gaming market generated $47.3 billion in revenue from 191 million gamers, representing 72% of the online population.
  • Engagement is driven by a mix of play and viewership, with 71% of the population playing games, 44% watching gaming content, and 18% engaging with esports.
  • Mobile is the most popular platform by reach at 48%, while console gaming commands the highest engagement at an average of six hours per week.
  • The demographic profile is nearly evenly split, with 52% male and 47% female, and the 21-35 age bracket serving as the most active segment at 35%.
  • Nearly half of the online population (49%) spends money on games, primarily motivated by social interaction, sales, and exclusive content.
+1
NewzooJan 2022
Page 1
Report16 pages

Strategy Genre Snapshot 2021

The strategy genre remains a cornerstone of the mobile gaming market, currently ranking as the third-largest genre in the United States on iOS with a 17% revenue market share. The landscape is heavily dominated by the 4X strategy subgenre, which accounts for 20 of the top 25 grossing strategy titles. While the market is crowded with aging titles, recent growth is driven by genre-blending, where developers integrate mechanics from other categories—such as merge, match-3, or RPG elements—to broaden player appeal.

Market analysis reveals that 4X strategy games rely on three primary pillars: long-term power progression through permanent boosts and deep economies, complex live operations featuring recurring events, and robust social frameworks centered on competition and collaboration. High-performing examples include State of Survival, which reached the top of the 4X subgenre through massive IP collaborations, and Top War, which successfully scaled using merge mechanics. Conversely, the MOBA subgenre continues to face challenges in the U.S. market; despite a strong launch, League of Legends: Wild Rift struggled to maintain its top-grossing position, leaving the subgenre's future performance to newer entries like Pokémon UNITE.

Player motivation data, derived from a survey of over 7,000 respondents across English-speaking Western territories, indicates that strategy players are primarily driven by strategic planning, resource optimization, and social competition. Successful titles capitalize on these drivers by offering deep technology trees, competitive guild mechanics, and diverse PvP modes. While Supercell remains the only major player finding significant success outside the 4X subgenre with titles like Clash of Clans, the broader trend suggests that sustained revenue in this space requires a sophisticated mix of deep monetization loops and constant feature innovation.

  • The 4X subgenre dominates the U.S. mobile strategy market, accounting for 20 of the top 25 grossing titles within a genre that holds a 17% total iOS revenue share.
  • Successful strategy titles are increasingly driven by genre-blending, integrating mechanics like merge, match-3, or RPG elements to expand their player base beyond traditional core audiences.
  • High-performing 4X games rely on three core pillars: long-term power progression through deep economies, complex live operations with recurring events, and social frameworks built on competition and collaboration.
  • Player motivation data from over 7,000 Western respondents confirms that strategic planning, resource optimization, and social competition are the primary drivers for engagement in the genre.
  • While Supercell remains a notable exception with Clash of Clans, the broader strategy market is currently defined by aging titles that require constant feature innovation and deep monetization loops to maintain revenue.
GameRefineryOct 2021

Publishers

Related Topics