Market Analysis
Documents

Pour une Pratique Responsable du Jeu Vidéo: France
The guide presents a comprehensive overview of the French video‑game ecosystem in 2023, emphasizing the need for responsible consumption and the protection of minors. It argues that widespread digital engagement—now a daily habit for two‑thirds of adults and more than half of teenagers—requires coordinated action from industry, parents, and public authorities to ensure safe and balanced play.
Survey data collected from the SELL‑GSD/GameTrack panels at the end of 2021 reveal that 70 % of French residents play video games at least occasionally, with 53 % doing so regularly. Daily play is reported by 68 % of adults and 52 % of children aged 10‑17, while 95 % of parents are aware of parental‑control tools; only 44 % actually use them, and 51 % know of them without applying them. Parental involvement varies: 13 % supervise every session, 22 % select titles, 25 % advise against certain games, and 40 % allow autonomous play without consent. Moreover, 64 % of parents admit to playing with their children at least occasionally, highlighting the family‑oriented dimension of gaming.
The market analysis shows a split between physical and digital sales, with physical units representing 34 % of volume and 40 % of value, while digital formats account for the remainder. PEGI age‑rating labels dominate purchase decisions, being consulted by 67 % of adult buyers and 64 % of parents, and the system’s classification process involves independent bodies (NICAM and VSC) to certify titles across the Pan‑European market.
The publication also details the functionality of console‑based parental‑control systems, online interaction moderation tools, and the educational outreach conducted by the SELL and its partner network PédaGoJeux. Campaigns such as Safer Internet Day and a series of PEGI‑focused awareness drives illustrate the sector’s proactive stance on fostering a safer, more informed gaming environment for all French users.
- Gaming is a mainstream activity in France, with 70% of residents playing occasionally and 53% playing regularly as of late 2021.
- While 95% of parents are aware of parental-control tools, only 44% actively use them, leaving a significant gap between awareness and implementation.
- Parental involvement in gaming is inconsistent: 40% of parents allow children to play autonomously without consent, while only 13% supervise every session.
- The French market remains hybrid, with physical media accounting for 34% of unit volume and 40% of total market value.
- PEGI age-rating labels are a primary consumer tool, consulted by 67% of adult buyers and 64% of parents to inform purchase decisions.
Global Report 2023
Power of Play: Global Report 2023 – Executive Summary
1. Scope & Methodology | Item | Detail | |------|--------| | Survey population | ≈ 12,847 active (weekly) gamers, ages 16 +, from 12 countries (Australia, Brazil, Canada, France, Germany, Italy, Japan, Poland, South Korea, Spain, United Kingdom, United States). | | Sampling | Quota‑based, nationally‑representative panels (AudienceNet). Each country ≈ 1,000 + respondents. | | Data collection | Online questionnaire covering motivations, mental‑health impacts, social behaviours, and skill development. | | Academic triangulation | Findings cross‑checked against ~10 peer‑reviewed studies (see References, p. 12). |
2. Why People Play (Top‑3 Reasons – Global)
| Rank | Reason | % of respondents (global) | |------|--------|----------------------------| | 1 | Fun / enjoyment | 69 % | | 2 | Pass the time | 63 % | | 3 | Stress relief / relaxation | 55 % |
Country‑level nuances: “Fun” dominates in every market (≥ 78 % in most). “Stress relief” is especially high in Australia (71 %) and Japan (73 %).
3. Self‑Reported Mental‑Health Benefits
| Benefit | Global agreement (average) | Range across countries | |---------|----------------------------|------------------------| | Reduces stress | 71 % | 55 % – 87 % | | Reduces anxiety | 61 % | 48 % – 78 % | | Reduces feelings of isolation/loneliness | 55 % | 45 % – 73 % | | Provides a healthy outlet for everyday challenges | 64 % | 52 % – 76 % | | Makes me feel happier | 63 % | 45 % – 83 % | | Helps me get through difficult times | 52 % | 33 % – 71 % |
> Interpretation: More than two‑thirds of gamers perceive video games as a stress‑relief tool, and roughly half feel less isolated because of gaming.
4. Social & Relational Outcomes
| Metric | Global % (approx.) | |--------|-------------------| | Play with others online (≥ weekly) | 51 % | | Play with others in‑person (≥ weekly) | 38 % | | Met a good friend, spouse, or significant other through games | 46 % | | Games helped develop deeper relationships | 43 % | | Games helped stay connected to friends/family | 46 % | | Games created lasting memories | 50 % | | Believe there is a game for everyone | 75 % |
> Key insight: Multiplayer and social features are central; almost half of respondents have formed meaningful offline relationships via gaming
- Video games function primarily as a mental health tool, with 71% of global gamers reporting that play reduces stress and 61% noting a reduction in anxiety.
- Fun and enjoyment remain the primary drivers for gaming, cited by 69% of the 12,847 respondents, followed by passing time (63%) and stress relief (55%).
- Social connectivity is a core component of the gaming experience, as 51% of players engage in online multiplayer weekly and 46% have formed meaningful personal relationships, including friendships and marriages, through games.
- Gaming serves as a significant social bridge, with 46% of respondents using games to stay connected with friends and family and 43% reporting that gaming helped them develop deeper relationships.
- The perception of gaming as an inclusive medium is high, with 75% of respondents agreeing that there is a game available for everyone.

I Videogiochi in Italia nel 2023
I Videogiochi in Italia nel 2023 – Sintesi
1. Dimensione del mercato
Fatturato: € 2,3 miliardi, con una crescita del 5 % rispetto al 2022 e del 28 % rispetto al 2019. Posizione europea: l’Italia si colloca tra i cinque maggiori mercati videoludici d’Europa. Pubblico: 13 milioni di persone tra i 6 e i 64 anni (circa il 31 % della popolazione), con un’età media di 30 anni.
Questi dati confermano che il settore è in forte espansione, sia in termini di valore economico sia di penetrazione culturale.
2. Il ruolo dell’IIDEA
L’Istituto per l’Innovazione Digitale e l’Economia dell’Arte (IIDEA) è il punto di riferimento istituzionale per lo sviluppo dell’industria videoludica italiana. Le sue attività principali sono:
| Area di intervento | Azioni chiave | |--------------------|----------------| | Sviluppo business & internazionalizzazione | - Programmi di accelerazione con partner nazionali e internazionali<br>- Campagna di branding “Games in Italy” per promuovere i titoli Made‑in‑Italy | | Educazione e gioco responsabile | - Portale “Tutto sui videogiochi” per genitori e insegnanti<br>- Informazione su rating PEGI e strumenti di parental‑control | | Eventi e riconoscimenti | - First Playable (fiera di riferimento)<br>- Italian Video Game Awards (dal 2013)<br>- Italian Esports Awards (dal 2020) | | Visibilità globale | - Missioni commerciali e matchmaking con investitori/partner esteri<br>- Supporto alla partecipazione a fiere internazionali (e.g., Gamescom, GDC) |
Obiettivi strategici dell’IIDEA
1. Elevare la visibilità internazionale dei prodotti italiani, facilitando partnership e accordi di distribuzione all’estero. 2. Collegare i developer locali con reti di finanziamento, expertise tecnica e canali di marketing globali. 3. Valorizzare il contributo culturale ed economico del settore, posizionandolo come driver di innovazione e creatività nel panorama digitale italiano.
Conclusioni
Il 2023 segna un anno di consolidamento per il mercato videoludico italiano: un fatturato in crescita, una base di utenti ampia e giovane, e un ecosistema supportato da un ente pubblico (IIDEA) che combina sviluppo commerciale, promozione internazionale e educazione responsabile. Queste dinamiche creano le condizioni per un futuro ancora più competitivo, con il potenziale di trasformare l’Italia in un hub di riferimento per la creatività digitale a livello europeo e mondiale.
- The Italian video game market generated €2.3 billion in 2023, representing a 5% increase over 2022 and a 28% growth since 2019.
- Italy ranks among the top five largest video game markets in Europe, with 13 million players aged 6 to 64, representing 31% of the population.
- The average age of the Italian gamer is 30 years old, reflecting the sector's broad cultural and demographic penetration.
- IIDEA serves as the primary institutional body for the industry, focusing on business acceleration, international branding through 'Games in Italy,' and global networking at events like Gamescom and GDC.
- IIDEA manages key industry infrastructure, including the 'First Playable' trade fair, the Italian Video Game Awards, and the Italian Esports Awards.
Fashion & Beauty Trends: How Gen Z Express Themselves in Immersive Spaces 2023
The 2023 analysis of digital expression among Generation Z demonstrates that immersive platforms have become the primary arena for personal style and identity formation. Across the year, more than half of Gen Z respondents now prioritize styling their avatars over physical clothing, and a substantial majority regard digital fashion as at least somewhat important, with over half noting a marked increase in relevance since the previous year. This shift is reflected in a 38 percent rise in avatar updates, reaching 165 billion actions, and a 15 percent growth in the purchase of virtual fashion items, totaling 1.6 billion transactions. Monthly spending on digital looks clusters between ten and one hundred dollars, driven especially by limited‑edition pieces that command significant resale premiums.
Customization behavior reveals a strong focus on clothing and hair, each selected by roughly half of users, while a sizable portion aligns skin tone and body type with their real‑world appearance. Daily or weekly avatar adjustments are reported by 70 percent of participants, with female‑identifying and non‑binary players leading the trend. Hairstyle purchases alone surged 20 percent to exceed 139 million items, underscoring the depth of aesthetic investment.
Beyond consumption, Gen Z leverages these spaces for co‑creation and personal development. Collaborative projects such as a Fenty Beauty product that amassed over one million community votes and student‑driven translations of digital runway concepts into physical garments illustrate the platform’s role as an incubator for fashion innovation. Moreover, 88 percent of respondents claim virtual self‑expression enhances their offline identity, while notable percentages report improved social connections, mood, and confidence, suggesting tangible mental‑health benefits. Industry forecasts anticipate that leading fashion talent will increasingly emerge from these immersive environments, positioning digital platforms as pivotal to the future of fashion and beauty.
- Digital fashion is a primary priority for Gen Z, with over 50% of users valuing avatar styling over physical clothing and 1.6 billion virtual fashion transactions occurring in 2023, a 15% growth.
- Avatar engagement is high and frequent, evidenced by 165 billion update actions—a 38% increase—with 70% of participants adjusting their avatars on a daily or weekly basis.
- Virtual aesthetic investment is significant, highlighted by a 20% surge in hairstyle purchases to over 139 million items and monthly spending on digital looks typically ranging from $10 to $100.
- Immersive platforms are functioning as fashion incubators, demonstrated by collaborative initiatives like the Fenty Beauty project that generated over one million community votes.
- Virtual self-expression has a measurable impact on offline life, with 88% of Gen Z respondents reporting that digital styling enhances their real-world identity and confidence.
Global Mobile Game & App (Non‑Game) Marketing White Paper 2022
The global mobile landscape in 2022 was defined by a 17.5% year-on-year increase in quarterly advertisers despite a 16% decline in total creative volume. This shift indicates a transition toward more dynamic, high-frequency marketing strategies, with over 90% of advertisers launching new creatives each quarter. While North America maintained the largest advertiser base, markets in Hong Kong, Macao, and Taiwan exhibited the highest creative output per advertiser. Android remained the dominant platform for volume, often doubling the creative output of iOS, though iOS advertisers grew to represent 40% of the market by year-end.
The gaming sector experienced a notable decoupling of engagement and monetization. Genres such as strategy, simulation, and casual games saw year-over-year download growth ranging from 8% to 10%, yet simultaneously faced revenue declines between 9% and 16%. To combat rising user acquisition costs and falling revenues, developers increasingly adopted "Casual + X" strategies. This trend involved integrating hyper-casual mini-games—such as "save the dog" puzzles or line-drawing mechanics—into the marketing funnels of complex RPG and strategy titles to lower costs and broaden appeal. Hybrid-casual titles also emerged as a significant force, utilizing Roguelike mechanics and high-volume video ads to bridge the gap between traditional casual play and deeper monetization.
In the non-game sector, advertising activity peaked in the fourth quarter, driven largely by utility tools, shopping, and educational applications. Video content remained the primary medium, accounting for over 70% of creatives across most global regions. Major players like TikTok and Duolingo maintained market leadership through exceptionally high creative refresh rates, often exceeding 95% new content. Regionally, Southeast Asia and Turkey showed a heavy reliance on Android and localized "big hit" formulas, while the United States and Japan remained the primary drivers of global revenue.
Looking forward, the industry is shifting toward story-centric strategies and user-generated content to navigate a privacy-first environment. With the implementation of SKAdNetwork 4.0 and the impending Android Privacy Sandbox, marketers are moving away from granular user-level targeting in favor of Media Mix Modeling. The prevailing conclusion is that long-term lifetime value and diversified monetization models are now essential to offset rising platform costs and tightening media budgets.
- The mobile gaming sector saw a decoupling of engagement and monetization in 2022, with strategy, simulation, and casual genres experiencing 8% to 10% download growth alongside 9% to 16% revenue declines.
- To counter rising acquisition costs, developers are adopting 'Casual + X' strategies, integrating hyper-casual mini-games into complex RPG and strategy titles to broaden appeal and lower entry barriers.
- Marketing strategy shifted toward higher efficiency in 2022, characterized by a 17.5% increase in quarterly advertisers despite a 16% reduction in total creative volume.
- Android remains the dominant platform for creative volume, often doubling iOS output, though iOS advertisers captured 40% of the market share by the end of 2022.
- Market leaders like TikTok and Duolingo maintain dominance through high-frequency creative refreshes, with new content rates exceeding 95% per quarter.

Creative Industries in the UK Report
The United Kingdom’s entertainment market reached a historic peak of £11.1 billion in 2022, representing a 6.9% year-on-year increase and nearly doubling its total value since 2015. This growth is fundamentally underpinned by a comprehensive transition to digital consumption, with digital services now commanding a 91% market share across the video, music, and gaming sectors. While physical formats generally continue a long-term decline, specific niches such as vinyl and 4K UHD Blu-ray demonstrate notable resilience, with vinyl revenue surpassing CD sales for the first time this century.
The video games sector remains the largest individual segment, valued at £4.66 billion. Digital software sales account for 90% of this spend, led by mobile gaming and console downloadable content. Although hardware sales faced challenges due to global supply chain constraints, the market remains robust, with digital sales for major titles like Elden Ring and FIFA 23 significantly outperforming physical retail. Similarly, the video market reached a record £4.43 billion, fueled by a 17.6% surge in subscription video-on-demand services. Approximately 68% of UK households now maintain an average of 2.5 streaming subscriptions, cementing the dominance of online distribution.
The music industry mirrors these trends, with subscription streaming accounting for 84% of its £1.99 billion valuation. Interestingly, 2022 saw a nuanced recovery for physical retail as high-street specialists and independent shops experienced a 12.6% growth in sales following the normalization of post-pandemic trading. Despite this resurgence of local brick-and-mortar outlets, online channels still facilitate nearly 95% of total music spending. Strategic initiatives like Record Store Day and the implementation of advanced data tracking continue to support the industry's evolution, ensuring that both digital innovation and traditional retail advocacy remain central to the UK’s creative economy.
- The UK entertainment market reached a record £11.1 billion in 2022, a 6.9% year-on-year increase that nearly doubles its 2015 valuation.
- Digital services now dominate the landscape with a 91% market share across video, music, and gaming sectors.
- The video games sector is the largest segment at £4.66 billion, with digital software sales—driven by mobile and console DLC—accounting for 90% of that total.
- The video market grew to £4.43 billion, supported by a 17.6% surge in subscription video-on-demand services, with 68% of UK households now averaging 2.5 subscriptions each.
- Music industry revenue reached £1.99 billion in 2022, with subscription streaming accounting for 84% of total valuation.
The Game Industry of Finland Report: 2022
The Finnish game industry established itself as a premier global hub between 2021 and 2022, maintaining a record annual turnover of €3.2 billion. This performance places Finland among the top five national game industries in Europe. Despite a shift toward the "games-as-a-service" model and macroeconomic headwinds that reduced the frequency of new game launches, the sector experienced a surge in startup activity and employment. By late 2022, the industry supported 232 active studios and approximately 4,100 employees, characterized by a highly international workforce and a stable presence of female professionals.
While mobile remains the dominant platform by revenue, there is a significant strategic pivot toward PC and multiplatform development, with 64% of studios now targeting the PC market. This evolution is supported by a sophisticated funding ecosystem that includes over €300 million in private investment and substantial public R&D support from Business Finland. The industry’s maturity is further evidenced by high-profile acquisitions from global giants such as Sony, Netflix, and Playtika, alongside the continued success of established leaders like Supercell, Rovio, and Remedy Entertainment.
The ecosystem is anchored in Helsinki, which accounts for the vast majority of turnover and employment, but it also benefits from thriving regional clusters in Tampere, Oulu, and Kajaani. These hubs specialize in diverse technologies ranging from VR and Web3 to simulation and narrative-driven titles. Despite challenges such as rising marketing costs due to privacy changes and a persistent talent shortage, the industry remains resilient through robust institutional support from organizations like Neogames and Suomen Pelinkehittäjät ry. This collaborative infrastructure, combined with a focus on original intellectual property and emerging technologies like Creative AI, ensures Finland’s continued influence on the global gaming landscape.
- The Finnish game industry generated a record annual turnover of €3.2 billion in 2022, securing its position as one of the top five national game markets in Europe.
- The sector comprises 232 active studios and 4,100 employees, supported by a robust funding ecosystem that includes over €300 million in private investment and significant public R&D backing from Business Finland.
- While mobile remains the primary revenue driver, 64% of studios have pivoted toward PC development, reflecting a broader strategic shift toward multiplatform releases.
- The industry is experiencing a trend of consolidation and international interest, evidenced by high-profile acquisitions from major global entities including Sony, Netflix, and Playtika.
- Helsinki remains the primary industry hub, though regional clusters in Tampere, Oulu, and Kajaani contribute specialized expertise in areas such as VR, Web3, and simulation technologies.
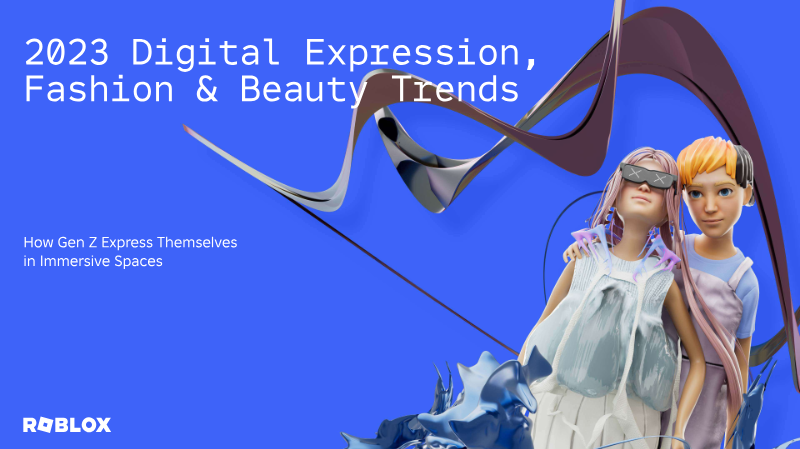
Fashion & Beauty Trends: How Gen Z Express Themselves in Immersive Spaces
This analysis explores the evolving relationship between digital identity, fashion, and physical self-expression among Gen Z consumers. The primary thesis asserts that digital avatars have become a central medium for authentic self-expression, significantly influencing physical world style, brand affinity, and mental well-being. As immersive spaces transition from mere gaming environments to social hubs, the distinction between digital and physical identity continues to blur, with a majority of users now prioritizing their virtual appearance over their physical one.
The findings are based on a dual methodology: behavioral data from the Roblox platform collected between January and September 2023, and a representative survey of 1,545 Gen Z users aged 14 to 26 in the United States and the United Kingdom. Key data points reveal a significant upward trend in engagement; total avatar updates grew 38% year-over-year to 165 billion, while purchases of digital fashion items rose 15% to 1.6 billion. Notably, 56% of Gen Z respondents stated that styling their avatar is more important than styling their physical selves, an increase from 42% in the previous year.
The research highlights a symbiotic relationship between realms, with 84% of respondents noting that their physical style is inspired by their avatar’s look. This digital-to-physical pipeline extends to commerce, as 84% of users are likely to consider a brand in the physical world after trying its items virtually. The report also emphasizes the psychological benefits of these spaces, with 88% of users crediting immersive expression with helping them feel more comfortable in the physical world. Industry segments covered include digital fashion, beauty, and music, noting a growing demand for exclusivity through limited-edition digital goods and community-created content. Overall, the data suggests that the metaverse is functioning as a low-stakes laboratory for identity, driving broader trends in gender-fluid fashion and diverse representation.
- 56% of Gen Z users now prioritize styling their digital avatars over their physical appearance, a significant increase from 42% in the previous year.
- Engagement with digital identity is surging, with Roblox users performing 165 billion avatar updates (a 38% year-over-year increase) and purchasing 1.6 billion digital fashion items (a 15% increase) between January and September 2023.
- Digital-to-physical brand influence is high, as 84% of Gen Z respondents are more likely to consider a physical-world brand after interacting with its items in an immersive space.
- Virtual spaces serve as a primary style incubator, with 84% of users reporting that their physical-world fashion choices are directly inspired by their avatar's look.
- Immersive self-expression provides tangible psychological benefits, with 88% of users stating that their virtual experiences help them feel more comfortable in the physical world.

How Starfield Reached 10M Users
The launch of Starfield represents a significant evolution in Bethesda’s marketing methodology, transitioning from traditional brand-focused teasers to a sophisticated, multi-channel digital strategy. By prioritizing TikTok, Instagram, and Twitch, the campaign successfully targeted modern gaming audiences, ultimately reaching 10 million players to become the largest launch in the studio's history. A central component of this success was the strategic integration with Microsoft’s ecosystem, which emphasized immediate availability on Xbox Game Pass and utilized AI-driven cross-promotion via Bing. This approach was bolstered by hardware partnerships with companies like AMD, which bundled the game with PC components to incentivize premium edition adoption.
The financial scale of the campaign was substantial, involving a $21.2 million advertising spend in the United States, which accounted for approximately 70% to 77% of the total global marketing budget. During the critical launch window, investment pivoted heavily toward Over-the-Top media and short-form video content. While these efforts secured a top-30 all-time peak on Steam and record-breaking player counts, the title faced a complex competitive landscape. Simultaneous releases and updates for Baldur’s Gate 3 and Cyberpunk 2077 contributed to a polarized reception, reflected in a Metacritic user score of 6.6/10 despite the game's commercial dominance.
Data-driven market intelligence remains essential for navigating such competitive environments, as evidenced by the reliance on digital monitoring tools to optimize regional targeting and creative messaging. By analyzing competitor spending and platform-specific engagement, major industry entities like Activision and Electronic Arts continue to refine their strategies. The Starfield case study illustrates that while massive financial investment and platform exclusivity can drive unprecedented user acquisition, long-term sentiment is increasingly shaped by the broader market context and the specific demands of a digitally native player base.
- Starfield achieved the largest launch in Bethesda’s history with 10 million players, driven by a $21.2 million U.S. advertising spend that represented roughly 70% to 77% of the total global marketing budget.
- The marketing strategy shifted from traditional teasers to a multi-channel digital approach, prioritizing TikTok, Instagram, Twitch, and AI-driven cross-promotion via Bing.
- Integration with the Microsoft ecosystem and immediate availability on Xbox Game Pass were central to the game's commercial scale and user acquisition.
- Hardware partnerships, specifically with AMD, successfully incentivized premium edition adoption by bundling the game with PC components.
- Despite commercial success and a top-30 all-time peak on Steam, the title received a 6.6/10 Metacritic user score, influenced by competition from Baldur’s Gate 3 and Cyberpunk 2077.
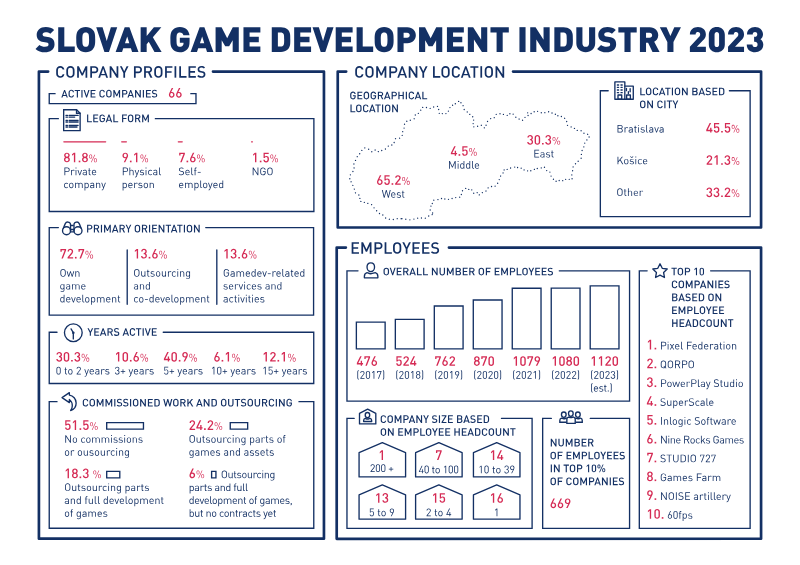
Slovak Game Development Industry 2023
The Slovak game development industry in 2023 is characterized by a stable ecosystem of 66 active companies, primarily concentrated in the western region of the country. The sector is dominated by private entities, with 72.7% focusing on core game development and the remainder providing outsourcing or specialized services. While the industry features a mix of experience levels, over 40% of companies have been active for more than five years. The workforce has seen consistent growth, rising from 476 employees in 2017 to an estimated 1,120 in 2023. However, the industry exhibits significant centralization, with the top 10% of companies employing approximately 60% of the total workforce and generating 84.6% of the annual turnover.
Financial data indicates a mature but plateauing market, with an overall turnover of €77.1 million in 2022 and a nearly identical estimate of €76.9 million for 2023. Pixel Federation, SuperScale, and Inlogic Software lead the market in both headcount and revenue. Development is largely self-funded, though 37.9% of companies utilize public funding. PC remains the primary target platform for development, followed by mobile and consoles. Notably, half of all projects remain unpublished, while those that reach the market are predominantly self-published via digital storefronts like Steam, Google Play, and the App Store.
The labor market reveals a workforce with a median age of 30, where women represent 19% of the total headcount, primarily occupying roles in graphic arts and community management. Recruitment remains a challenge for specialized roles, particularly for programmers and game designers. To address talent shortages, nearly half of Slovak firms employ international staff, largely from Czechia and Ukraine. Operational trends show a decisive shift toward flexible work arrangements, with over 89% of companies utilizing remote or hybrid office models. Industry stakeholders express a strong desire for increased state support, specifically through tax incentives and improved education for the digital arts.
- The Slovak game industry is highly centralized, with the top 10% of companies accounting for 60% of the 1,120-person workforce and 84.6% of the total annual turnover.
- Industry revenue has plateaued, with turnover reaching €77.1 million in 2022 and an estimated €76.9 million in 2023.
- Pixel Federation, SuperScale, and Inlogic Software are the dominant market leaders in both headcount and revenue.
- The workforce has grown significantly since 2017, rising from 476 employees to 1,120 by 2023, though recruitment for specialized roles like programmers and designers remains difficult.
- While 89% of companies utilize remote or hybrid work models, firms are increasingly reliant on international talent, with nearly half employing staff from countries like Czechia and Ukraine.
Game Developer Index 2023: Sweden
The Swedish games industry reached a significant financial milestone in 2022, with domestic revenues rising 13% to €3.1 billion and total global revenue, including foreign subsidiaries, surging 40% to €8.1 billion. This growth is characterized by a massive international footprint, as Swedish-owned companies now operate nearly 400 studios across 59 countries. Large-scale acquisitions, such as Embracer Group’s multi-billion euro purchase of Asmodee, have shifted the employment landscape, resulting in Swedish firms employing nearly twice as many people abroad as they do domestically. Within Sweden, the number of active companies grew by 20% to 939, supported by a maturing ecosystem of regional hubs and specialized educational programs.
Despite this commercial success, the industry faces a critical production capacity bottleneck driven by a chronic shortage of skilled labor. While domestic employment grew to over 8,400 positions and diversity improved—with women accounting for over 44% of new entrants—the sector remains heavily dependent on foreign recruitment to sustain its trajectory. Furthermore, Swedish startups face a competitive disadvantage due to a lack of formal financial support structures compared to other European nations, forcing many to rely on organic growth or early acquisition rather than domestic venture capital.
The sector is also navigating complex structural and environmental challenges. Sustainability efforts are increasingly focused on Scope 3 emissions, which represent over 99% of the industry’s carbon footprint, while legal and ethical concerns regarding generative AI and online radicalization have emerged as new operational risks. Geopolitical instability, particularly the war in Ukraine, continues to impact global workforces. Nevertheless, the integration of the Swedish E-sports Association into the Swedish Sports Confederation and the continued dominance of major entities like King, Mojang, and Stillfront Group underscore Sweden’s position as a premier global hub for game development and digital entertainment.
- The Swedish games industry saw total global revenue reach €8.1 billion in 2022, a 40% increase driven by aggressive international expansion and large-scale acquisitions like Embracer Group’s purchase of Asmodee.
- Domestic revenue in Sweden rose 13% to €3.1 billion in 2022, supported by a 20% growth in active companies to a total of 939 studios.
- Swedish-owned game companies now operate nearly 400 studios across 59 countries, with the industry employing nearly twice as many people abroad as it does within Sweden.
- A chronic shortage of skilled labor remains a critical production bottleneck, forcing the industry to rely heavily on foreign recruitment despite domestic employment growing to over 8,400 positions.
- Swedish startups face a competitive disadvantage due to a lack of formal domestic venture capital, often forcing them to rely on organic growth or early acquisition.
Mobile Games: State of the Market
The mobile gaming market in the first half of 2023 is characterized by a general decline in downloads and revenue across most genres, despite continued dominance in the broader application economy. Mobile games currently account for 29.6% of total app downloads and 51% of total revenue. The analysis, based on data from 37 countries across the App Store and Google Play, reveals a significant platform divergence: Google Play secures 88.6% of downloads, while the App Store generates 56.3% of total revenue.
Geographically, India remains the largest market for downloads with a 15.29% share, followed by Brazil and the United States. In terms of revenue, the United States leads with $5.71 billion, followed by Japan and China. While the RPG genre remains the largest revenue generator, it has experienced a gradual decline over the past two years, falling from $5.9 billion in the first half of 2022 to $4.4 billion in the same period of 2023. Casual games maintain the largest download share in most Western markets, whereas Action and Strategy genres show higher resonance in regions such as Southeast Asia and the Middle East.
The advertising landscape shows a shift toward video content, which now accounts for 72% of all gaming creatives. Although the total number of advertisers on Android saw a slight decrease, the gaming sector specifically experienced a 22% year-over-year growth in the number of advertisers. In total, gaming apps generated 8.9 million creatives during this period, representing 56% of all mobile advertising creatives. Top-performing titles like Subway Surfers and Roblox continue to lead in downloads, while Coin Master and Honor of Kings remain top revenue earners across their respective platforms.
- Mobile gaming revenue and downloads declined globally in the first half of 2023, though the sector still accounts for 51% of total app revenue and 29.6% of total downloads.
- The United States leads global mobile gaming revenue with $5.71 billion, while India holds the largest share of global downloads at 15.29%.
- Platform performance remains split: Google Play dominates volume with 88.6% of total downloads, while the App Store captures 56.3% of total revenue.
- The RPG genre, while still the top revenue generator, saw a significant decline from $5.9 billion in H1 2022 to $4.4 billion in H1 2023.
- Gaming apps account for 56% of all mobile advertising creatives, with video content representing 72% of those assets.