Market Analysis
Documents
The State of Web Gaming Report 2026: A Data-Driven Guide to the Untold Reality of Contemporary Web Gaming
Web gaming is currently undergoing a significant renaissance, driven by a growing consumer preference for frictionless, instant-access experiences that bypass the cumbersome download and update requirements characteristic of traditional PC and console platforms. This shift reflects a broader evolution in gaming habits, where time-poor users increasingly favor rapid, cross-platform engagement. As of 2026, the sector has transitioned from a legacy medium into a high-value discovery layer, serving as a vital top-of-funnel acquisition tool for the wider gaming ecosystem.
Data indicates that web gaming audiences are remarkably engaged, with 37 percent of users playing multiple times daily. This high level of interaction is complemented by a strong conversion pipeline, as 62 percent of players eventually purchase or download titles they initially encountered through a browser. Despite these compelling metrics, a persistent perception gap remains among some developers who view the web as a low-quality channel. However, the industry is actively correcting this bias, with 53 percent of developers planning to port mobile titles to the web within the coming year to mitigate widespread discoverability challenges.
The global market for web gaming is characterized by low barriers to entry and high competition, yet HTML5 development provides a cost-effective strategy for reaching deeply engaged audiences. By leveraging the web as a primary discovery channel, developers can effectively bridge the gap between casual browser play and long-term ecosystem investment. Ultimately, the integration of web-based gaming into broader distribution strategies is no longer optional but a critical growth imperative for developers seeking to maintain relevance in an increasingly fragmented digital landscape.
- Web gaming has evolved into a primary top-of-funnel acquisition tool, with 62 percent of browser-based players eventually purchasing or downloading the titles they first encountered on the web.
- The web gaming audience demonstrates high retention, with 37 percent of users engaging with content multiple times per day.
- To combat mobile discoverability challenges, 53 percent of developers plan to port their mobile titles to the web within the next year.
- The shift toward web gaming is driven by a consumer preference for frictionless, instant-access experiences that eliminate the need for traditional platform downloads and updates.
- HTML5 development serves as a cost-effective strategy for developers to reach highly engaged audiences while navigating a market defined by low barriers to entry and high competition.
The State of Video Gaming: 2025
The global video game industry is currently undergoing a structural correction following a decade of rapid expansion that concluded in 2021. The primary thesis of this transition is that the industry’s previous growth engines—mobile expansion, live-service models, and pandemic-era engagement—have plateaued, leading to a 12% decline in real-term content spending. This downturn is characterized by widespread commercial underperformance, record-high layoffs, and a significant contraction in venture capital funding. As production budgets for AAA titles balloon toward $500 million, the market has become increasingly polarized, with player engagement and revenue heavily concentrated within a small cohort of long-standing, established franchises that effectively crowd out new releases.
Geographically and sectorally, the landscape is shifting as Chinese developers gain significant global market share, rising from 0.5% to 12.5% of non-domestic content spending over the last 13 years. While the mobile sector faces a 23% revenue drop due to privacy-related user acquisition costs and competition from social media, the industry is pivoting toward cross-platform accessibility and hardware-agnostic distribution. Platforms like Roblox and Steam continue to dominate engagement, though developers face increasing pressure from high platform commission fees and the necessity of navigating a saturated market where discovery is increasingly difficult.
Looking forward, the industry is attempting to mitigate these challenges through technological and business model innovation. Strategies include the integration of generative AI to enhance NPC behavior, the adoption of cloud-native simulations, and a strategic pivot toward programmatic advertising to supplement stagnant game pricing. Furthermore, regulatory pressures on app stores are expected to improve developer margins, while a resurgence in handheld hardware and cross-platform connectivity aims to unify fragmented ecosystems. Ultimately, the industry is moving toward a risk-averse, multiplatform approach, prioritizing long-term engagement and operational efficiency to survive an increasingly competitive and capital-intensive environment.
- The video game industry is undergoing a structural correction characterized by a 12% decline in real-term content spending following the post-2021 plateau of previous growth engines.
- Market polarization has intensified as AAA production budgets reach $500 million, causing revenue and engagement to concentrate within established franchises while crowding out new releases.
- Chinese developers have significantly expanded their global footprint, increasing their share of non-domestic content spending from 0.5% to 12.5% over the last 13 years.
- The mobile gaming sector has experienced a 23% revenue drop, driven by rising user acquisition costs linked to privacy regulations and increased competition from social media platforms.
- Industry players are shifting toward risk-averse, multiplatform strategies that leverage generative AI, cloud-native simulations, and programmatic advertising to counter stagnant game pricing and high production costs.

2026 Global Mobile Apps Marketing Trends
The 2026 mobile marketing landscape is defined by a fundamental transition from media-centric targeting to creative-driven acquisition, necessitated by tightening privacy constraints and the saturation of traditional advertising channels. Competitive advantage now hinges on the speed of creative iteration and the ability to unify product development, monetization, and distribution. By leveraging early behavioral signals to predict long-term value, industry leaders are successfully aligning short-term performance metrics with sustainable user lifecycle growth. This evolution is supported by a strategic shift toward AI-powered personalization and behavior-driven gamification, as non-gaming applications increasingly adopt the engagement tactics traditionally reserved for the mobile gaming sector.
Data from 2025 reveals a period of significant market consolidation, marked by a 16.7% decline in active advertisers alongside a 73.3% surge in creative output per advertiser. Playable ads have emerged as the premier format, consistently yielding the highest attention duration, scroll-stop rates, and conversion metrics. While the AI app sector experienced a sharp 48% contraction in the number of advertisers, top-tier players have responded by aggressively scaling localized marketing efforts. Simultaneously, the finance and health sectors have maintained greater stability, focusing on service-centric, medical-grade solutions and persuasive, value-based messaging to capture mature markets in North America and Europe.
Global strategies for 2026 prioritize a balanced media mix, typically favoring video content, while emphasizing hyper-local operations in emerging regions like Southeast Asia and the Middle East. Success in these diverse markets requires intensive user education and culturally nuanced, scenario-based ad updates. As the industry moves toward subscription-based models and on-device AI integration, the focus has shifted from mere technological development to the large-scale monetization of AI-enhanced user experiences. Ultimately, the market is moving toward a future of highly segmented, interactive, and performance-driven advertising that prioritizes technical precision and regulatory compliance to foster long-term user trust.
- The mobile marketing landscape has shifted from media-centric targeting to creative-driven acquisition, evidenced by a 73.3% surge in creative output per advertiser alongside a 16.7% decline in the total number of active advertisers.
- Playable ads are currently the top-performing format, consistently delivering the highest conversion metrics, scroll-stop rates, and attention duration.
- The AI application sector underwent a significant contraction in 2025, with the number of active advertisers dropping by 48%.
- Industry leaders are prioritizing the use of early behavioral signals to predict long-term user value, effectively bridging the gap between short-term performance metrics and sustainable lifecycle growth.
- Non-gaming applications are increasingly adopting engagement tactics from the mobile gaming sector, specifically utilizing AI-powered personalization and behavior-driven gamification.
The State of Video Gaming in 2025
The analysis demonstrates that global video‑gaming spend has surged to roughly $200 B in 2025, a 150 % rise since 2011, yet real‑term growth has stalled and margins have slipped to single digits. Mobile remains the only rapidly expanding segment, yet its revenue fell 23 % in Q1 2024 and download volumes dropped sharply after privacy deprecations, concentrating spend among a handful of high‑margin titles. Console sales have plateaued for a decade; Nintendo’s Switch drives modest growth while PlayStation and Xbox see flat or declining sales outside Japan, and AR/VR shipments underperform forecasts. PC and cloud‑based platforms such as Steam continue to dominate full‑game purchases, yet user engagement per capita remains low despite a 250 % rise in users and a 300 % increase in releases.
Geographic analysis shows China as the largest single market ($50–65 B) and India emerging as a significant contributor, together accounting for roughly 30 % of projected $300 B spend. Western developers capture about two‑thirds of growth, but Chinese and emerging‑market titles increasingly dominate the AAA landscape. Venture capital funding has contracted sharply—only 1,500 deals worldwide with a steep decline in late‑stage investments—and studios face record layoffs and shrinking publisher share prices, underscoring heightened risk.
The sector’s future hinges on non‑core, social‑centric platforms such as Roblox and UGC ecosystems that generate billions of engagement hours and pay developers substantial sums, albeit with limited autonomy. Cloud gaming, AI‑driven content, and ad‑supported SVOD models are emerging growth levers, yet rising development costs (AAA titles now exceeding $600 M) and thin operating margins continue to pressure publishers. Overall, the industry is in a state of consolidation, with blockbuster titles and platform‑centric ecosystems capturing most revenue while new entrants struggle to sustain momentum.
- Global gaming spend has reached $200 billion in 2025, representing a 150% increase since 2011, yet real-term growth has stalled and profit margins have compressed to single digits.
- Development costs for AAA titles now exceed $600 million, contributing to a landscape of record layoffs, shrinking publisher share prices, and a sharp contraction in venture capital funding to only 1,500 global deals.
- Mobile gaming revenue fell 23% in Q1 2024 following privacy deprecations, leading to a market where spend is increasingly concentrated among a small number of high-margin titles.
- China and India are becoming central to the industry's future, collectively accounting for approximately 30% of the projected $300 billion total market spend.
- While PC and platforms like Steam dominate full-game purchases, user engagement per capita remains low despite a 250% increase in the user base and a 300% rise in total game releases.
Mobile App Trends: 2026 Edition
The mobile app industry entered 2026 with significant momentum, characterized by a 10% year-over-year increase in global installs and a 7% rise in sessions throughout 2025. Consumer spending reached a record $167 billion, signaling a robust digital economy. This growth coincides with a fundamental technological shift where artificial intelligence has transitioned from an experimental feature to essential infrastructure for predictive segmentation and data analysis. Furthermore, the industry is moving away from a strictly mobile-first approach toward multi-platform strategies designed to capture fragmented consumer journeys across various devices. User privacy sentiment is also stabilizing, with App Tracking Transparency opt-in rates climbing to 38% by early 2026.
Sector-specific performance reveals a complex landscape of engagement and acquisition costs. While the global gaming population reached 3 billion in 2025, overall gaming installs remained flat as the cost per install rose 30% to $0.56. However, casual games outperformed the broader market with a 19% increase in installs and a 37% surge in sessions. In contrast, the e-commerce sector faced challenges as global installs fell by 10%, though Latin America emerged as a significant growth outlier with a 30% increase in user engagement. These trends suggest that while user acquisition is becoming more expensive in mature categories, specific genres and emerging markets continue to offer high-velocity growth opportunities.
The finance sector demonstrated unique resilience, with sessions increasing by 21% despite a slight decline in installs, reflecting the deep integration of digital wallets into daily consumer habits. Finance apps also led the shift toward paid acquisition, achieving a paid-to-organic ratio of 1.13 as costs per install decreased in most regions. As the industry moves through 2026, success is increasingly defined by retention-led growth and sophisticated cross-channel attribution. Future scalability will depend on the ability of developers to leverage AI-driven personalization and cross-device measurement to maintain engagement in an increasingly competitive and fragmented global market.
- The mobile app economy reached $167 billion in consumer spending in 2025, supported by a 10% year-over-year increase in global installs and a 7% rise in sessions.
- Gaming installs remained flat while costs per install surged 30% to $0.56, though casual games bucked the trend with a 19% increase in installs and a 37% rise in sessions.
- The industry is shifting from mobile-first to multi-platform strategies to address fragmented consumer journeys, supported by AI-driven predictive segmentation and cross-device measurement.
- Finance apps demonstrated high retention, with sessions increasing 21% and a paid-to-organic acquisition ratio of 1.13, even as overall installs for the sector declined.
- User privacy sentiment is stabilizing, with App Tracking Transparency opt-in rates rising to 38% by early 2026.
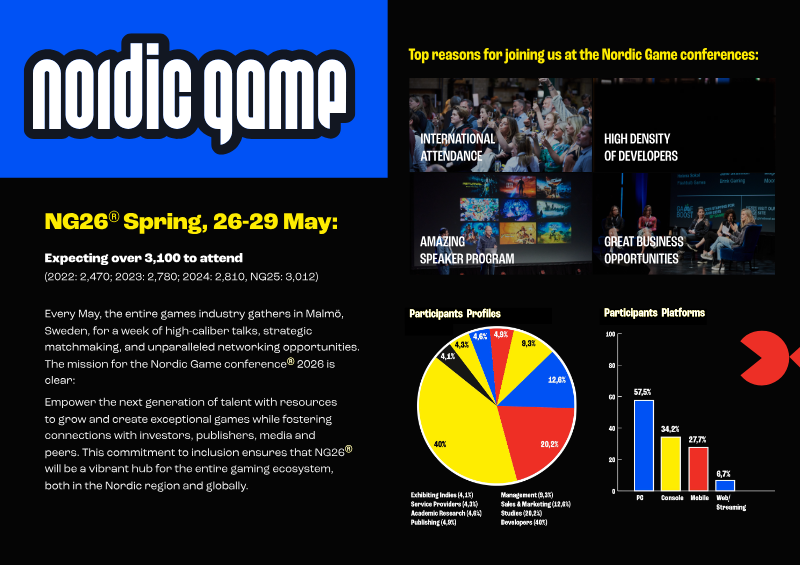
Nordic Game 2026: Participant Profiles and Platforms
Nordic Game 2026 serves as a primary hub for the Northern European video game industry, emphasizing a high density of developers and international attendance. The event facilitates business development and networking through a comprehensive speaker program, an expansive expo floor, and the annual Nordic Game Awards, which honors excellence among regional studios. The gathering targets a diverse range of industry professionals, including game startups, established studios, and service providers, with a specific focus on fostering connections between growing companies and global partners.
The participant base is heavily weighted toward production and leadership, with developers and artists making up the largest segment at 40% of all attendees. This is followed by professionals in sales and marketing at 12.6%, management at 9.3%, and service providers at 4.3%. Smaller contingents include exhibiting indies and various support roles. In terms of platform focus, PC remains the dominant sector for participants at 57.5%, followed by console development at 34.2% and mobile gaming at 27.7%. Web and other emerging platforms represent a smaller portion of the ecosystem at 6.7%.
The event infrastructure is designed to maximize return on investment through scalable exhibition options, ranging from small four-square-meter booths to large custom pavilions. Private meeting facilities are a core component of the offering, providing flexible spaces for four to fifty people to accommodate different business needs, from formal lectures to casual networking. By integrating sponsored content opportunities and specialized events like the Discovery Contest, the conference aims to support the entire lifecycle of game development within the Nordic region and beyond.
- PC development is the primary focus for 57.5% of Nordic Game 2026 participants, significantly outpacing console development at 34.2% and mobile gaming at 27.7%.
- Developers and artists constitute the largest attendee segment at 40%, followed by sales and marketing professionals at 12.6% and management at 9.3%.
- The event prioritizes business development by providing private meeting facilities that accommodate groups ranging from 4 to 50 people.
- Service providers represent 4.3% of the total participant base, which also includes a mix of startups, established studios, and exhibiting indies.
- Emerging platforms, including web-based gaming, account for 6.7% of the total development focus among conference attendees.

How to Build an Effective Offer System in Your Game
A well‑designed in‑game offer system is presented as the most potent driver of lifetime value and average revenue per paying user. By integrating a limited set of synergistic offer types—login bonuses, triggered prompts, endless streams, “1 + X” bundles, battle‑passes, stamp‑cards, and curated bundles—and optimizing their frequency, timing, pricing, segmentation, and economic balance, developers can achieve conversion rates as high as ninety‑six percent on login offers and lift repeat‑purchase value by roughly twenty percent through endless offers.
Conversion is shown to be a function of repeated exposure rather than a single impression; players typically require about seven viewings before taking action. The most effective moments to surface offers are at login, during “out‑of‑currency” events, after level failures, or in high‑momentum gameplay phases. A dynamic, tiered pricing ladder that escalates after each purchase and regresses after periods of inactivity—exemplified by a seven‑tier structure ranging from under one dollar to ninety‑nine dollars—enables precise alignment with player spend propensity while avoiding both under‑monetization of high‑potential users and alienation of low‑spenders.
Segmentation must extend beyond basic recency and frequency metrics to incorporate geographic tier, acquisition source quality, and player progression. Lower‑tier regions demand adjusted price ladders and reduced offer frequency, whereas high‑quality acquisition channels justify more complex bundles. Early‑game players respond best to inexpensive, simple offers, while mid‑ and late‑game users can be presented with higher‑value packages. Anchoring the entire shop around a stable, low‑priced entry pack establishes a reference point that shapes perceived value across all offers.
Collectively, these principles apply to mobile and casual games operating globally, reflecting current industry practices and data from recent case studies. Implementing the outlined framework promises measurable improvements in monetization efficiency, player satisfaction, and overall revenue performance.
- A tiered pricing ladder ranging from under $1 to $99, which escalates after purchases and regresses during inactivity, allows for precise alignment with individual player spend propensity.
- Conversion is driven by repeated exposure, with players typically requiring seven viewings of an offer before completing a purchase.
- Strategic implementation of a limited set of offer types can drive conversion rates as high as 96% on login offers and increase repeat-purchase value by approximately 20% through endless offers.
- Effective offer surfacing relies on high-intent moments, specifically at login, during out-of-currency events, after level failures, or during high-momentum gameplay.
- Player segmentation must incorporate geographic tier, acquisition source quality, and progression stage to adjust price ladders and offer frequency for different user profiles.
State of India Mobile App Market 2026 Report
India has solidified its position as the world’s largest mobile app market by volume, with annual downloads stabilizing at approximately 25 billion. The market is currently undergoing a structural transition from aggressive user acquisition toward habit-driven engagement and monetization. In-app purchase revenue surpassed $1 billion in 2025 and is projected to reach $1.25 billion by 2026. This financial growth is increasingly fueled by non-gaming sectors, specifically Utilities, Media, and Generative AI, alongside a notable rise in subscription-based models for premium digital services.
Geographically, the center of growth has shifted toward Tier-2 and Tier-3 cities, where localized services in beauty, apparel, and quick commerce are seeing outsized success. Quick commerce and food delivery have become dominant engines of daily habit, with engagement growing 55% year-over-year as platforms pivot toward retention-led strategies. In the mobility sector, the rise of affordable, localized options like bike taxis and autos reflects a broader consumer demand for cost-efficient digital solutions tailored to the Indian infrastructure.
The financial and entertainment landscapes are also evolving into mobile-first ecosystems. Fintech platforms now lead in engagement over traditional banks, with a strategic shift toward credit, lending, and investment services for younger demographics. In media, short-form video and "short drama" apps are outpacing traditional streaming platforms in both download growth and monetization efficiency. Ultimately, the Indian mobile economy is maturing into a value-led market where success is defined by high-frequency utility, social discovery, and the integration of AI tools into daily routines.
- India remains the world’s largest mobile app market by volume with 25 billion annual downloads, shifting focus from user acquisition to habit-driven engagement and monetization.
- In-app purchase revenue is projected to reach $1.25 billion by 2026, driven increasingly by non-gaming sectors like Utilities, Media, and Generative AI.
- Quick commerce and food delivery platforms have seen a 55% year-over-year increase in engagement as they transition toward retention-led strategies.
- Growth is shifting toward Tier-2 and Tier-3 cities, where localized services in beauty, apparel, and quick commerce are achieving outsized success.
- Fintech platforms are outpacing traditional banks in engagement by targeting younger demographics with credit, lending, and investment services.
State of Digital Advertising India 2026
The analysis presents a comprehensive overview of India’s digital‑advertising landscape, emphasizing its rapid expansion and the shifting strategic focus of advertisers. In 2025 the market surpassed the $4 billion threshold and is projected to exceed $5 billion in 2026, reflecting robust demand across multiple verticals. Shopping emerged as the dominant category, accounting for 28 % of total spend and delivering an 18 % year‑on‑year increase, while software recorded the strongest growth rate at 84 % YoY. Food‑and‑dining services and automotive sectors also posted notable gains of 38 % and 4 % respectively, underscoring a diversified expansion beyond traditional e‑commerce.
The competitive environment is concentrated among a handful of large advertisers, with Flipkart, Amazon and Reliance leading in impression share. A clear strategic shift is evident toward performance‑driven, audience‑specific creative, as brands increasingly deploy tailored messaging to capture high‑yield, short‑duration placements. This trend intensifies during the festive half‑year, when domestic players in generative‑AI services, food‑delivery, and film promotion amplify spend on segment‑focused creatives to maximize visibility.
Overall, the findings illustrate that India’s digital‑advertising ecosystem is entering a phase of accelerated growth, driven by both expanding spend in core categories and a pronounced move toward data‑centric, personalized creative execution. The outlook suggests continued market deepening, with advertisers likely to prioritize precision targeting and seasonal intensity to sustain momentum through 2026.
- India’s digital advertising market surpassed $4 billion in 2025 and is projected to exceed $5 billion in 2026.
- Shopping remains the dominant advertising category, representing 28% of total spend with an 18% year-on-year increase.
- Software recorded the highest growth rate among all sectors, surging 84% year-on-year.
- Flipkart, Amazon, and Reliance currently hold the largest share of advertising impressions in the market.
- Food-and-dining services and the automotive sector posted notable growth of 38% and 4% respectively.
State of African Games 2026
The analysis delivers a data‑driven overview of African‑developed video games, concentrating on performance across global platforms—primarily Steam, with supplemental PlayStation and Xbox data—from 2015 through 2025. Its central thesis is that the continent’s game‑development ecosystem is emerging rapidly yet remains highly concentrated, especially in South Africa, and is transitioning from volume‑driven growth to a focus on higher‑quality, strategically positioned titles.
South Africa accounts for the overwhelming share of both developers and commercial success, supplying all titles in the top‑ten sales list and driving the continent’s 2 % share of Steam unit sales—higher than the Middle East and comparable to Oceania. Releases peaked in 2023 with 23 Steam titles before falling to 11 in 2025, suggesting a shift toward longer development cycles. Genre analysis reveals a mismatch: simulation games achieve the highest median sales (≈372 k units), followed by adventure and RPGs, while action titles dominate the release count. Pricing follows global indie norms, with most games priced between $5.99 and $19.99; premium pricing above $21.99 appears in only a small fraction of titles. Unity is the leading engine (≈18 % of releases), Unreal accounts for about 7 %, and the remaining 73 % use a diverse set of smaller tools, reflecting a decentralized technical landscape.
Methodologically, the study relies on Video Game Insights estimations for games launched after 1 January 2015, employing internal sales‑estimation algorithms that convert review counts and apply the Boxleiter method to infer unit sales and revenue. The scope encompasses all major platforms, covers the entire African continent, and isolates trends in genre, pricing, engine choice, and geographic distribution.
Conclusions point to a transitional phase where success will depend less on release volume and more on distinctive cultural content, genre diversification, and broader support structures beyond South Africa. If these dynamics persist, the African game‑development sector is poised to evolve from an emerging participant to a recognized creative force within the global industry.
- South Africa dominates the African game development sector, accounting for all top-ten selling titles and contributing to a 2% share of global Steam unit sales.
- The industry is shifting from volume-driven growth to longer development cycles, evidenced by a decline in annual Steam releases from a peak of 23 in 2023 to 11 in 2025.
- There is a significant genre mismatch in the market, as action titles dominate release volume while simulation games achieve the highest median sales at approximately 372,000 units.
- The technical landscape is highly decentralized, with Unity powering 18% of releases and Unreal Engine 7%, while 73% of titles rely on a diverse range of smaller development tools.
- Pricing for African-developed titles remains aligned with global indie norms, with the vast majority of games priced between $5.99 and $19.99 and very few exceeding $21.99.
The Value of Esports in the UK
The study demonstrates that the United Kingdom’s esports industry has experienced robust growth, expanding at an average annual rate of 8.5 % between 2016 and 2019. In 2019 alone, the sector generated approximately £60 million in revenue—about eight per cent of global esports earnings—and contributed £111.5 million to the national Gross Value Added, supporting more than 1,200 full‑time equivalent jobs. These figures underscore the sector’s role as a significant driver of the UK digital creative economy.
Key drivers identified include the proliferation of professional teams, high‑profile tournaments hosted by organisations such as ESL, Gfinity and Epic.LAN, and the rise of streaming platforms that have broadened audience reach. Dedicated venues like Belong Gaming Arenas further stimulate grassroots participation and local economic activity. Modelling of direct, indirect and induced effects reveals a total impact of roughly 216 FTEs and £19.5 million in GVA, while spill‑over benefits from event tourism—estimated at £234 k per 1,000 visitors and nearly five FTEs—highlight additional value for host communities.
The analysis projects that hosting a major global esports event could add 238 full‑time equivalents and £12 million in GVA to the UK economy, signalling substantial upside potential. The findings point to opportunities for further investment, clearer regulatory frameworks and strategic positioning to attract international events, thereby consolidating esports as a pivotal growth sector within the United Kingdom’s broader digital economy.
- In 2019, the UK esports industry generated £60 million in revenue and contributed £111.5 million to the national Gross Value Added (GVA), supporting over 1,200 full-time equivalent (FTE) jobs.
- The sector experienced robust growth between 2016 and 2019, expanding at an average annual rate of 8.5%.
- Hosting a single major global esports event is projected to add £12 million in GVA and 238 FTE jobs to the UK economy.
- Event tourism provides significant spill-over benefits, estimated at £234,000 in economic value and nearly five FTEs per 1,000 visitors.
- Key industry drivers include professional tournament organizers such as ESL, Gfinity, and Epic.LAN, alongside the expansion of streaming platforms and physical infrastructure like Belong Gaming Arenas.

Esports 2023: Challenges and Opportunities in the UK
The report argues that the United Kingdom’s esports sector has evolved from a fragmented niche into a rapidly professionalised ecosystem, yet it still requires coordinated investment and policy to sustain growth. Key findings show an audience of roughly 55 million adults, with 82.7 % aged 18‑34 and a male dominance of 83 %. While shooters such as Call of Duty, CS:GO and Fortnite command the largest viewership, only 3.8 % of gamers follow competitive play, revealing a small “iceberg” of engaged fans. This gap highlights opportunities for talent development and global brand expansion, especially as the UK lags behind U.S. and Asian markets in producing top‑tier professionals.
Economic data underscore the sector’s momentum: gross value added reaches £111 million and sponsorship revenue exceeds $1.38 billion, with UK events and teams capturing a $1.5 billion share of the global market. Major brands—Intel, Red Bull, Saudi PIF—and tournament operators such as ESL, FACEIT and Gfinity are driving investment, while infrastructure projects by XLHQ, Royal Ravens and Cloud9 create dedicated studios and community hubs. Educational initiatives, including a BTEC programme with Pearson and university leagues like NUEL, demonstrate that esports can boost computing engagement and skill development among 10 000 pupils.
Despite these gains, challenges persist. Mainstream media coverage remains limited, and government support is uneven, constraining broader recognition of esports as a legitimate sport. Diversity and inclusion remain under‑addressed, with female participation at 17 % and a need for stronger links between education, industry and policy to create sustainable career pathways. Emerging monetisation models—Web3, NFTs, metaverse experiences—offer new revenue streams but require regulatory clarity and infrastructure investment. Coordinated action across stakeholders is essential to unlock the UK’s full economic and cultural potential in esports.
- The UK esports sector generates £111 million in gross value added, with UK-based teams and events capturing a $1.5 billion share of the global market.
- While the UK has a potential audience of 55 million adults, only 3.8% of gamers follow competitive play, indicating a significant opportunity for fan base expansion.
- The demographic profile of the UK esports audience is highly concentrated, with 82.7% aged 18–34 and 83% male, highlighting a need for improved diversity and inclusion efforts.
- Major investment is being driven by global brands like Intel, Red Bull, and the Saudi PIF, alongside infrastructure developments from organizations such as XLHQ, Royal Ravens, and Cloud9.
- Educational initiatives, including a Pearson BTEC programme and the NUEL university league, are currently engaging 10,000 pupils in computing and skill development.