Showing 30 of 654 results · 1.28s
Jan 2020
Europe's Video Game Industry: Key Facts 2020
Interactive Software Federation of Europe
generated through in-game extras and downloadable content. Console gaming remains the leading hardware category by revenue at 43%, closely followed by mobile and tablets at 40%. Demographic
Report20 pages
Jan 2023
Gaming Spotlight 2023 Review
data.ai
global gaming market in 2023 was defined by a complex interplay between mobile contraction and steady growth in the PC and console sectors. While mobile remains the industry
Report33 pages
Financial Highlights: 1st Quarter of the Fiscal Year Ending March 2016
Koei Tecmo
billion, reflecting higher profitability across most segments. Game software sales led the increase at 10.7%, followed by online & mobile (−2.9%) and media & rights (+12.5%). Pachislot & pachinko sales rose
Report2 pages
Jun 2026
The 2026 State of Web Gaming Report: A Study of Developer and Gamer Perceptions
Poki
monthly on games, underscoring a highly engaged, high‑spending audience. Ninety percent of players find games online, yet only 53 % of studios plan to port mobile titles
Report22 pages
Game no Yakusoku Communication Book
CESA – Computer Entertainment Supplier's Association
safe and responsible gaming. It emphasizes that while the technology and accessibility of games have shifted from television-bound consoles to ubiquitous mobile and cross-platform devices
Report2 pages
Jan 2025
Essential Facts: About the U.S. Video Game Industry 2025
Entertainment Software Association
social and developmental role of gaming within American households. Approximately 82% of gaming parents play with their children, and 67% believe video games offer more potential benefits than
Report23 pages
Jan 2025
Africa Games Industry Report 2025
Maliyo Games
global titles like Candy Crush and PUBG Mobile within the region, signal increasing integration into the global gaming economy. Despite these advancements, the industry faces substantial structural
Report72 pages
May 2026
State of the LATAM Games Industry 2026
GamesBeat, Xsolla
fostering trust and prioritizing accessibility, the Latin American gaming sector is effectively countering the stagnation currently impacting global mobile markets, establishing itself as a vital, influential player
Report33 pages
Dec 2023
Gaming Industry Report: Global & MENAP Outlook Q4 2023
Shorooq Partners
convergence of emerging technologies—virtual reality, artificial intelligence, mobile platforms, quantum computing, GPU‑as‑a‑Service, and cloud gaming—which together are accelerating content creation, distribution, and consumption
Report30 pages
Sep 2023
Gaming Deals Report: 2023 Q3
InvestGame
methodology relies on tracked closed transactions across PC, console, mobile, and multiplatform segments, excluding pure gambling and non-gaming blockchain ventures. While the current landscape is defined
Report16 pages
Jan 2021
2021-2025 Mobile Market Forecast
Sensor Tower
structural shift is underway as non-game applications increasingly drive revenue, with projections indicating that non-gaming spend will surpass gaming revenue on the App Store
Report53 pages
Mar 2024
Brazilian Gaming Industry Report 2023
Abragames
shift toward multi-platform strategies, with computers and mobile devices serving as the primary targets for the 1,009 games produced in 2022. While 93% of studios develop
Report171 pages
Jan 2025
Gaming 2025 (Epyllion)
Epyllion
third-party storefronts. By 2030, nearly one billion mobile devices will be capable of running high-fidelity console-spec games, positioning emerging regional markets as the primary engine
Report224 pages
Jan 2021
Newzoo's Generations Report: How Different Generations Engage with Games 2021
Newzoo
including Gen X and Baby Boomers, primarily utilize games for casual relaxation, often preferring single-player experiences on mobile devices. The research also identifies a growing trend toward
Report21 pages
Jan 2022
Multiplayer Report 2022
Unity
South Korea—representing a significant portion of global gaming revenue. The analysis segments the industry into various categories, including mobile, PC, and console platforms, while distinguishing between casual
Report26 pages
Jan 2025
Power of Play: Informe Global de Videojuegos 2025
AEVI
regions, a majority of players report gaming primarily for fun (56 %), stress relief (55 %) and mental stimulation (46 %). Mobile devices dominate usage (55 % of respondents), followed by PCs/laptops
Report64 pages
Financial Highlights: Fiscal Year Ending March 2011
Koei Tecmo
million in FY2009, driven mainly by declines in game software sales (‑6.6 %) and media & rights revenue (‑44.7 %). Conversely, online & mobile sales grew 14.9 %, and pachislot & pachinko revenue increased
Report1 pages
Jan 2021
Newzoo Metaverse Report 2021
Newzoo
focus on safety and open standards. Ultimately, the games industry is positioned to lead the development of a mobile-accessible, community-driven metaverse that complements physical reality through
Report71 pages
Sales for the 2024/25 Financial Year: Nacon
Nacon
million; the “Other” segment, comprising mobile and audio sales, expanded 38 % to €5.6 million. The fourth‑quarter gaming output was limited to two titles, Rugby25™ and Ambulance Life
Report2 pages
Annual Report 2006
Square Enix
Games (Offline) 36.9% 2005 Net Sales Ratio Net Sales (Billions of yen) Games (Online) 12.6% 2005 Net Sales Ratio Net Sales (Billions of yen) Mobile Phone Content
Report68 pages
Oct 2024
Game Development Studie 2024: Die wirtschaftliche Bedeutung der österreichischen Spieleentwicklungsbranche, ihre Dynamiken und Einflüsse auf die Gesamtwirtschaft
PGDA – Pioneers of Game Development Austria
respondents), while serious and educational games have gained prominence (29 % and 30 %). Development focuses on PC and mobile platforms, with Unity used by 55 % of firms. The workforce
Report13 pages
Jan 2021
Tower Defense Games 2020 Industry Snapshot
GameAnalytics
genre within the mobile arcade category demonstrated significant monetization potential and engagement depth throughout 2020. Based on an analysis of over 134,000 integrated games and 900 million
Report8 pages
Jan 2025
Playing to Win: 2025 Digital Game Advertising Report
Sensor Tower
releases such as Battlefield 6 and Valorant Mobile. This landscape reflects a shift where major publishers like Microsoft and Dream Games utilize aggressive spending to maintain market share
Report39 pages
Jan 2022
Key Insights Into American Gamers
Newzoo
engage with video games. While 71% of the population plays games, there is a significant overlap with viewership, as 44% of the population watches gaming video content
Report11 pages
Jan 2025
What Does the Monetization Landscape Look Like for Video Games in MENA?
Xsolla
rewards. Findings indicate that 53% of paying mobile and PC gamers in the region have already made purchases through official game websites. Successful market entry requires a tailored
Report19 pages
Asia Pacific Market Report 2025: Creating Opportunities for Video Games in Asia
GamesBeat, Xsolla
insight, sharp localization, and adaptability to mobile‑first dynamics are the keys to unlocking opportunities in Asia’s rapidly evolving gaming market
Report36 pages
May 2025
2025 GDC Trends Report: Connecting the World Through Games
Game Developers Conference
more efficient cross-platform distribution. The mobile sector reflects this shift, with narrative-driven advertising propelling the in-game ad market to $100 billion in 2024, officially surpassing
Report37 pages
Jan 2025
The Future Of NPCs: What Gamers Demand From Next-Gen Characters
Inworld AI
range of players across PC, console, mobile, and VR platforms, spending an average of five to eight hours per week gaming. Ultimately, the data suggests that moving away
Report33 pages
Apr 2023
The 50-Plus Gamer of Today and Tomorrow
AARP
reach 12 hours per week. While mobile remains the dominant platform due to the popularity of puzzle, card, and word games, there is a notable increase in console
Report68 pages
Aug 2024
U.S. Gamer Segmentation 2024 Edition
Circana
over a six-month period. Mobile remains the most pervasive platform, used by 65% of the total population, while console gaming has seen the most significant growth
Report23 pages

Europe's Video Game Industry: Key Facts 2020
Interactive Software Federation of Europe
Jan 202020 pages3k words
Summary
The European video games industry experienced steady growth in 2019, reaching a total market turnover of €21.6 billion. This represents a 3% year-on-year increase and a 55% rise since 2014 across key markets. Revenue is increasingly driven by digital ecosystems, with online and app-based income accounting for 76% of the market, while physical sales represent 24%. Within the online segment, 66% of revenue is generated through in-game extras and downloadable content. Console gaming remains the leading hardware category by revenue at 43%, closely followed by mobile and tablets at 40%.
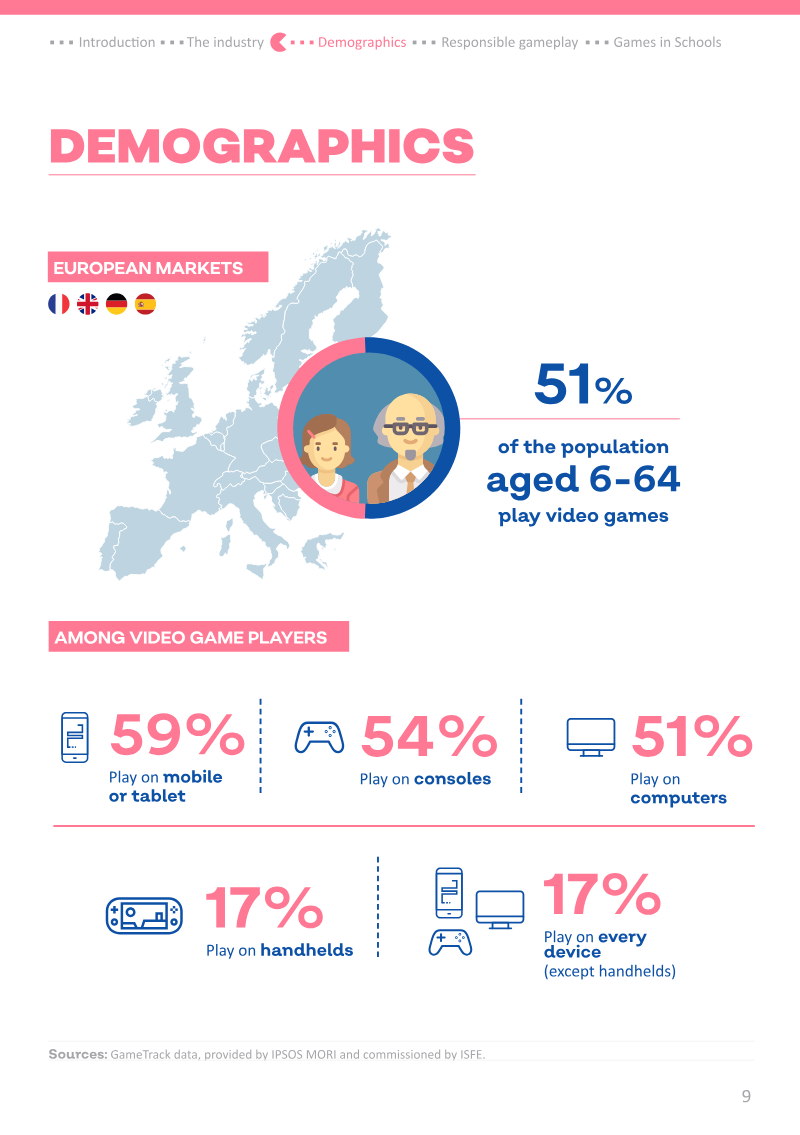
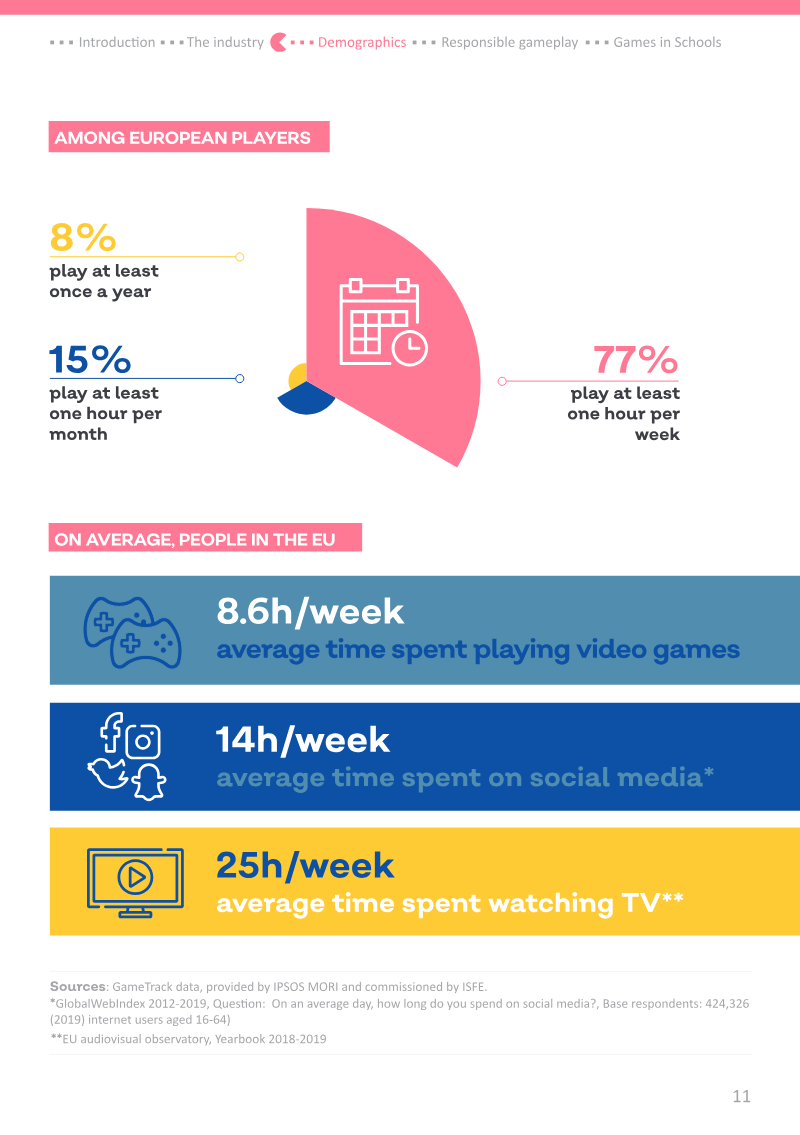
Demographic data indicates that 51% of the European population aged 6 to 64 plays video games, with an average player age of 31. While engagement is highest among younger cohorts, 31% of those aged 45 to 64 are active players. Gender representation is nearly balanced, as women make up 45% of the player base and over half of all mobile gamers. On average, European players spend 8.6 hours per week gaming, significantly less than the time spent on social media or television.
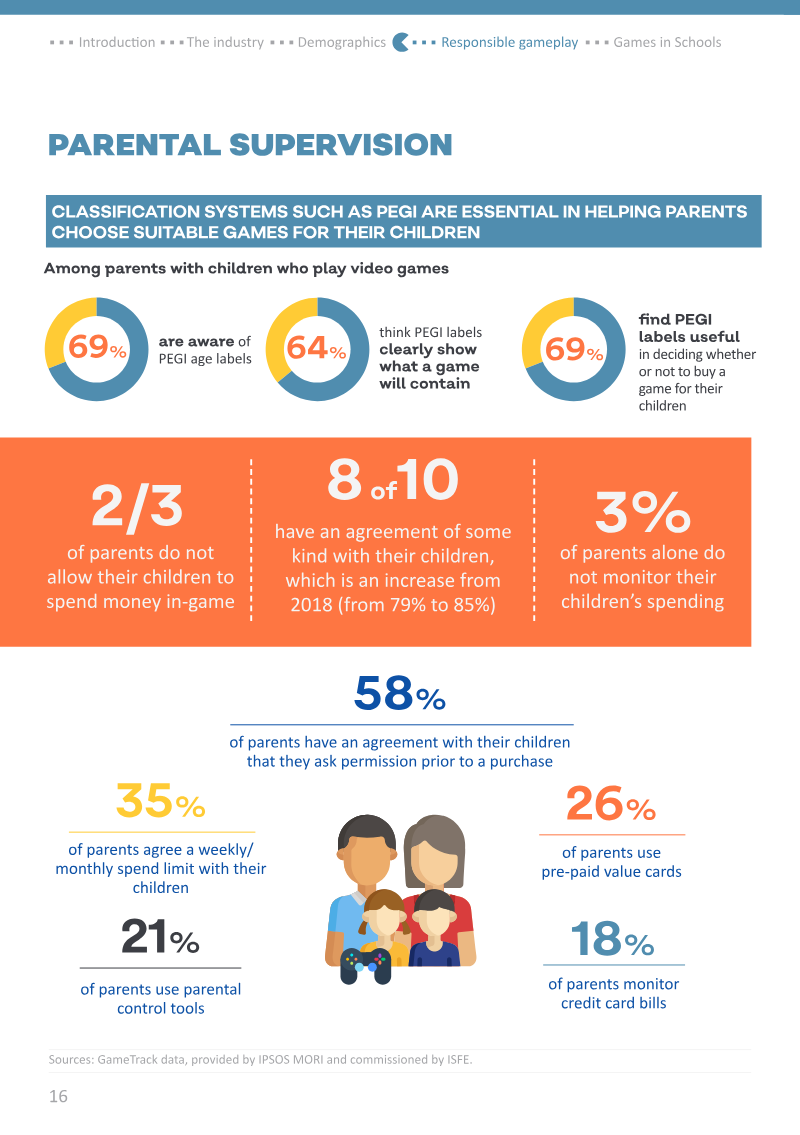
The industry maintains a strong focus on responsible gameplay through the PEGI age rating system, which is active in over 35 countries. Approximately 67% of parents are aware of these labels, and 85% have established agreements with their children regarding in-game spending. Beyond consumer protection, the sector is expanding its educational footprint. Initiatives like the Games in Schools project, conducted with European Schoolnet, have trained over 4,000 teachers across 73 countries to integrate commercial games into pedagogical frameworks.
Data for these findings was primarily extrapolated from the 2019 GameTrack and Newzoo reports, utilizing surveys and sales tracking across major European territories including France, Germany, Italy, Spain, and the United Kingdom. The scope covers the 2019 calendar year while acknowledging the emerging impact of the COVID-19 pandemic on 2020 industry trends.
Pages


Insights
- The European video game market reached €21.6 billion in 2019, marking a 3% year-on-year increase and a 55% total growth since 2014.
- Digital ecosystems dominate the market, accounting for 76% of total revenue, with 66% of that online income derived specifically from in-game extras and downloadable content.
- Hardware revenue is split primarily between consoles at 43% and mobile/tablet devices at 40%.
- The European player base is 51% of the population aged 6 to 64, with an average age of 31 and a gender split of 55% male and 45% female.
- Engagement remains consistent across age groups, with 31% of individuals aged 45 to 64 identifying as active gamers.
AMONG VIDEO GAME PLAYERS