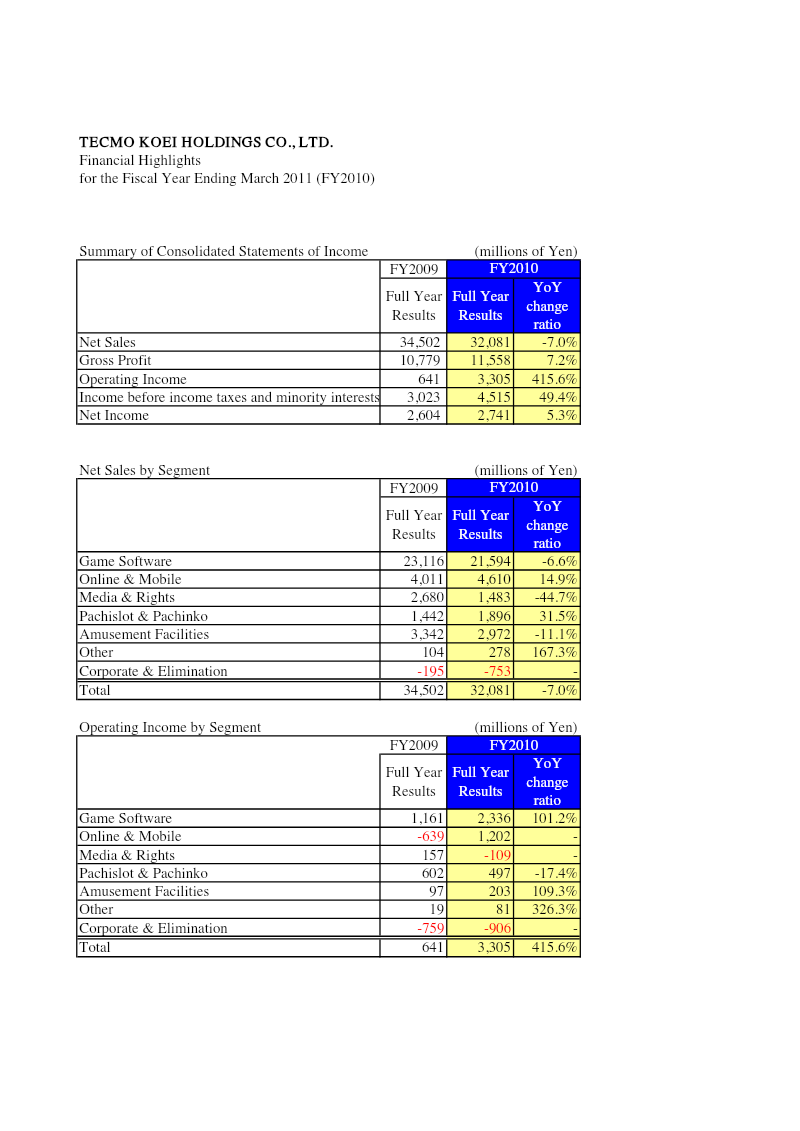
Tecmo Koei Holdings achieved a 415.6% surge in operating income to ¥3,305 million for the fiscal year ending March 2011, despite a 7% decline in net sales to ¥32,081 million.
Profitability improved significantly through cost efficiencies and high-margin performance, resulting in a 49.4% increase in income before taxes and minority interests to ¥4,515 million.
The core game software segment saw a 6.6% decline in sales but experienced a 101.2% jump in operating income, indicating a shift toward more profitable operations.
Revenue diversification efforts showed mixed results, with online & mobile sales growing 14.9% and pachislot & pachinko revenue rising 31.5%, though the latter saw a 17.4% decline in operating income.
The 'Other' business segment, focused on new initiatives, demonstrated strong growth with a 167.3% increase in sales to ¥278 million and a 326.3% rise in operating income.
Media & rights revenue performed poorly, dropping 44.7% and contributing negatively to the company's overall operating income for the fiscal year.
Financial highlights for the fiscal year ending March 2011 show a mixed performance for Tecmo Koei Holdings. Net sales fell 7 % to ¥32,081 million from ¥34,502 million in FY2009, driven mainly by declines in game software sales (‑6.6 %) and media & rights revenue (‑44.7 %). Conversely, online & mobile sales grew 14.9 %, and pachislot & pachinko revenue increased 31.5 %. The “Other” segment, largely comprising new or restructured businesses, surged 167.3 % to ¥278 million.
Operating income expanded dramatically by 415.6 %, rising from ¥641 million to ¥3,305 million. This surge was largely due to a 101.2 % jump in game software operating income and a 109.3 % increase in amusement facilities, offset by declines in pachislot & pachinko (‑17.4 %) and media & rights (negative contribution). The “Other” segment contributed a 326.3 % increase in operating income, reflecting successful new initiatives.
Income before taxes and minority interests grew 49.4 % to ¥4,515 million, while net income increased modestly by 5.3 % to ¥2,741 million. The company’s profitability improved despite lower sales volumes, largely through cost efficiencies and higher-margin segments.
The analysis covers Japan‑based operations for FY2010, using consolidated financial statements. Data are presented in millions of yen, with year‑over‑year comparisons highlighting key segment shifts and overall profitability trends.