Report30 pages
Mobile Game Genre Report: Role-Playing Games 2021
Role-playing games represent the most lucrative segment of the global mobile gaming market, generating $18.5 billion in 2020 and accounting for nearly a quarter of all mobile gaming revenue. This market is geographically concentrated in East Asia, where China, Japan, and South Korea collectively generate over 70% of the genre's global earnings. The landscape is characterized by the dominance of domestic publishers and a heavy reliance on established intellectual properties from movies, literature, and PC ports, which account for approximately half of the top-performing titles. The Marvel franchise serves as a primary example of this trend, exerting a pervasive influence on player acquisition and revenue generation through its immense brand saturation.
While IP-based titles leverage organic recognition, original properties must utilize aggressive influencer marketing and high-quality creative advertisements to compete. Long-term sustainability in the genre is driven by consistent content updates, social competitive mechanics, and time-limited gacha systems. Although in-app purchases remain the primary revenue driver—particularly among high-income male audiences—there is a significant shift toward hybrid monetization. Approximately 83% of players now accept non-disruptive rewarded video ads as a means to progress without direct spending.
To navigate evolving privacy regulations and tracking challenges, developers are increasingly prioritizing high-value user signals within the first 24 hours of gameplay. Interactive playable ads have emerged as a highly effective acquisition tool, occasionally increasing eCPMs by over 200%. By combining traditional spending triggers like battle passes and limited-time events with sophisticated ad integration, publishers are successfully monetizing both high-spending "whales" and non-paying users to maintain growth in an increasingly competitive global market.
- Mobile RPGs generated $18.5 billion in 2020, representing nearly 25% of total mobile gaming revenue.
- The market is heavily concentrated in East Asia, with China, Japan, and South Korea accounting for over 70% of global RPG earnings.
- Approximately 50% of top-performing RPG titles rely on established intellectual properties, such as the Marvel franchise, to drive player acquisition and revenue.
- Hybrid monetization is becoming standard, with 83% of players accepting non-disruptive rewarded video ads as an alternative to direct in-app purchases.
- Interactive playable ads have become a critical acquisition tool, capable of increasing eCPMs by more than 200%.
+5
PangleJan 2021

Presentation44 pages
1Q FY2021 Presentation Material: October to December 2020
CyberAgent achieved record-high consolidated sales of 131 billion yen during the first quarter of fiscal year 2021, representing a 13.3% year-over-year increase. This growth was primarily propelled by the Media and Advertising segments, offsetting a temporary downturn in the Game business. While the Game segment saw revenue decline 15% to 29.9 billion yen and operating profit drop 77.8% due to seasonal factors and elevated marketing expenditures, the company maintained a strong financial foundation with 252 billion yen in total assets. This performance establishes a solid trajectory toward meeting full-year targets despite the mixed results across different business units.
The Media segment emerged as a significant growth engine, with ABEMA driving a 67% surge in revenue to 20.4 billion yen. This expansion was supported by a premium subscriber base exceeding 921,000 users and an elevenfold increase in transaction volume for the WINTICKET platform. To capitalize on this momentum, the company restructured ABEMA into distinct Free and Premium business units. Simultaneously, the Game business prepared for a recovery through the high-profile launches of titles such as Uma Musume Pretty Derby and NieR Re[in]carnation, signaling a strategic focus on high-quality content to stabilize future earnings.
Corporate strategy remains centered on governance and technological adaptation within the Japanese market. The organizational structure utilizes a clear distinction between supervision and execution, supported by a board of eight directors that includes significant outside representation. By emphasizing environmental data disclosure and the integration of artificial intelligence within advertising and media functionality, the company aims to align with modern ESG standards. These initiatives, framed within the context of the New Normal, reflect a commitment to long-term sustainability and operational agility in a rapidly evolving digital landscape.
- CyberAgent achieved record-high consolidated sales of 131 billion yen in 1Q FY2021, a 13.3% year-over-year increase driven by strong performance in the Media and Advertising segments.
- The Media segment grew revenue by 67% to 20.4 billion yen, bolstered by ABEMA’s premium subscriber base exceeding 921,000 users and an elevenfold increase in WINTICKET transaction volume.
- The Game business experienced a 15% revenue decline to 29.9 billion yen and a 77.8% drop in operating profit, attributed to seasonal factors and increased marketing spend.
- To drive future earnings recovery, the company is focusing on high-quality content launches, specifically Uma Musume Pretty Derby and NieR Re[in]carnation.
- Management restructured ABEMA into separate Free and Premium business units to better capitalize on current growth momentum.
+1
CyberAgentJan 2021

Report52 pages
Go Global Mobile Game: New Insights
During the first half of 2021, China-headquartered publishers ascended to the global leadership position in the mobile gaming market, capturing 23% of overseas consumer spend. This 47% year-over-year growth resulted in $8 billion in revenue, driven by a strategic expansion into both established markets like Germany and emerging regions such as Chile and Egypt. The industry landscape is currently defined by a shift toward hybridization, where developers integrate casual mechanics into core genres to broaden audience appeal and sustain engagement.
The 4X March-Battle subgenre remains a dominant global force, leading consumer spend across major economies including the United States and the United Kingdom. While mature titles in the 4X and M3-Meta categories continue to drive massive revenue growth, emerging opportunities are surfacing in high-growth subgenres like Luck Battle and Merge Saga. These "Score Leaders" demonstrate significant increases in consumer spending despite declining download rates, suggesting a market pivot toward deeper monetization of existing user bases rather than raw acquisition.
The market is also experiencing a surge in specialized categories, most notably the Idol Training subgenre, which saw triple-digit growth in both spending and downloads during the first half of the year. In contrast, Puzzle RPGs faced declines in performance, likely due to shifting privacy policies impacting user acquisition strategies. To navigate these fluctuations, publishers are increasingly leveraging "Nijigen" or anime-style aesthetics and gacha monetization models. By combining these thematic elements with cross-subgenre mechanics and social features, developers are successfully maintaining competitive advantages in an increasingly crowded global marketplace.
- China-headquartered publishers captured 23% of overseas mobile gaming consumer spend in H1 2021, achieving $8 billion in revenue and 47% year-over-year growth.
- Developers are increasingly adopting a hybridization strategy, integrating casual mechanics into core genres to broaden audience appeal and improve user engagement.
- The 4X March-Battle subgenre remains the leading driver of consumer spend in major markets like the United States and the United Kingdom.
- High-growth subgenres such as Luck Battle and Merge Saga are seeing increased consumer spending despite declining download rates, signaling a shift toward deeper monetization of existing users.
- The Idol Training subgenre experienced triple-digit growth in both spending and downloads during the first half of 2021.
+1
data.aiJan 2021

Report24 pages
Games Marketing Insights for 2021
This analysis examines the shifting landscape of the global gaming industry following the COVID-19 pandemic, focusing on player motivations, monetization, and community engagement. The primary thesis asserts that the pandemic catalyzed a permanent expansion of the gaming audience, introducing a "new gamer" cohort that differs significantly from existing players in demographics and behavior. While existing players increased their time spent gaming, they became less likely to spend money, whereas new players emerged as a high-value segment with a greater propensity for in-game purchases.
The findings are based on a July 2020 survey of 13,246 mobile gamers across nine markets, including the United States, United Kingdom, Germany, and South Korea. Data indicates that the mobile gaming audience grew by 28 million in the US and 8.6 million in the UK. In Western markets, these new players are significantly younger than existing ones and gravitate toward "core" genres like shooters and strategy rather than casual puzzles. Conversely, South Korea proved an anomaly, where new gamers are older and prefer casual titles. Across all regions, new gamers play more hours per week than veterans and are more open to social features, such as multiplayer modes and in-game chatting.
The industry saw a massive shift toward digital discovery and community. Live-streaming platforms experienced record growth, with Facebook Gaming surpassing one billion hours watched in Q3 2020. Furthermore, 70% of consumers reported increased mobile device usage, making mobile-first discovery essential. A critical finding for marketers is the rising importance of brand familiarity; less than a quarter of players in the US, UK, and Germany tried games they had never heard of, suggesting that title recognition and IP strength are now as vital for mobile games as they are for the console market.
To navigate these shifts, the analysis recommends a mixed monetization model that balances ad-supported content with in-app purchases to capture diverse spending habits. It concludes that developers must embrace "always-on" marketing and community management, as players are increasingly seeking engagement through social media groups and streaming partnerships outside of the game client itself.
- The pandemic triggered a significant expansion of the gaming audience, adding 28 million mobile players in the US and 8.6 million in the UK by July 2020.
- New gamers represent a high-value segment with a greater propensity for in-game purchases compared to veteran players, who increased their playtime but decreased their spending.
- Brand familiarity is critical for acquisition, as fewer than 25% of players in the US, UK, and Germany are willing to try games they have not heard of previously.
- New gamers in Western markets are younger and prefer core genres like shooters and strategy, while new gamers in South Korea are older and favor casual titles.
- Live-streaming platforms saw record growth during the pandemic, with Facebook Gaming exceeding one billion hours watched in Q3 2020.
+1
KingJan 2021

Whitepaper61 pages
The 2021 Global Mobile Gamers Whitepaper
Mobile gaming has emerged as the primary driver of the global games market, generating $93.2 billion in 2021 and accounting for over half of total industry revenue. This segment is projected to reach $116.1 billion by 2024, fueled by expansion in emerging markets and the integration of social metaverse experiences. Within this landscape, short-video platforms have become essential hubs for player engagement, with nearly half of mobile gamers across thirteen key global markets utilizing these platforms to discover and share content.
Users on these platforms represent a high-value demographic that outperforms the average gamer in nearly every engagement metric. These players install 50% more games, spend 36% more time playing weekly, and engage with a significantly broader variety of genres. Their behavior is characterized by a high propensity for spending, particularly on progression-based purchases and in-game add-ons. This audience acts as a community of evangelists, twice as likely as non-users to discover new titles through social video content and subscription services, making them a critical target for strategy and MOBA developers.
Geographic analysis reveals distinct regional preferences in art styles and mechanics. While realistic aesthetics maintain global dominance, Asian markets show a unique affinity for anime and "cute" art styles, alongside a higher tolerance for randomized reward systems like gacha. Conversely, Western markets in the United States and United Kingdom lean toward puzzle and casual titles with cartoonish aesthetics. Despite these regional differences, fantasy remains the most popular setting worldwide. Across all territories, the consistent introduction of new content and technical stability are the most effective levers for re-engaging lapsed players and maintaining long-term retention.
- Mobile gaming generated $93.2 billion in 2021, accounting for over half of total industry revenue, with projections to reach $116.1 billion by 2024.
- Users who engage with short-video platforms represent a high-value demographic that installs 50% more games and spends 36% more time playing weekly than the average gamer.
- Short-video platform users are twice as likely as non-users to discover new titles through social content and subscription services, making them a primary target for strategy and MOBA developers.
- Regional art style preferences vary significantly, with Asian markets favoring anime and 'cute' aesthetics alongside gacha mechanics, while U.S. and U.K. markets prefer puzzle and casual titles with cartoonish aesthetics.
- Fantasy remains the most popular global game setting, while consistent content updates and technical stability are the primary drivers for re-engaging lapsed players and ensuring long-term retention.
+1
TikTokJan 2021
Report15 pages
Dapp Industry Report: January 2021
The report presents a snapshot of the decentralized‑application (dapp) landscape in January 2021, emphasizing Ethereum’s continued dominance while highlighting the rapid emergence of competing blockchains and the explosive growth of the NFT sector. Across the month, Ethereum generated more than $112 billion in transaction volume—86 % of total blockchain activity—and supported roughly 72 000 daily active wallets (30 % of the market). Its DeFi ecosystem accounted for 99 % of this activity, with Uniswap and 1inch leading in unique wallet usage, while total value locked (TVL) on Ethereum surpassed $30 billion, driven by token price surges and a rise in aTVL to $14 billion.
NFT activity on Ethereum expanded tenfold, from $3 million in December to $33 million in January, propelled by CryptoPunks and the newly launched Hashmasks, which quickly became the top collectible dapp. Meanwhile, the Flow blockchain’s NBA Top Shot achieved over $40 million in sales, overtaking Ethereum‑based NFTs to become the leading NFT platform. Binance Smart Chain (BSC) recorded its strongest month, exceeding $15 billion in transaction volume and generating the highest number of unique active wallets on its network, largely through Venus and PancakeSwap. Wax’s gaming dapp Alien Worlds also posted rapid growth, reaching 8 000 daily active wallets.
Scalability constraints on Ethereum continued to inflate gas fees, prompting migration to layer‑2 solutions such as Matic and to alternative layer‑1 chains. The report’s data derive from DappRadar analytics, covering transaction volumes, wallet activity, and TVL across major protocols (Ethereum, BSC, Wax, Flow, EOS, Tron, and emerging networks like Polkadot and Solana) for the calendar month of January 2021. Overall, the findings indicate a blockchain ecosystem transitioning from DeFi‑centric growth to a new wave dominated by high‑value NFT dapps and diversified cross‑chain activity.
- Ethereum maintained market dominance in January 2021 with $112 billion in transaction volume, representing 86% of total blockchain activity and over $30 billion in total value locked.
- The NFT sector experienced explosive growth, with Ethereum-based NFT volume increasing tenfold to $33 million, while Flow’s NBA Top Shot surpassed all Ethereum platforms to lead the market with over $40 million in sales.
- Binance Smart Chain recorded its strongest performance to date, processing over $15 billion in transaction volume and achieving the highest number of unique active wallets, driven primarily by Venus and PancakeSwap.
- Ethereum's DeFi ecosystem remained the primary driver of its activity, accounting for 99% of its network usage with Uniswap and 1inch as the leading platforms.
- High gas fees caused by Ethereum's scalability constraints accelerated a migration toward alternative layer-1 blockchains and layer-2 solutions like Matic.
+1
DappRadarJan 2021

Report22 pages
Global Video Game Investment Activity Report Q1 2021
The first quarter of 2021 marked a historic surge in global video game industry investments, signaling a potential record-breaking year. Total deal value for closed transactions reached $25 billion across 249 deals, representing a twofold increase compared to the first half of 2020. When including announced but unclosed transactions, the total deal value for the quarter climbed to $39 billion. This growth was observed across all primary investment frontiers, including private placements, public offerings, and mergers and acquisitions (M&A).
M&A activity served as the primary engine for this expansion, accounting for $14.3 billion in closed deal value, a nearly sixfold increase year-over-year. This segment was dominated by high-profile "mega-deals," most notably Microsoft’s $7.5 billion acquisition of ZeniMax Media and ByteDance’s $4 billion acquisition of Moonton. Public offerings also saw record activity, generating $8.3 billion in value—a 29-fold increase over the previous year—driven by a tripling of initial public offerings and the rising popularity of Special Purpose Acquisition Companies (SPACs). Private investments reached a segment record of $2.6 billion, with late-stage rounds for companies like Roblox and Dapper Labs accounting for 73% of that total.
Strategic and venture capital activity remained highly concentrated among top-tier players. Tencent maintained its leadership in deal volume, closing 35 transactions with a focus on PC and console developers. Meanwhile, the top five strategic investors—Tencent, Microsoft, Embracer Group, Electronic Arts, and ByteDance—contributed over half of the total announced deal value. Early-stage venture capital also grew significantly, with a 120% increase in capital raised by game developers. Geographically and by segment, mobile and multiplatform studios remained the most attractive targets for investors, while PC and console segments drove the majority of M&A value. This analysis is based on tracked closed transactions in the global video game industry, excluding gambling and betting, utilizing data from public media, business partners, and S&P Capital IQ.
- Global video game investment reached $25 billion in closed deal value during Q1 2021, a twofold increase over the first half of 2020, with total announced deal value hitting $39 billion.
- M&A activity was the primary growth driver, totaling $14.3 billion in closed deals—a nearly sixfold year-over-year increase—led by Microsoft’s $7.5 billion ZeniMax acquisition and ByteDance’s $4 billion Moonton acquisition.
- Public offerings generated $8.3 billion in value, representing a 29-fold increase over the previous year, fueled by a tripling of IPOs and the rise of SPACs.
- Tencent, Microsoft, Embracer Group, Electronic Arts, and ByteDance dominated the landscape, collectively contributing over 50% of the total announced deal value.
- Private investments hit a record $2.6 billion, with 73% of that capital directed toward late-stage rounds for companies such as Roblox and Dapper Labs.
+1
InvestGameJan 2021
Report78 pages
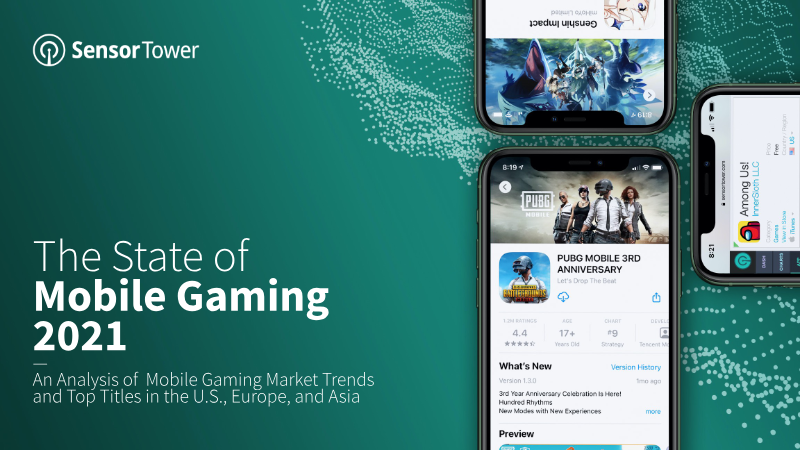
The State of Mobile Gaming 2021
The global mobile gaming industry experienced unprecedented expansion through early 2021, catalyzed by a pandemic-induced surge that drove quarterly revenue to a record $22.2 billion. This growth represents a significant 33% year-over-year increase, with the United States emerging as the premier revenue market, contributing 28% of global consumer spending. While mature markets in North America and Europe reached new financial heights, developing regions—most notably India—served as the primary engines for user acquisition, pushing global downloads to new peaks. Asia remains the largest collective region, surpassing $12 billion in quarterly revenue, anchored by Japan’s robust $5 billion contribution.
Market dynamics shifted toward social and multiplayer experiences, with titles such as Roblox and Genshin Impact dominating both engagement and monetization. RPG and Strategy remain the highest-grossing genres, generating $21.9 billion and $15.1 billion respectively in 2020, though Simulation and Shooter categories exhibited the fastest year-over-year growth. Simultaneously, the Hypercasual genre achieved staggering scale, reaching 3.4 billion downloads in a single quarter. This high-volume segment has become a cornerstone of the mobile advertising ecosystem, where publishers like Zynga and Playrix maintain a dominant share of voice across major digital networks.
Monetization has consolidated almost entirely around the freemium model, which now accounts for 99% of App Store revenue through a combination of in-app purchases, subscriptions, and advertising. Looking forward, the industry is projected to reach $117 billion in annual revenue by 2023, maintaining a compound annual growth rate of 13.5%. While the initial pandemic-driven spike in downloads has stabilized, the sustained increase in consumer spending and the rapid growth of markets in Southeast Asia and Europe indicate a permanent upward shift in the global gaming trajectory.
- The mobile gaming industry reached a record $22.2 billion in quarterly revenue in early 2021, marking a 33% year-over-year increase.
- The industry is projected to reach $117 billion in annual revenue by 2023, maintaining a compound annual growth rate of 13.5%.
- The freemium model now dominates the market, accounting for 99% of App Store revenue through in-app purchases, subscriptions, and advertising.
- RPG and Strategy remain the highest-grossing genres at $21.9 billion and $15.1 billion respectively, while Hypercasual games reached 3.4 billion downloads in a single quarter.
- The United States is the premier revenue market, contributing 28% of global consumer spending, while Asia remains the largest collective region with over $12 billion in quarterly revenue.
+1
Sensor TowerJan 2021
Report26 pages
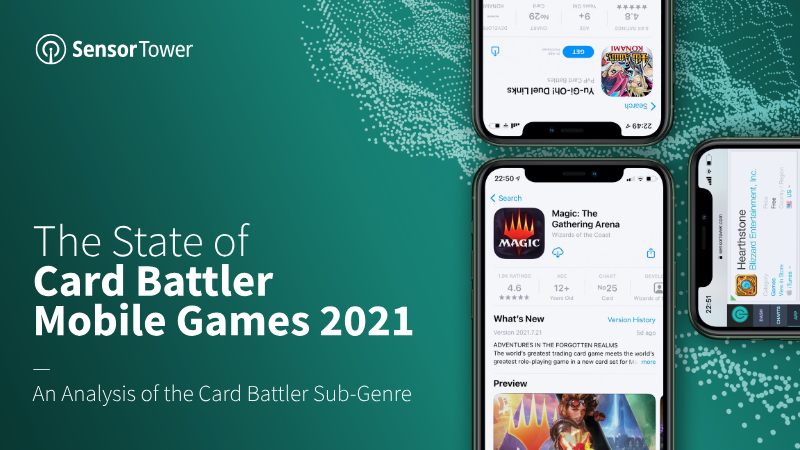
An Analysis of the Card Battler Sub‑Genre 2021
The card battler mobile sub-genre experienced significant growth and market shifts during the first half of 2021. While representing five percent of player spending within the broader strategy genre, card battlers reached a new revenue baseline exceeding $55 million per month. This growth was punctuated by a 17 percent quarterly revenue increase in early 2021, driven largely by established "forever franchises" and the successful mobile launch of legacy intellectual properties.
The geographic landscape of the sub-genre is diversifying. Although Asian markets like Japan and China historically dominated the space, the United States emerged as a critical growth region, accounting for 27 percent of player spending in the first half of 2021. The U.S. market also demonstrated the highest growth in revenue per download among strategy sub-genres, rising 53 percent. This trend suggests the market is maturing and becoming increasingly lucrative for developers targeting Western audiences.
Market leadership remains concentrated among titles leveraging powerful intellectual properties. Yu-Gi-Oh! Duel Links and Hearthstone continue to lead in lifetime earnings, while Magic: The Gathering Arena rapidly ascended to the top ten following its March 2021 release. The success of these titles, alongside niche performers like WWE SuperCard and the high download volume of Mighty Party, indicates a healthy appetite for both established tabletop conversions and new gameplay concepts.
The analysis utilizes data from Sensor Tower’s Game Intelligence and Store Intelligence platforms, covering global App Store and Google Play performance. Findings highlight that while the sub-genre is smaller than 4X strategy or MOBA categories, its increasing average revenue per user and the success of aggressive user acquisition strategies by new contenders point to significant ongoing opportunities for expansion.
- The card battler sub-genre reached a new revenue baseline exceeding $55 million per month in the first half of 2021, driven by a 17 percent quarterly revenue increase.
- The United States has become a critical market, accounting for 27 percent of global player spending and experiencing a 53 percent increase in revenue per download during the first half of 2021.
- Market leadership is dominated by established intellectual properties, with Yu-Gi-Oh! Duel Links and Hearthstone leading in lifetime earnings and Magic: The Gathering Arena entering the top ten shortly after its March 2021 launch.
- While card battlers represent five percent of total strategy genre spending, the sub-genre shows significant expansion potential due to rising average revenue per user and effective user acquisition strategies.
- The sub-genre demonstrates a healthy appetite for diverse gameplay, ranging from tabletop-to-mobile conversions like Magic: The Gathering Arena to high-volume download titles like Mighty Party and niche performers like WWE SuperCard.
+1
Sensor TowerJan 2021
Report71 pages
Newzoo Metaverse Report 2021
The metaverse represents the evolution of gaming from a service into a persistent, infinitely scaling platform characterized by social interaction, user-generated content, and functioning economies. Driven by technological advancements and the social shifts of the COVID-19 era, virtual spaces now host non-gaming activities like concerts and brand activations that attract tens of millions of participants. This transition is supported by a highly receptive consumer base, with 70% of gamers expecting these social hubs to increase their playtime. The industry is moving toward a direct-to-avatar economy where digital identity and creator-led markets are central to engagement across platforms like Roblox, Fortnite, and Avakin Life.
Blockchain technology serves as a primary catalyst for this shift, enabling decentralized economies and play-to-earn models that provide players with true digital ownership. While current hurdles include high transaction fees and environmental concerns associated with early NFT models, the sector is transitioning toward scalable, green solutions like Layer 2 protocols. Establishing interoperable digital identities and seamless marketplaces is essential for aligning the economic interests of developers and creators. Furthermore, the move toward Web 3.0 requires a shift in the digital supply chain toward player-owned assets and open standards, such as Pixar’s Universal Scene Description, to ensure cross-platform collaboration.
Despite this momentum, significant structural and technical challenges remain. Achieving massive concurrency—moving beyond sharded instances to thousands of users in a single persistent world—requires cloud-native infrastructure and radical improvements in network protocols. Additionally, the industry must navigate regional fragmentation caused by government regulations and the need for modernized IP laws. Ethical risks, including deepfakes, unmoderated content, and identity theft, necessitate a focus on safety and open standards. Ultimately, the games industry is positioned to lead the development of a mobile-accessible, community-driven metaverse that complements physical reality through democratized monetization and high-fidelity digital twins.
- The metaverse is evolving gaming into a persistent, scalable platform for social interaction and non-gaming activities, with 70% of gamers anticipating increased playtime in these virtual hubs.
- The industry is shifting toward a direct-to-avatar economy where digital identity and creator-led markets drive engagement on platforms such as Roblox, Fortnite, and Avakin Life.
- Blockchain technology is facilitating decentralized economies and play-to-earn models, with the sector currently transitioning toward scalable, green Layer 2 protocols to address transaction costs and environmental concerns.
- Achieving a true metaverse requires overcoming technical barriers to massive concurrency, specifically moving beyond sharded instances to support thousands of simultaneous users through cloud-native infrastructure.
- Cross-platform collaboration and the Web 3.0 digital supply chain depend on the adoption of open standards, such as Pixar’s Universal Scene Description, to enable interoperable digital identities and player-owned assets.
+1
NewzooJan 2021

Report19 pages
Video Games – a Force for Good (2021)
The 2021 Key Facts report, a joint publication by ISFE and EGDF, provides a comprehensive analysis of the European video game industry’s market performance, player demographics, and social impact. Covering the 2021 calendar year with comparative data from 2020, the report focuses on the European Union and broader European markets, including the United Kingdom. Data is derived from Ipsos, GameTrack, and Games Sales Data (GSD), utilizing surveys and retail tracking across more than 20 European nations.
The findings indicate a stable market valued at €23.3 billion, maintaining the significant revenue gains achieved during the 2020 pandemic lockdowns. While the total number of players grew by 6% to reach 52% of the European population, average weekly playtime decreased to 9 hours, returning to pre-pandemic levels. The digital ecosystem dominates the sector, accounting for 81% of total revenue, driven largely by app-based gaming and in-game extras. Demographically, the average player age is 31.3 years, and women represent nearly 48% of the total player base.
Beyond economic metrics, the report emphasizes the industry’s commitment to social responsibility and sustainability. It highlights the widespread adoption of the PEGI age rating system and the effectiveness of parental control tools, noting a significant decrease in unauthorized in-game spending by minors. The document also outlines industry-wide initiatives to improve workforce diversity, where women currently make up 22% of employees, and details environmental efforts such as the Green Game Jam and the Games Consoles Voluntary Agreement to reduce energy consumption. Finally, the report identifies esports as a high-growth segment, with global revenues surpassing $1 billion in 2021.
- The European video game market maintained a stable valuation of €23.3 billion in 2021, successfully sustaining the revenue gains achieved during the 2020 pandemic.
- Digital sales dominate the industry, accounting for 81% of total revenue, with growth primarily driven by app-based gaming and in-game purchases.
- The European player base grew by 6% in 2021 to encompass 52% of the total population, with an average player age of 31.3 years and a gender split of 48% women.
- Average weekly playtime dropped to 9 hours in 2021, signaling a return to pre-pandemic engagement levels despite the increase in total player count.
- Esports emerged as a high-growth sector, with global revenues exceeding $1 billion during the 2021 calendar year.
+1
European Games Developer FederationJan 2021

Report20 pages
Match3 Genre Snapshot Report May 2021 (2021)
The Match3 subgenre represents the largest segment of the US iOS mobile gaming market, accounting for approximately 16% of total revenue as of mid-2021. While established titles have dominated the charts for years, the landscape is evolving through the integration of complex meta-layers and sophisticated monetization strategies. Notably, every new Match3 title that entered the top 500 grossing rankings between late 2019 and early 2021 utilized traditional swapping mechanics, signaling a preference for familiar core gameplay enhanced by modern secondary features.
Meta-elements, particularly customization and decoration, have become essential components of modern Match3 success. Recent megahits like Royal Match and Project Makeover demonstrate this trend by blending core puzzle mechanics with narrative progression and aesthetic choices. Beyond gameplay, monetization has shifted toward loss aversion mechanics and diverse live operations. Data indicates that recurring live events, special event rewards, and limited-time in-app purchase offers have the highest impact on revenue. Social features, including guild mechanics and "send/ask help" systems, further bolster engagement and retention within the subgenre.
Player motivation analysis, based on a survey of over 7,000 mobile gamers across major English-speaking markets, reveals distinct psychological drivers. While traditional titles like Candy Crush Saga rely heavily on the "Thinking & Solving" and "Completing Milestones" drivers, the broader Match3 market is increasingly leaning into "Customization & Decoration." This shift highlights a move away from pure puzzle-solving toward a more expressive and multi-layered player experience. The findings suggest that future growth in the category depends on balancing core puzzle mastery with social competition and deep meta-progression.
- As of mid-2021, the Match3 subgenre is the largest segment of the US iOS mobile gaming market, generating approximately 16% of total revenue.
- Every new Match3 title that entered the top 500 grossing rankings between late 2019 and early 2021 retained traditional swapping mechanics, confirming that core gameplay innovation is less critical than secondary feature integration.
- Success in the modern market is driven by meta-layers like customization and decoration, as evidenced by the performance of titles such as Royal Match and Project Makeover.
- Revenue optimization in the subgenre is currently driven by loss aversion mechanics, recurring live events, special event rewards, and limited-time in-app purchase offers.
- Player motivation has shifted from pure puzzle-solving toward expressive experiences, with 'Customization & Decoration' now serving as a primary psychological driver alongside traditional 'Thinking & Solving' and 'Completing Milestones' goals.
+2
GameRefineryJan 2021

Report23 pages
Newzoo Trends to Watch 2021
This analysis outlines the primary trends shaping the global games, esports, and mobile markets for 2021. The central thesis posits that while the COVID-19 pandemic accelerated engagement and spending, these behaviors have become permanent habits that will sustain market growth even as lockdowns ease. By the end of 2021, the global games market is projected to reach $189.3 billion in revenue, supported by a player base of 2.8 billion people, with significant growth emerging from Southeast Asia and the Middle East.
The scope of the findings covers PC, console, and mobile segments across major global regions, including North America, Europe, China, and emerging markets. Key data points include the rise of cloud gaming, which is expected to surpass $1 billion in annual revenue for the first time, and the rapid expansion of 5G technology, with 5G-ready active smartphones forecasted to grow from 5% in 2020 to 16% (700 million units) by the end of 2021. In the esports sector, mobile titles like PUBG Mobile and Garena Free Fire are now challenging traditional PC giants in viewership, signaling a shift toward mobile-first competitive gaming.
Methodologically, the findings are derived from proprietary market models and consumer research. The analysis highlights several structural shifts: the evolution of games into "metaverse" social platforms for non-gaming events, the disruption of mobile marketing due to the removal of Apple’s Identifier for Advertisers (IDFA), and the increasing pressure on traditional app store revenue-share models. Furthermore, the industry is noted to be prioritizing diversity, inclusion, and reduced toxicity in response to social movements and player demand. Ultimately, the convergence of platforms and the expansion of gaming IP into broader entertainment media are identified as the defining characteristics of the industry's trajectory.
- The global games market is projected to reach $189.3 billion in revenue by the end of 2021, supported by a permanent shift in consumer spending habits and a total player base of 2.8 billion people.
- Cloud gaming is expected to surpass $1 billion in annual revenue for the first time in 2021, while 5G-ready active smartphones are forecasted to grow from 5% in 2020 to 16% (700 million units) by year-end.
- Mobile titles such as PUBG Mobile and Garena Free Fire are increasingly challenging traditional PC giants in esports viewership, marking a significant shift toward mobile-first competitive gaming.
- The removal of Apple’s Identifier for Advertisers (IDFA) is disrupting mobile marketing strategies and intensifying industry pressure on traditional app store revenue-share models.
- Gaming platforms are evolving into 'metaverse' social hubs for non-gaming events, while industry leaders are increasingly prioritizing diversity, inclusion, and reduced toxicity in response to player demand.
+1
NewzooJan 2021

Report52 pages
Innovate to Win on the Next Level with Hybrid Genre Games
The global mobile gaming landscape has entered a period of sustained growth following the pandemic, with overseas consumer spending reaching $36 billion in the first half of 2021. This represents a 73% increase since 2018, a trend largely spearheaded by China-based publishers who now command a 23% share of the international market. To sustain this trajectory, the industry is shifting toward hybridization, a strategy that blends core mechanics from disparate subgenres to broaden player demographics and optimize revenue streams. By integrating casual elements like farming or social multiplayer features into hardcore frameworks, developers are successfully diversifying their monetization models beyond traditional structures.
Market performance in early 2021 reveals that while Strategy, RPG, and Match subgenres remain the primary revenue drivers, high-growth categories such as Luck Battle and Merge-Saga are emerging as significant leaders. The 4X March-Battle subgenre, in particular, saw a 51% year-over-year increase in consumer spend, fueled by strong performance in the United States, Japan, and Germany. Additionally, the Idol Training subgenre experienced an explosive 129% surge in spending, highlighting the rising influence of Asian cultural themes and "Nijigen" aesthetics in the global market.
Despite these gains, the industry faces challenges from evolving user privacy policies, which contributed to a 12% contraction in Puzzle RPG spending. In response, successful developers are increasingly utilizing hybrid tactics such as Gacha monetization, home design meta-layers, and social connectivity to maintain engagement. The transition toward these multifaceted game designs suggests that the future of mobile gaming lies in the ability to merge deep, mid-core progression systems with accessible, casual mechanics to capture a more diverse and resilient global audience.
- Mobile gaming consumer spending reached $36 billion in H1 2021, marking a 73% increase since 2018, with China-based publishers now capturing 23% of the international market.
- The industry is pivoting toward hybrid game design, which integrates casual mechanics like farming or social features into hardcore frameworks to diversify monetization and broaden demographics.
- The Idol Training subgenre saw a 129% surge in consumer spending, signaling the growing global influence of Asian cultural themes and 'Nijigen' aesthetics.
- The 4X March-Battle subgenre experienced a 51% year-over-year increase in spending, driven by strong performance in the United States, Japan, and Germany.
- Evolving user privacy policies have negatively impacted specific categories, evidenced by a 12% contraction in Puzzle RPG spending.
+2
data.aiJan 2021

Report10 pages
Hyper-Casual Games – Industry Snapshot
The 2020 Hyper-Casual Sub-Genre Snapshot provides a detailed analysis of the hyper-casual mobile gaming market, focusing on performance benchmarks and sub-genre classification. Utilizing data from a network of over 140,000 integrated games and 2 billion monthly players, the analysis categorizes the industry into distinct mechanics: Timing, Traversal, Physics, Shooting, Spatial, Crafting, and Matching. The primary objective is to establish actionable KPIs for developers to optimize game development and monetization strategies.
Geographic data reveals significant variations in player engagement and retention. European markets, specifically France, Germany, Italy, and the Netherlands, lead in Day 1 retention at 49%. However, Japan emerges as a dominant market for deep engagement, boasting the highest Day 7 retention at 19% and a leading average playtime of 63 minutes. In contrast, the United States shows moderate performance with 43% Day 1 retention and 43 minutes of playtime, while China lags behind in these specific engagement metrics.
The findings highlight the dominance of specific titles launched in 2020, such as High Heels! and Slap Kings, which achieved high performance scores through simple, portrait-oriented, and advertising-focused business models. Successful games in this category are characterized by short, satisfying gameplay loops and forgiving mechanics. A critical benchmark for developers is the 40% Day 1 retention threshold; titles falling below this mark are generally considered unpromising, necessitating either rapid iterative sprints or project termination to maintain development efficiency.
- A 40% Day 1 retention rate serves as the critical performance benchmark for hyper-casual titles; games falling below this threshold should be iterated upon immediately or terminated.
- European markets lead in short-term engagement with a 49% Day 1 retention rate, while Japan excels in long-term retention at 19% and average session lengths of 63 minutes.
- The United States market shows moderate engagement metrics, recording a 43% Day 1 retention rate and an average playtime of 43 minutes.
- Successful 2020 titles like High Heels! and Slap Kings demonstrate that high performance is driven by portrait-oriented design, short gameplay loops, and advertising-focused monetization.
- The hyper-casual industry is categorized into seven core mechanics: Timing, Traversal, Physics, Shooting, Spatial, Crafting, and Matching.
+1
GameIntelJan 2021

Report1 pages
Survey on Games and Daily Life: Japan
The survey was launched to deepen understanding of how gaming activities intersect with everyday life in Japan and to inform strategies for mitigating “gaming disorder,” a condition recently classified by the World Health Organization. Its overarching aim is to promote healthier gaming habits across a broad spectrum of participants, ranging from casual players to professional gamers and students enrolled in specialized esports training programs.
Fieldwork took place in February 2021 and targeted three distinct groups: active professional gamers, individuals attending dedicated esports academies, and the general gaming public. Data were collected through an online questionnaire distributed via email by the research team and Cross‑Marketing, with respondents directed to a secure response site. To encourage participation, incentives varied from ¥500 to ¥2,000 Quo‑card vouchers, supplemented by point awards for panel members of the survey firm.
The investigation was coordinated by the Social Psychology Laboratory at Ochanomizu University, under the leadership of Professor Akira Sakamoto, with operational support from Cross‑Marketing and endorsement from the Japan eSports Union (JeSU). Although specific results are not disclosed in the excerpt, the study’s design reflects a comprehensive, mixed‑audience approach intended to generate actionable insights for policy makers, health professionals, and the esports industry regarding responsible gaming practices in Japan.
- The study, conducted in February 2021, aimed to analyze the intersection of gaming and daily life to inform strategies for mitigating gaming disorder.
- Research was led by Professor Akira Sakamoto of the Social Psychology Laboratory at Ochanomizu University with endorsement from the Japan eSports Union (JeSU).
- The survey targeted three distinct demographics: active professional gamers, students in specialized esports academies, and the general gaming public.
- Data collection was facilitated through an online questionnaire managed in partnership with the research firm Cross-Marketing.
- Participation was incentivized through a combination of point awards and Quo-card vouchers ranging in value from ¥500 to ¥2,000.
+1
CESA – Computer Entertainment Supplier's AssociationJan 2021

Report66 pages
Serbian Gaming Industry Report 2021
In 2021 Serbia’s gaming ecosystem emerged as a rapidly expanding, export‑oriented sector that combined a sizable studio base with a vibrant indie community. Roughly 130 development studios employed 1,548 people, of whom 30 % were women, and produced about 2,200 titles that generated an estimated US$125 million in revenue. The majority of earnings—between 75 % and 100 %—derived from markets outside the country, and 64 % of games relied on a free‑to‑play model supplemented by advertising.
Mid‑sized studios such as Nordeus and Playrix RS demonstrated strong user bases, while larger contributors including Ubisoft Belgrade and the VFX house Bunker underscored Serbia’s capacity to support AAA‑level production and international client work. The esports landscape, led by Fortuna’s Balkan League, attracted roughly half a million viewers and distributed €220 k in prize money, highlighting the sector’s growing competitive dimension. Indie developers, ranging from solo creators to teams of forty, pursued diverse platforms—PC, mobile, VR/AR—and increasingly leveraged tools like Epic’s MetaHuman Creator, signalling a shift toward high‑fidelity, narrative‑driven experiences.
Policy initiatives reinforced this momentum. The “Serbia Innovates” super‑cluster, backed by U.S. assistance, positioned gaming, VR, and Web3 technologies as a multidisciplinary hub, while tax‑incentive reforms such as the IP‑Box and double R&D deductions attracted capital and talent. Educational collaborations, exemplified by new university programs and industry‑led training platforms, created a pipeline that bridges skill gaps and sustains growth.
Sustainable development is viewed as dependent on three pillars: compelling IP, robust publishing partnerships, and cross‑sector cooperation, suggesting that continued alignment of studio capabilities, policy support, and talent development will cement Serbia’s role as a notable exporter in the global games market.
- In 2021, Serbia’s gaming sector comprised approximately 130 studios employing 1,548 people, generating $125 million in revenue with 75% to 100% of earnings derived from international exports.
- The industry is heavily reliant on the free-to-play model, which accounts for 64% of all games produced, while the total output reached roughly 2,200 titles.
- The ecosystem supports a diverse production scale, ranging from indie developers using high-fidelity tools like MetaHuman Creator to major contributors such as Nordeus, Playrix RS, and Ubisoft Belgrade.
- Government policy has actively fostered growth through tax incentives like the IP-Box and double R&D deductions, alongside the 'Serbia Innovates' super-cluster initiative.
- The esports sector is a significant competitive pillar, with the Fortuna-led Balkan League attracting 500,000 viewers and distributing €220,000 in prize money.
+1
SGAJan 2021

Report38 pages
Romanian Game Development Industry Report: 2020
The Romanian game‑development sector has emerged as a rapidly expanding component of the national digital economy, delivering €218.5 million in revenue in 2020—a 19.1 % year‑on‑year increase that pushed total earnings beyond the €200 million threshold. This growth builds on a foundation laid in the late‑1990s by early publishers such as AMC and Fun Labs and accelerated by a wave of indie activity that has diversified the market across hyper‑casual, mid‑core and AAA support segments.
Policy measures have been pivotal: a tax‑exempt status for developers introduced in 2004, a state‑aid scheme for large IT investments in 2012, and the “Startup Nation” programme of 2016 have collectively fostered an IT sector employing over 113 000 people and contributing roughly 6.8 % of GDP in 2020. The exemption, however, applies only to technical staff, leaving creative roles under‑supported and prompting the Romanian Game Developers Association to propose dedicated incentives.
The ecosystem now includes hyper‑casual studios that have amassed more than 10 million downloads, mid‑core and AAA support firms such as EA Romania, Ubisoft Romania and Gameloft that together employ around 750 developers and work on franchises like FIFA and Assassin’s Creed, and independent studios such as Ovilex, whose simulators have exceeded 500 million installs.
Case studies illustrate the sector’s breadth: Whyttest operates a cross‑border QA‑outsourcing service with senior and junior testers in Bucharest and Belgrade, while XSA, an indie start‑up focused on Android/iOS car games, reaches over one million players each month. The analysis draws on multiple European industry sources, including ISFE‑EGDF, EGDF, Goldstein Research, and regional surveys, providing a comprehensive view of Romania’s game‑development landscape during the 2020 period.
- The Romanian game development industry generated €218.5 million in revenue in 2020, marking a 19.1% year-on-year growth rate.
- The broader IT sector, bolstered by state-aid schemes and tax exemptions, employed over 113,000 people and contributed approximately 6.8% of Romania's GDP in 2020.
- Major AAA support studios including EA Romania, Ubisoft, and Gameloft employ roughly 750 developers in the country, contributing to global franchises like FIFA and Assassin’s Creed.
- Independent studios have achieved significant scale, with firms like Ovilex recording over 500 million installs for their simulator titles.
- Current tax-exempt status for developers is limited to technical staff, leading the Romanian Game Developers Association to lobby for new incentives to support creative roles.
+2
RGDA – Romanian Game Developers AssociationJan 2021

Report41 pages
La Guía de los Esports
Resumen ejecutivo de “La Guía de los Esports” (Basado en los ocho apartados que aparecen en el material proporcionado)
1. Contexto macro‑económico del sector Tamaño del mercado: US $947.1 M en 2020; proyectado a superar el billón de dólares en los próximos años. Audiencia global: > 215 millones de “entusiastas” (personas que ven competiciones al menos una vez al mes). Motor de crecimiento: Broadband rápido y fiable. Las regiones con mejor conectividad (Este de Asia, Norte de Europa y Norteamérica) concentran la mayor parte del potencial de mercado.
2. Evolución de géneros y penetración regional Nuevos géneros híbridos: Battle‑royale (desde 2017) – p.ej. Fortnite, PUBG. Auto‑battlers (desde 2019) – p.ej. Teamfight Tactics, Dota Auto‑Chess. Penetración de audiencia (por población): | Región | % de población | Fans estimados | |--------|----------------|----------------| | China | 6.09 % | 88 M | | Norteamérica | 4.93 % | 18.2 M | | Europa | 3.90 % | 29.2 M | | Latinoamérica | (dato incompleto) | — | La distribución es muy desigual; los mercados emergentes aún presentan gran margen de expansión.
3. Arquitectura del ecosistema Propiedad intelectual: Los publishers (editores) son dueños del IP, financian el desarrollo y establecen las reglas competitivas. Actores interdependientes: Desarrolladores → crean el juego. Plataformas (Steam, Epic, consolas) → distribución y hosting. Organizadores de torneos → eventos y ligas. Equipos profesionales → gestión de jugadores y marcas. Jugadores (pro y amateur) → contenido y rendimiento. Creadores de contenido (streamers, youtubers) → comunidad y monetización. Profesionalización: Programas de becas multimillonarios, ligas estructuradas (ej. LCS, LEC, Overwatch League) y contratos con cláusulas de exclusividad y derechos de imagen.
4. Crecimiento de audiencia y de ingresos Audiencia total: 435.9 M (2021) → 577.2 M (estimado 2024) – CAGR +7.7 %. Ingresos: < $1.1 B (2021) → proyección > $1.5 B para 2024 (
- The esports market is projected to grow from under $1.1 billion in 2021 to over $1.5 billion by 2024, maintaining a compound annual growth rate (CAGR) of 7.7%.
- Global esports viewership is expected to reach 577.2 million people by 2024, up from 435.9 million in 2021.
- Market potential is heavily concentrated in regions with high-speed broadband infrastructure, specifically East Asia, Northern Europe, and North America.
- China leads global market penetration with 88 million fans, representing 6.09% of its population, significantly outpacing North America (4.93%) and Europe (3.90%).
- The ecosystem is defined by publisher-controlled intellectual property, where developers dictate competitive rules and league structures like the LCS, LEC, and Overwatch League.
+2
AEVIJan 2021
Report14 pages
Rapport Annuel 2021
The 2021 annual review underscores the emergence of video‑games as a pivotal social and economic force within Canada, where roughly 61 % of the population—about 23 million people—engage in regular play. Pandemic‑era surveys reveal that 58 % of adult gamers and 80 % of adolescents increased their gaming time, while disposable income previously allocated to cinema and travel was redirected toward interactive entertainment, positioning gaming as the dominant medium in the national leisure landscape.
Advocacy and industry support intensified throughout the year. The association shifted to virtual engagement with parliamentarians, deployed a paid Globe and Mail advertisement, and produced a targeted video message to maintain policy visibility during COVID‑19. A new content‑manager bolstered digital capacity, and coordinated outreach—including bi‑weekly provincial briefings, a monthly liaison call with provincial bodies, and a legally vetted return‑to‑work guide—facilitated the successful exclusion of video‑game developers and console manufacturers from the revised Canadian Broadcasting Act, averting potential royalties amounting to tens of millions of dollars and avoiding additional regulatory burdens.
Operational resilience was demonstrated as approximately 30 000 industry employees transitioned to remote work without disrupting the majority of scheduled releases. Financial stewardship met all set objectives, remaining within budget while expanding strategic initiatives. The sixth‑year student competition attracted 20 entries, awarding a $6,000 prize, reflecting ongoing investment in talent development and community engagement across the Canadian gaming sector.
- The Canadian video game industry successfully lobbied to be excluded from the revised Canadian Broadcasting Act, avoiding tens of millions of dollars in potential royalties and regulatory burdens.
- Approximately 23 million Canadians—61% of the population—are regular gamers, with 58% of adults and 80% of adolescents increasing their playtime during the pandemic.
- The industry maintained operational continuity during 2021 as 30,000 employees transitioned to remote work without disrupting the majority of scheduled game releases.
- Consumer spending shifted during the pandemic, with disposable income previously allocated to cinema and travel redirected toward interactive entertainment.
- Industry advocacy efforts in 2021 included virtual parliamentary engagement, targeted media campaigns in The Globe and Mail, and the implementation of a legally vetted return-to-work guide.
Association canadienne du logiciel de divertissementJan 2021