Global
Report
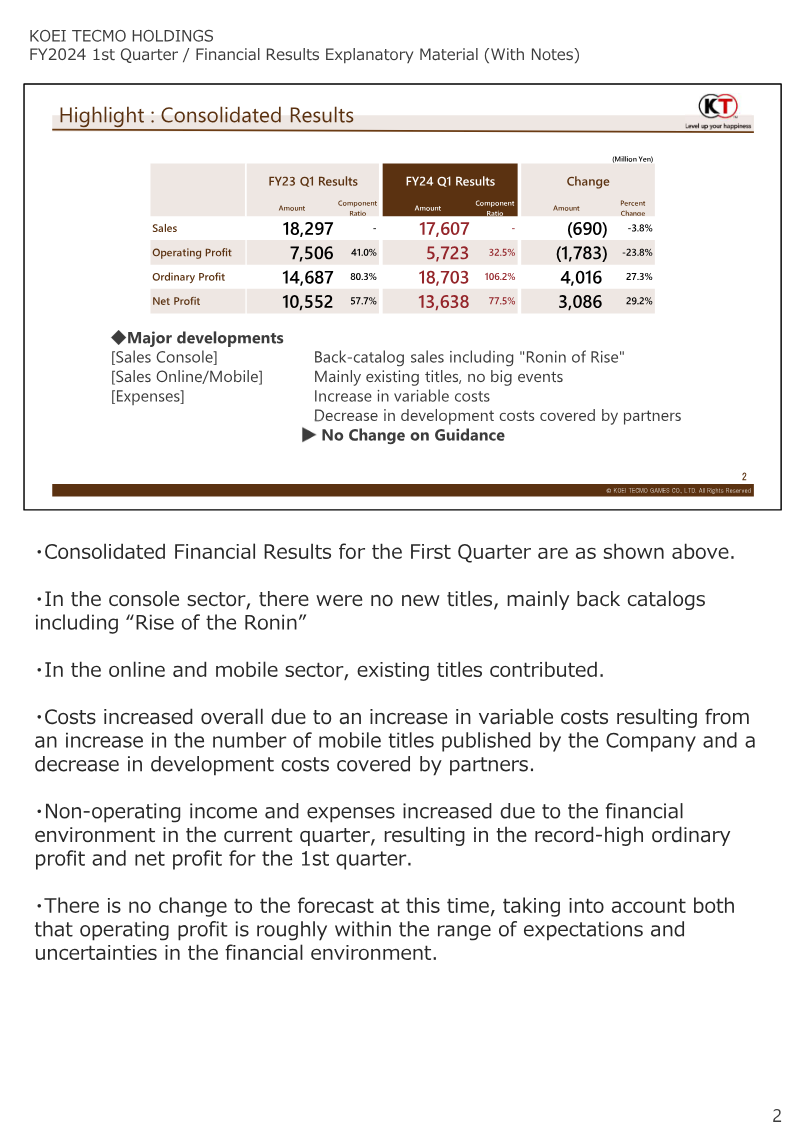
Financial Results for the Q3 of the Fiscal Year Ending March 2025
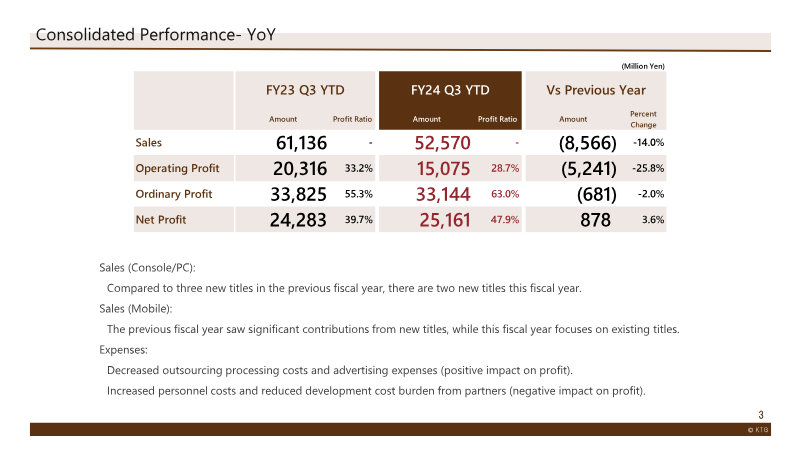
KT This document was created by machine translating the Japanese version. of the Fiscal Year Ending March 2025 1. Financial Results and Forecast 1. KT Financial Results and Forecast -Expense Level up your happiness FY23 Q3 YTD FY24 Q3 YTD Vs Previous Year Amount Profit Ratio Amount Profit Ratio Amount Percent Sales 61,136 - 52,570 ...
Koei Tecmo
Report
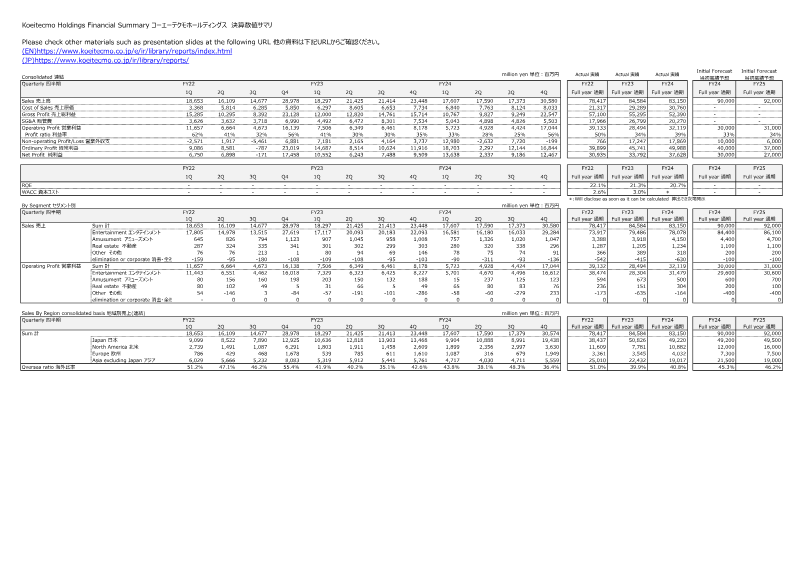
FY2024 Annual Data Appendix
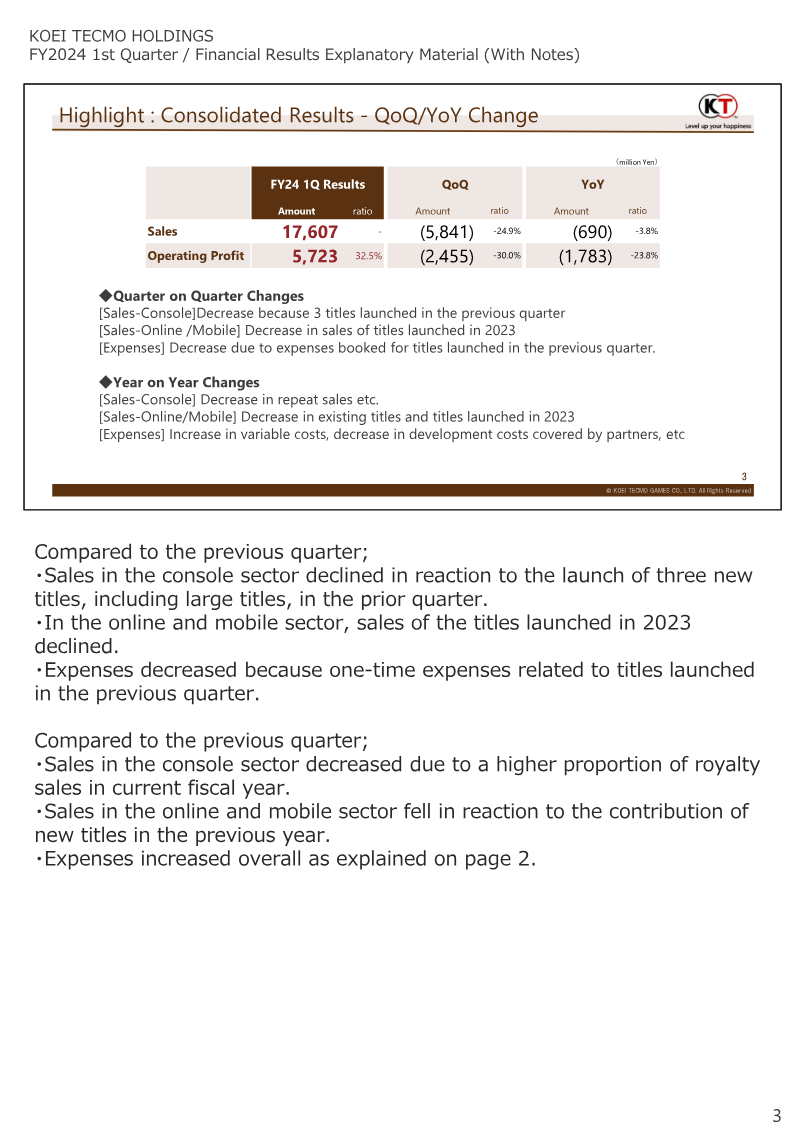
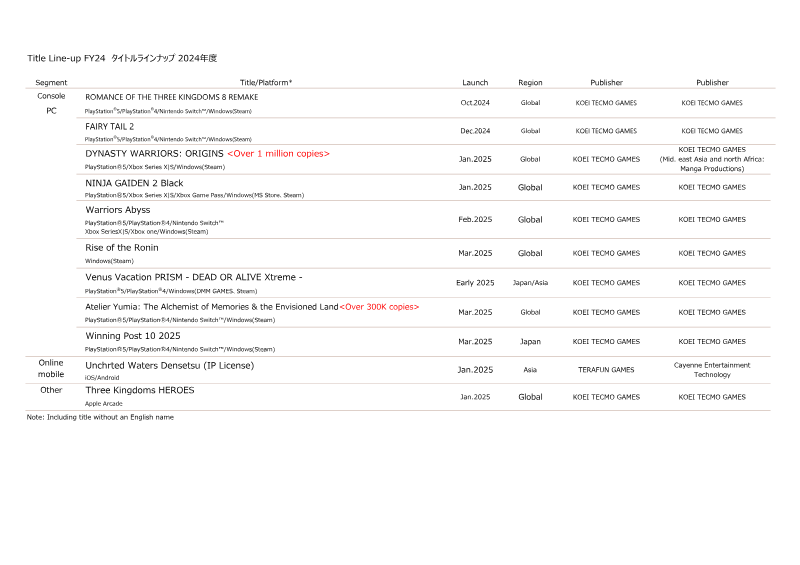
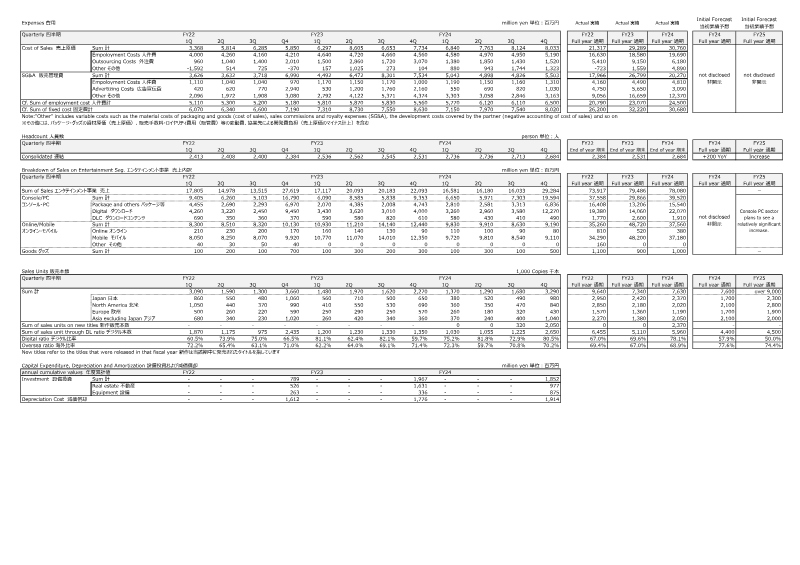
The FY2024 Annual Data Appendix presents a comprehensive financial and operational snapshot of Koei Tecmo’s performance across fiscal years 2022–2025, with detailed quarterly and full‑year figures for sales, cost of sales, gross profit, SG&A, operating profit, ordinary profit, and net profit. Sales peaked in FY22 Q4 at ¥28,978 million before declining to ¥17,590 million in FY23 Q4 and rebounding to ¥23,448 million in FY24 Q4. Gross profit margins fell from 62% in FY22 Q1 to 25% in FY24 Q4, reflecting rising cost of sales and SG&A. Operating profit followed a similar trend, with FY24 Q4 at ¥8,178 million versus ¥16,139 million in FY22 Q4. Net profit swung from ¥17,458 million in FY22 Q4 to a loss of ¥171 million in FY24 Q3, before recovering to ¥9,509 million in FY24 Q4. Return on equity rose from 20.7% in FY22 to 22.1% in FY24, while the weighted average cost of capital increased from 2.6% to 3.0%. Segment analysis shows the Entertainment division dominates revenue, contributing ¥73,917 million in FY24 and accounting for 94% of total sales. Amusement and real‑estate segments remain small, each under ¥5 billion annually. Geographic revenue distribution highlights Japan as the largest market (¥38,437 million FY24), followed by Asia excluding Japan (¥25,010 million) and North America (¥11,609 million). Overseas sales consistently exceed 40% of total revenue, peaking at 55.4% in FY24 Q4. Cost breakdowns reveal SG&A expenses rising from ¥3,626 million in FY22 Q1 to ¥8,301 million in FY24 Q3, driven largely by advertising and other variable costs. Employment costs increased modestly from ¥5,110 million to ¥6,500 million over the period. Capital expenditures remained modest, with FY24 cumulative investment at ¥1,967 million. Headcount grew from 2,413 employees in FY22 Q1 to 2,736 by FY24 Q4, a 9% YoY increase. Digital sales dominate the Entertainment segment, with digital download and DLC revenue accounting for over 60% of total entertainment sales in FY24. New title launches remain steady, with 2,370 units sold in FY24. The appendix also outlines the FY24 title line‑up, featuring high‑profile releases such as “Romance of the Three Kingdoms 8 Remake” and “Fairy Tail 2,” targeting global markets across console, PC, and mobile platforms. These releases are positioned to support the company’s strategy of expanding digital and overseas sales while maintaining strong domestic performance.
Koei Tecmo