Report30 pages
Q4 2023 Gaming Industry Report: Global & MENAP Outlook
The Q4 2023 Gaming Industry Report presents a global market that expanded to $212 billion, with the MENAP region contributing $2.8 billion and experiencing a 30% quarter‑over‑quarter rise in both gamers and investment activity. Mobile gaming remains the dominant platform, accounting for 46% of the global player base, while indie PC titles capture a growing share of revenue at roughly 30%. The report also highlights the continued diversification of the industry, noting that game‑to‑movie adaptations generated over $1.4 billion in 2023, underscoring cross‑media opportunities.
Regulatory scrutiny intensified across the sector, with a 15% increase in litigation and high‑profile antitrust cases against major platform holders such as Google and Apple. Significant fines were imposed for deceptive practices, reflecting a tightening legal environment that could reshape market dynamics.
M&A activity rebounded sharply in Q4, with transactions totaling $68.7 billion—a 769% jump largely driven by the Activision‑Blizzard deal—while global venture capital funding fell. In contrast, MENAP venture activity rose 30%, indicating a strategic pivot toward emerging markets including Asia, Africa, and MENAP for future consolidation. This trend presents both challenges and opportunities for indie studios, potentially enabling higher‑quality titles through increased resources.
Shorooq Partners focuses on early‑stage gaming investments within MENAP, targeting pre‑seed to Series A deals with ticket sizes of $1–8 million. The firm prioritizes studios that possess strong intellectual property, robust monetization models, and software solutions that enhance processing efficiency and scalable user connectivity. By engaging through conferences such as the WN Conference Abu Dhabi and LEAP 2024, newsletters, and partnership initiatives, Shorooq aims to nurture the growing MENAP gaming ecosystem.
- The global gaming market reached $212 billion in Q4 2023, with M&A activity surging to $68.7 billion, a 769% increase primarily driven by the Activision-Blizzard acquisition.
- Mobile gaming remains the industry's primary platform, capturing 46% of the global player base, while indie PC titles have grown to represent approximately 30% of total revenue.
- The MENAP region is a key growth area, contributing $2.8 billion to the market and recording a 30% quarter-over-quarter increase in both gamer population and venture capital investment.
- Regulatory pressure is intensifying, marked by a 15% rise in litigation and significant antitrust actions against major platform holders like Google and Apple regarding deceptive practices.
- Cross-media expansion is a proven revenue driver, with game-to-movie adaptations generating over $1.4 billion in 2023.
+1
Shorooq Partners

Report53 pages
Ad Monetization Without Killing Retention
Hybrid monetization can increase revenue without eroding player retention by treating advertisements as an integral part of the game’s design system. Three core ad formats—interstitials, rewarded video (RV), and banners—are positioned strategically through careful gating on level progression, playtime, or cooldown periods. Optimal triggers and placement reduce player frustration while maximizing eCPM, ensuring that monetization flows naturally with gameplay.
Rewarded video is most effective when offered during high‑stakes moments such as revives, boosters, or time‑limited rewards. Leveraging scarcity and urgency in these contexts drives conversions while preserving the core experience. Consistent visual cues, a clear distinction between coin rewards and RV value, and optional “No Ads” bundles further balance monetization with player comfort.
Selling “No Ads” bundles requires thoughtful presentation. Bundles should appear side‑by‑side with regular items, use distinct visual cues and anchoring to convey high value, and be gated behind a minimum purchase tier to protect payer retention. Segmenting ad exposure—capping impressions, applying cooldowns, and filtering out disruptive creatives—maintains a positive user experience while sustaining revenue.
Overall, the strategy blends ad formats with gameplay mechanics, employs scarcity and urgency for rewarded video, and offers high‑value “No Ads” options. This approach delivers robust monetization across diverse segments while safeguarding long‑term player engagement and retention.
- Integrate advertisements as core gameplay design elements rather than external overlays to increase revenue without negatively impacting player retention.
- Deploy rewarded video ads during high-stakes moments—such as revives, boosters, or time-limited rewards—to leverage scarcity and urgency for higher conversion rates.
- Implement strategic gating for ad triggers based on level progression, total playtime, or specific cooldown periods to minimize player frustration.
- Market 'No Ads' bundles by presenting them alongside regular items using clear visual anchoring to establish high value, while gating them behind minimum purchase tiers to protect payer retention.
- Maintain a positive user experience by segmenting ad exposure through impression caps, cooldown timers, and the filtering of disruptive creative content.
+2
Sensor TowerApr 2026

Report90 pages
2026 Global Mobile Gaming Marketing Trends White Paper
The white paper establishes that the mobile‑gaming advertising ecosystem expanded rapidly in 2025, with more than 90 000 active advertisers and an influx of roughly 8 000 new entrants each month, a 22 % year‑over‑year rise. Advertisers increasingly deploy fresh creatives, with video accounting for 74 % of all ads—up 14 % YoY—and Android remains the dominant acquisition platform, though iOS shares grow for mid‑core and hard‑core titles.
Top mobile games in 2025 show a clear split between volume‑driven casual installs and value‑focused premium titles. Casual hits such as Block Blast! and Subway Surfers dominate downloads, while mid‑core and premium games generate the bulk of revenue. Leading spenders—FunPlus, Yotta Games, Hungry Studio—continue to favor Android for lower cost‑per‑install acquisition, whereas iOS delivers higher monetization per install.
The industry is moving from a linear funnel to an “Infinity Loop” model that integrates acquisition, retargeting, and lifecycle actions. Aarki’s supervised‑AI engine demonstrates the potential to boost lifetime value by up to 30 % and reduce campaign volatility, underscoring the importance of a unified, data‑driven full‑funnel strategy that prioritizes LTV over instant installs.
Early‑stage mobile games must achieve rapid habit formation, with 60‑minute daily play by week 2 and high alliance join rates. Paid‑traffic validation is critical; a Day‑1 acquisition rate below 35 % signals readiness issues. Creative trends vary by genre: lightweight socializing and parkour mini‑games dominate SLG spend, RPGs favor narrative IP‑linked content, while simulation and casual titles rely on realistic or viral short‑video formats that capture 70–80 % of impressions.
Regional insights reveal puzzle and casino titles lead creative trends in 2026, with Japan/Korea driving new creative volume and Southeast Asia showing higher local IP acceptance. Mobile‑gaming ad spend rises modestly in Oceania and South America, with Android dominating creative output. A strategic pivot toward “authenticity‑utility‑impact” stacks—solving real problems and building defensible communities—drives higher retention, while AI‑powered creatives accelerate rapid testing. Finally, marketers increasingly adopt AI and programmatic DSPs beyond walled gardens; performance gaps and trust issues persist, yet data show significant install uplifts when CTV campaigns complement mobile ads, indicating a shift toward transparent, scalable programmatic solutions.
- The mobile gaming advertising ecosystem grew by 22% year-over-year in 2025, with over 90,000 active advertisers and 8,000 new entrants joining monthly.
- Video content now accounts for 74% of all mobile game ads, representing a 14% year-over-year increase in usage.
- A shift toward an 'Infinity Loop' marketing model, supported by supervised AI, can increase player lifetime value (LTV) by up to 30% by integrating acquisition, retargeting, and lifecycle management.
- Android remains the primary platform for volume-driven acquisition due to lower costs, while iOS is increasingly favored for mid-core and hard-core titles to maximize monetization per install.
- Early-stage games require a Day-1 acquisition rate of at least 35% and 60 minutes of daily play by week two to signal long-term viability.
+1
SocialPetaApr 2026
Report52 pages
State of the Game Industry 2026
The industry snapshot reveals a workforce that remains predominantly male and White, yet shows growing diversity in gender identity, sexual orientation, and geographic mobility. Two‑thirds of respondents are male, 24 % female, and 8 % non‑binary, with 28 % identifying as LGBTQ+. The U.S. dominates the sample (54 %), and California remains the top state of residence, while Washington has experienced the largest influx. Most workers are under 35 (64 %) and concentrated in design, programming, and visual arts roles.
Layoffs continue to be a significant concern, especially within AAA studios where two‑thirds of respondents report company layoffs and nearly one in five have been personally let go. Indie studios experience fewer corporate cuts, yet a higher proportion of individuals report personal layoffs. Roughly half of all respondents anticipate no layoffs in the next year, but those with prior layoff experience express greater uncertainty.
Generative AI elicits polarized views: 42 % see it as a productivity catalyst, while 38 % view it as ethically problematic and potentially job‑threatening. The debate centers on balancing efficiency gains against concerns over originality, labor displacement, and environmental impact.
VR/AR/MR remains a niche segment, with only 8 % of respondents engaged in such projects. Meta Quest/Horizon dominates the market, and accessibility features are widely adopted, though advanced options lag behind. Monetization trends show premium titles favor digital downloads and physical copies, whereas free‑to‑play games rely heavily on in‑app purchases for currency and cosmetics.
Crunch culture persists, with 87 % of workers clocking overtime in the past year and over half citing essential work or self‑pressure as drivers. Union support is strong in the U.S., with 82 % backing unionization and a majority expressing interest, though leadership opinions are slightly more divided.
- Layoffs remain a critical industry issue, with two-thirds of AAA studio employees reporting company-wide cuts and nearly 20% of the total workforce having been personally let go.
- Workplace culture remains characterized by persistent crunch, as 87% of employees clocked overtime in the past year, largely driven by perceived necessity or self-imposed pressure.
- Generative AI adoption is deeply polarized, with 42% of professionals viewing it as a productivity tool while 38% fear it poses ethical risks and threats to job security.
- Support for labor organization is high, with 82% of U.S. respondents backing unionization and a majority expressing personal interest in joining a union.
- The industry workforce is predominantly male (66%) and under 35 (64%), with a significant concentration of talent located in the United States (54%), particularly in California and Washington.
GDCApr 2026

Report80 pages
PC & Console Gaming Report 2026
1. Market trajectory What direction is the PC and console market heading in 2026? 8 What direction is the PC and console market heading in 2026? 2. Attention & value allocation Where do players spend time and money on PC and console? 17 3. Market concentration What happens if you are not a top-20 game? 45 4.
- PC player base is projected to exceed one billion by 2028, with a CAGR of 2.9% from 2025-2028, while console player growth moderates with a 2.2% CAGR in the same period.
- Almost two-thirds of console revenues (PlayStation and Xbox) go to the top 20 games, whereas on PC, over half of revenue comes from games ranked 21+.
- PC is the only platform effectively monetizing Free-to-Play (F2P) games, with revenue holding stable despite falling playtime in the west; on console, F2P revenue is dropping faster than engagement.
- Games ranked 21+ are capturing a growing share of playtime across platforms, with PC showing the strongest shift since 2022, indicating market disaggregation and growth from outside the top 20 titles.
- Premium game revenue is growing on PC and PlayStation, but Xbox's more modest growth cannot offset declines in F2P and Call of Duty.
+3
NewzooApr 2026
Report33 pages
The Future of Consumer Apps: How AI and Game Design Principles Are Reshaping Every Category
The analysis establishes that consumer applications are entering a “Game‑Design 2.0” era, driven by AI‑native personalization, real‑time feedback and progression systems that elevate engagement and monetization across education, fintech, e‑commerce, health, social media and emerging verticals. 2025 data reveal that spending on non‑gaming apps has already eclipsed gaming, with AI emerging as the primary revenue catalyst and consumer demand for instant, tailored experiences rising sharply. Founders are advised to secure durable competitive advantages by harvesting proprietary data from launch, embedding culturally resonant narratives, and deploying AI to deliver seamless, game‑like value rather than merely branding an app as “AI‑powered.”
In high‑friction sectors, AI‑augmented game mechanics transform user behavior. Fintech platforms such as StockGro employ practice portfolios, leaderboards and AI‑personalized tutorials to convert financial discipline into instant gratification. E‑commerce brands like Temu and Bins use algorithmic discovery feeds, mystery boxes and streak rewards to boost retention beyond price. Health apps leverage voice‑first AI coaches with progression loops, while social networks such as TikTok demonstrate that behavioral AI coupled with variable rewards can drive record‑setting daily engagement. These examples underscore how immersive, AI‑enhanced game design unlocks higher user engagement and monetization in traditionally low‑engagement sectors.
BITKRAFT Ventures positions itself as a top‑decile investor in consumer apps, employing equity, crypto and non‑dilutive user acquisition financing to accelerate growth. The firm projects that by 2025 non‑gaming mobile apps will surpass gaming revenue, reaching $150 B by 2030, and that AI‑driven gamification will create rapid, defensible moats. By 2035, BITKRAFT forecasts that at least five consumer non‑gaming companies could exceed $10 B in valuation, highlighting the strategic importance of AI and game design for future digital experiences.
- Non-gaming mobile app revenue is projected to reach $150 billion by 2030, with spending in this sector already surpassing traditional gaming apps as of 2025.
- AI-driven gamification is the primary catalyst for revenue and engagement, with BITKRAFT forecasting at least five non-gaming consumer companies will exceed $10 billion valuations by 2035.
- High-friction sectors are successfully using game mechanics to drive retention; for example, fintech platforms like StockGro use leaderboards and AI-personalized tutorials to convert financial discipline into instant gratification.
- E-commerce brands such as Temu and Bins are leveraging algorithmic discovery feeds, mystery boxes, and streak rewards to boost user retention beyond simple price competition.
- Behavioral AI combined with variable rewards, as demonstrated by TikTok, is the current industry standard for driving record-setting daily engagement across social platforms.
+2
BITKRAFT VenturesMar 2026
Report19 pages
Ubisoft First-Half 2025-26 Earnings Figures
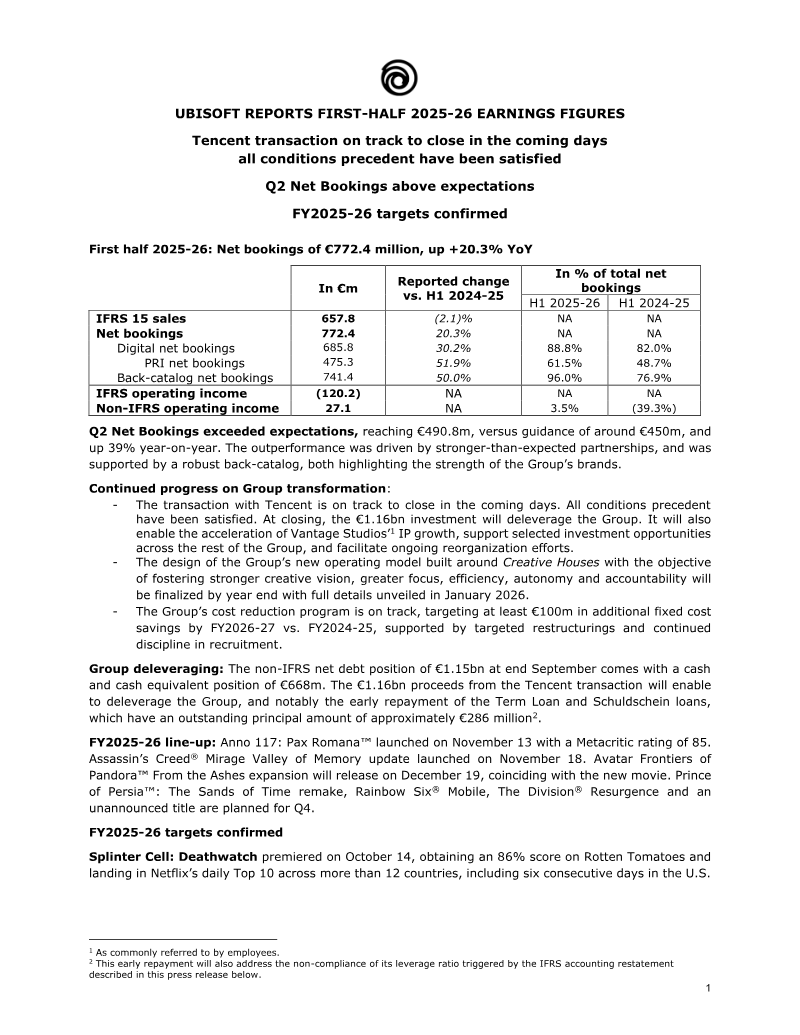
UBISOFT REPORTS FIRST-HALF 2025-26 EARNINGS FIGURES Tencent transaction on track to close in the coming days all conditions precedent have been satisfied Q2 Net Bookings above expectations First half 2025-26: Net bookings of €772.4 million, up +20.3% YoY Reported change In % of total net In €m vs.
- Ubisoft's H1 2025-26 net bookings reached €772.4 million, a 20.3% year-over-year increase, with Q2 net bookings exceeding expectations at €490.8 million (versus guidance of €450 million) due to strong partnerships and back-catalog performance.
- The transaction with Tencent, involving a €1.16 billion investment, is on track to close soon, with all conditions precedent satisfied, which will deleverage Ubisoft by enabling early repayment of approximately €286 million in loans.
- Ubisoft confirmed its FY2025-26 targets, expecting stable net bookings year-on-year, approximately break-even non-IFRS operating income, and negative free cash flow, but anticipates returning to positive non-IFRS operating income and free cash flow in FY27.
- Digital net bookings grew by 30.2% year-over-year to €685.8 million, representing 88.8% of total net bookings, while back-catalog net bookings increased by 50.0% to €741.4 million.
- Ubisoft's headcount decreased by approximately 1,500 employees over the past 12 months to 17,097, with a targeted Voluntary Leave Program and restructuring introduced at Nordic studios in October.
+2
Ubisoft
Report9 pages
Ubisoft Reports Third-Quarter 2025-26 Sales
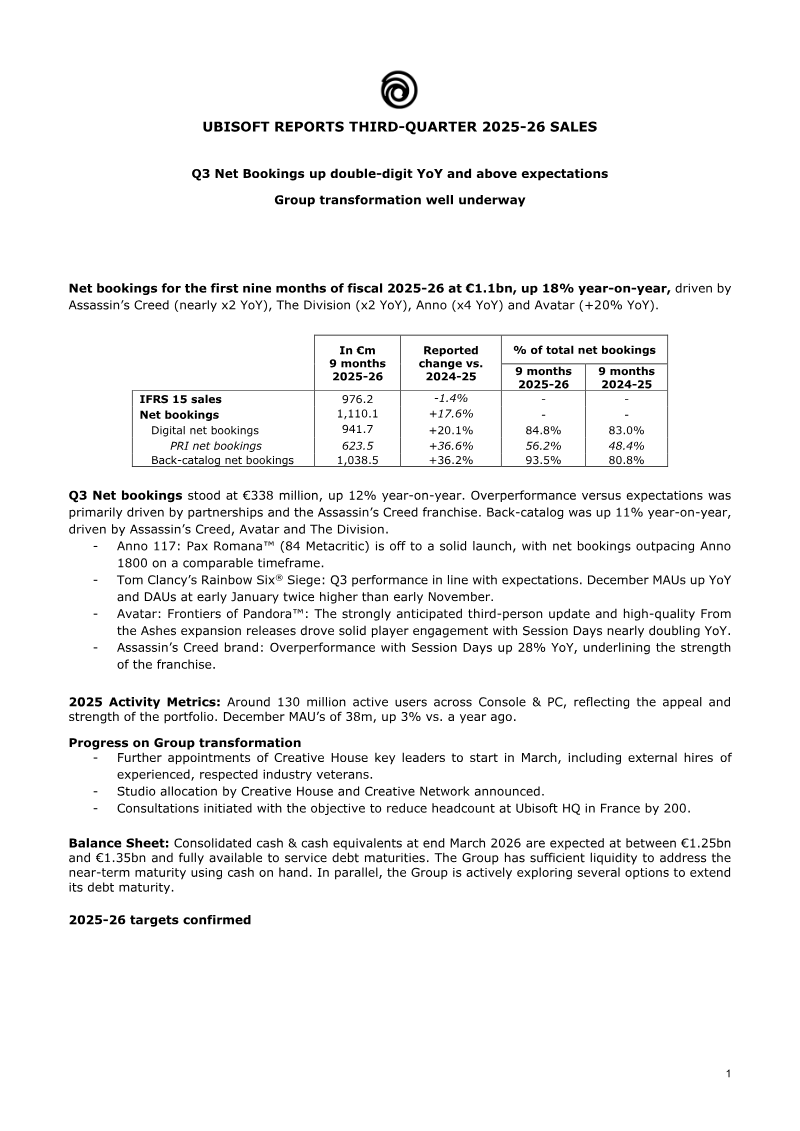
Ubisoft announced that net bookings for the first nine months of fiscal 2025‑26 reached €1.11 billion, an 18 % year‑on‑year increase driven by strong performance from Assassin’s Creed, The Division, Anno 117: Pax Romana and Avatar. Digital net bookings rose 20 % to €941.7 million, while back‑catalog sales grew 36 % to €1.04 billion, reflecting sustained demand for legacy titles and new releases such as Assassin’s Creed Shadows on Switch 2 and the Avatar: Frontiers of Pandora expansion. The third‑quarter figure of €338 million exceeded guidance by 12 %, with partnerships and franchise sales contributing most to the lift. Player activity metrics remained robust, with 130 million unique active users in 2025 and December MAUs at 38 million, up 3 % YoY.
The Group’s transformation continues, with the new Creative House operating model taking shape through studio reallocation and senior leadership appointments. Headcount reductions of 200 positions at Ubisoft HQ France are underway to streamline operations. Financially, consolidated cash stands between €1.25 billion and €1.35 billion, sufficient to cover near‑term debt maturities while the Group explores extensions of its debt profile.
Outlook for 2025‑26 confirms net bookings near €1.5 billion, non‑IFRS EBIT around –€1 billion, and free cash flow between –€400 million and –€500 million. Q4 launches include Rainbow Six Mobile, scheduled for February 23, and The Division Resurgence, with additional content planned across the franchise portfolio. Geographic revenue shares show Europe at 40 %, Northern America 46 %, and the rest of the world 14 %. Platform distribution remains dominated by consoles (55 %) and PCs (28 %), with mobile contributing 7 %.
- Ubisoft reported nine-month net bookings of €1.11 billion, an 18% year-on-year increase, with third-quarter results of €338 million exceeding guidance by 12%.
- Back-catalog sales grew 36% to €1.04 billion, driven by sustained demand for legacy titles and new releases like the Avatar: Frontiers of Pandora expansion and Assassin’s Creed Shadows.
- The company maintains a consolidated cash position between €1.25 billion and €1.35 billion while undergoing a restructuring that includes 200 headcount reductions at its French headquarters.
- Full-year 2025-26 outlook projects net bookings near €1.5 billion, with non-IFRS EBIT expected at –€1 billion and free cash flow between –€400 million and –€500 million.
- Player engagement remains strong with 130 million unique active users in 2025 and December monthly active users (MAUs) reaching 38 million, a 3% year-on-year increase.
+1
Ubisoft
Report7 pages
Ubisoft announces a major organizational, operational and portfolio reset to reclaim creative leadership and restore sustainable growth
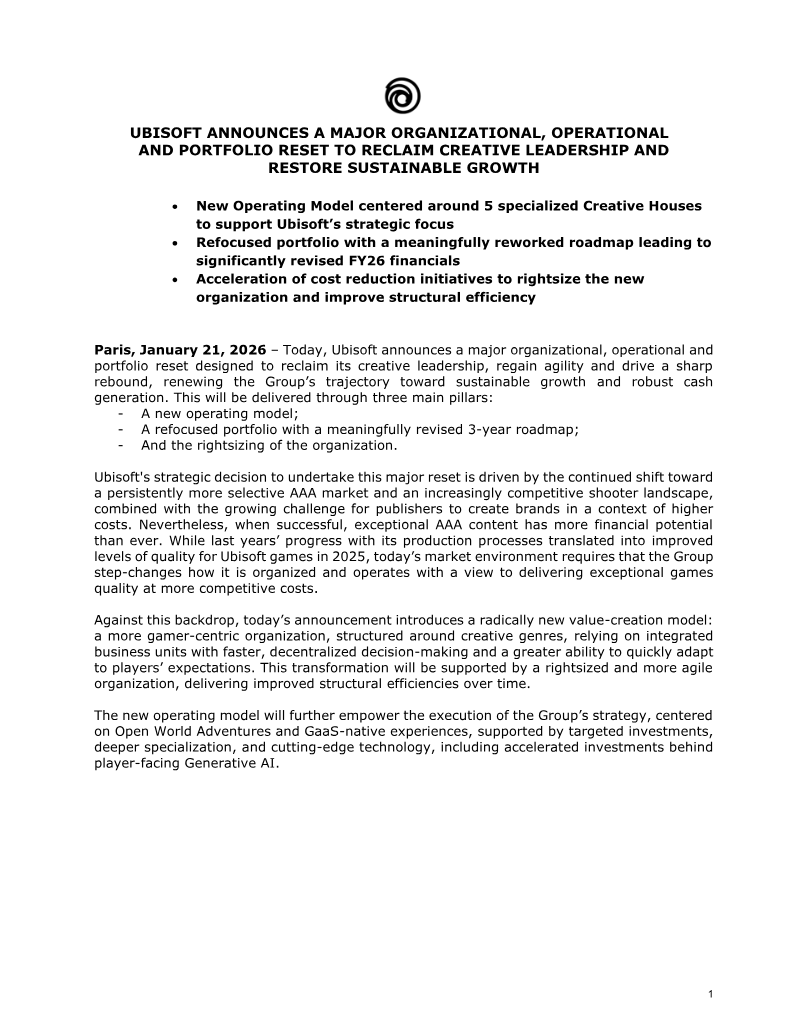
Ubisoft announces a comprehensive reset aimed at restoring creative leadership and sustainable growth amid a more selective AAA market. The strategy centers on three pillars: a new operating model, a refocused portfolio with an updated three‑year roadmap, and organizational rightsizing. The operating model introduces five Creative Houses—each genre‑focused, fully responsible for development, publishing, and financial performance—supported by a Creative Network of studios and shared Core Services. This structure is intended to accelerate decision‑making, deepen specialization in Open World Adventures and GaaS‑native experiences, and embed generative AI initiatives.
Portfolio adjustments include discontinuing six titles that fail new quality thresholds, extending development timelines for seven games to meet higher standards, and reallocating resources toward high‑potential IPs such as “March of Giants.” These changes are expected to reduce net bookings for FY26 by roughly €330 million and push non‑IFRS EBIT into the negative, reflecting one‑off depreciation costs. Free cash flow is projected between –€400 million and –€500 million, with net debt rising to €150–250 million.
Cost‑reduction efforts target a total fixed‑cost savings of approximately €500 million since FY22, with an accelerated €100 million cut already achieved by March 2026 and a further €200 million planned over the next two years, bringing fixed costs to about €1.25 billion by March 2028. The reset is set to take effect in early April, with a revised FY26–27 financial outlook to be released in May.
- Ubisoft is restructuring into five genre-focused 'Creative Houses' to accelerate decision-making and specialize in Open World Adventures and GaaS-native experiences.
- The company is discontinuing six titles and extending development timelines for seven others to meet new quality thresholds, resulting in a projected €330 million reduction in FY26 net bookings.
- Financial projections for FY26 include negative non-IFRS EBIT, free cash flow between –€400 million and –€500 million, and a net debt increase to €150–250 million.
- Fixed-cost reduction targets aim to bring total costs to approximately €1.25 billion by March 2028, with an additional €200 million in cuts planned over the next two years.
- The organizational reset includes the integration of generative AI initiatives and a strategic resource reallocation toward high-potential IPs such as 'March of Giants.'
+1
Ubisoft

Report6 pages
GungHo Business Report Vol. 42
GungHo Online Entertainment’s Vol. 42 report outlines the company’s strategic focus on expanding its two flagship intellectual properties—Puzzle & Dragons and Ragnarok—into global markets while sustaining robust financial performance. The report highlights that Puzzle & Dragons, launched in 2012, has achieved over 63 million downloads worldwide and continues to drive user engagement through frequent events, cross‑media collaborations, and a 13th‑anniversary release in May 2025. The Ragnarok franchise, managed by subsidiary Gravity Co., Ltd., has expanded from its original PC MMORPG roots to mobile and console titles, with recent releases such as Ragnarok X (PC/Android/iOS) and LUNAR Remastered Collection targeting Latin America, Southeast Asia, and other regions.
Financially, consolidated net sales rose from ¥125.3 billion in 2022 to ¥103.6 billion in 2024, with operating profit increasing from ¥27.9 billion to ¥17.5 billion over the same period. Overseas sales ratio climbed from 39.3 % in 2022 to 47.7 % in 2024, reflecting successful international penetration. The company maintained a dividend payout ratio above 30 % and executed treasury‑share repurchases totaling ¥9.86 billion in 2024, underscoring a commitment to shareholder value.
Methodologically, the report aggregates data from internal analytics on downloads, MAU, and revenue across more than 150 countries in 11 languages. It also references quarterly performance metrics and event‑based user activity to gauge engagement. Overall, the document presents a cohesive narrative of sustained growth through IP expansion, diversified platform presence, and disciplined financial management.
- GungHo’s overseas sales ratio grew from 39.3% in 2022 to 47.7% in 2024, signaling a successful shift toward international market penetration.
- Consolidated net sales decreased from ¥125.3 billion in 2022 to ¥103.6 billion in 2024, with operating profit declining from ¥27.9 billion to ¥17.5 billion over the same period.
- The flagship title Puzzle & Dragons has surpassed 63 million global downloads since its 2012 launch and is preparing for a 13th-anniversary release in May 2025.
- Subsidiary Gravity Co., Ltd. is actively diversifying the Ragnarok franchise across PC, mobile, and console platforms, specifically targeting growth in Latin America and Southeast Asia.
- The company maintains a commitment to shareholder returns, evidenced by a dividend payout ratio exceeding 30% and ¥9.86 billion in treasury-share repurchases during 2024.
+4
GungHo Online Entertainment

Report95 pages
2023 Integrated Report: Value Creation Story
O VISION ENTERTAIN We will be the world's premier provider of internet and Al technology to delight people We seek to entertain and enrich lives, and to serve and make the world a better place SERVE C Each of us harnesses our individual strengths to make our unique business succeed.
- DeNA aims to strengthen competitiveness and achieve sustainable growth by leveraging non-financial capital, despite the capital market often viewing them solely as a game company whose growth is dependent on hit titles.
- DeNA's core competencies include a combination of technical skills and experience, with a focus on absorbing cutting-edge trends like Web3 and generative AI, and their ability to combine real and virtual services.
- The Sports Business segment, through the DeNA SPORTS GROUP, has grown from 14.7 billion yen in FY2019 to 21.0 billion yen in FY2022, with an expected market size of around 100.0 billion yen.
- DeNA's Data Health Business (for insured) and Data Use Business (for industry/public) leverage health and medical data from 18.2 million people, enhancing data quality through partnerships with entities like MDV.
- DeNA's corporate governance structure includes a Board of Directors with seven directors (three independent) and a Board of Corporate Auditors with four independent outside corporate auditors, ensuring a double system of oversight.
+1
DeNA Co.

Report104 pages
2025 Integrated Report: Value Creation Story
KAWASAKI BUNKA KOEN BHTSHFUE We will be the world premier provider of internet and technology to delight people everywhere. We seek to entertain and enrich lives and to serve and make the world a better place. Each of us harnesses our individual strengths to make our unique business succeed.
- The company aims for 15.0 billion yen in non-GAAP operating profit by FY2026, with annual profit increases for the next three years. This target considers potential major game hits as upside.
- Healthcare & Medical and Sports & the Community are expected to grow, with specific profit goals of 5.0 billion yen and 3.0 billion yen respectively over the next three years.
- The Healthcare & Medical business, reorganized in FY2022, saw increased revenue in FY2024 but experienced a decrease in the healthcare area due to the data health plan formulation cycle, leading to an impairment loss. The medical area, however, saw continued growth in the adoption of the Join communication app.
- DeNA is implementing an "AI-All-IN" strategy, leveraging its technology infrastructure, diverse data assets (games, sports, healthcare), and talented engineers. They are also improving AI literacy across all employees using the DARS (DeNA AI Readiness Score) system.
- The company is shifting its game development approach from large-scale, conventional methods to a new system incorporating live operations capabilities, aiming for quicker market entry, iterative improvement, and sustained growth.
+1
DeNA Co.
Report1 pages
Financial Highlights: Fiscal Year Ending March 2011
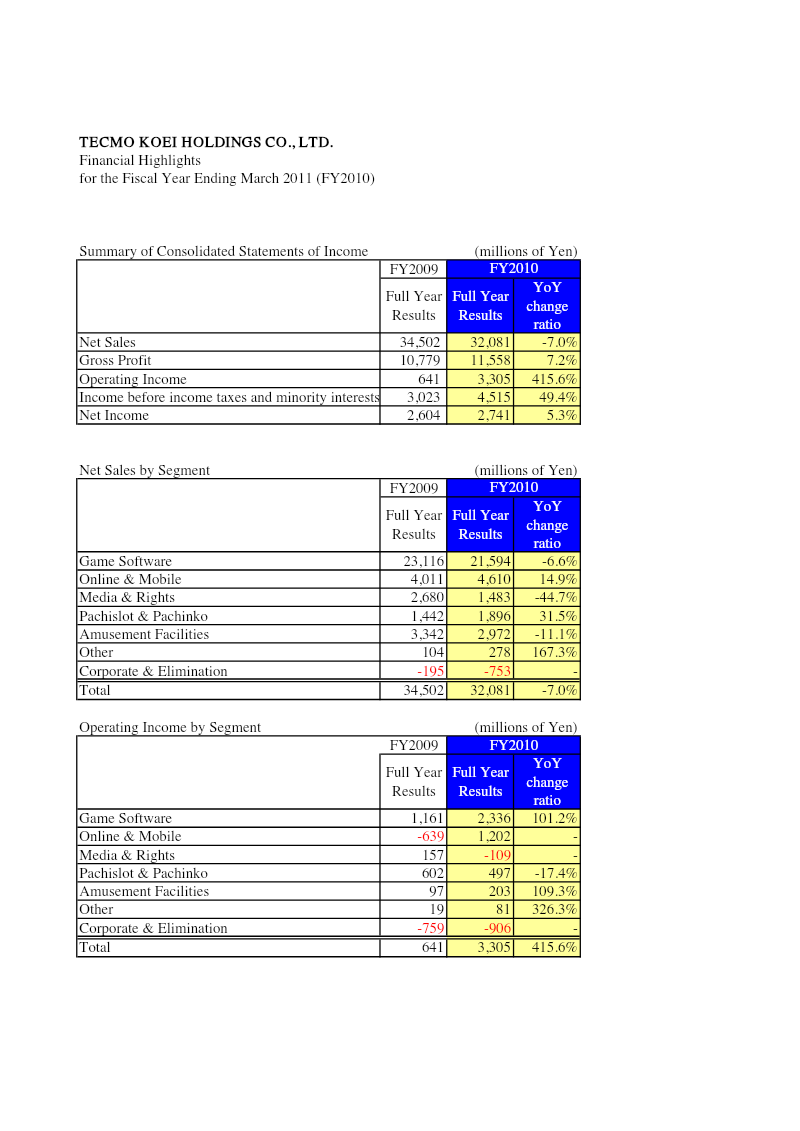
Financial highlights for the fiscal year ending March 2011 show a mixed performance for Tecmo Koei Holdings. Net sales fell 7 % to ¥32,081 million from ¥34,502 million in FY2009, driven mainly by declines in game software sales (‑6.6 %) and media & rights revenue (‑44.7 %). Conversely, online & mobile sales grew 14.9 %, and pachislot & pachinko revenue increased 31.5 %. The “Other” segment, largely comprising new or restructured businesses, surged 167.3 % to ¥278 million.
Operating income expanded dramatically by 415.6 %, rising from ¥641 million to ¥3,305 million. This surge was largely due to a 101.2 % jump in game software operating income and a 109.3 % increase in amusement facilities, offset by declines in pachislot & pachinko (‑17.4 %) and media & rights (negative contribution). The “Other” segment contributed a 326.3 % increase in operating income, reflecting successful new initiatives.
Income before taxes and minority interests grew 49.4 % to ¥4,515 million, while net income increased modestly by 5.3 % to ¥2,741 million. The company’s profitability improved despite lower sales volumes, largely through cost efficiencies and higher-margin segments.
The analysis covers Japan‑based operations for FY2010, using consolidated financial statements. Data are presented in millions of yen, with year‑over‑year comparisons highlighting key segment shifts and overall profitability trends.
- Tecmo Koei Holdings achieved a 415.6% surge in operating income to ¥3,305 million for the fiscal year ending March 2011, despite a 7% decline in net sales to ¥32,081 million.
- Profitability improved significantly through cost efficiencies and high-margin performance, resulting in a 49.4% increase in income before taxes and minority interests to ¥4,515 million.
- The core game software segment saw a 6.6% decline in sales but experienced a 101.2% jump in operating income, indicating a shift toward more profitable operations.
- Revenue diversification efforts showed mixed results, with online & mobile sales growing 14.9% and pachislot & pachinko revenue rising 31.5%, though the latter saw a 17.4% decline in operating income.
- The 'Other' business segment, focused on new initiatives, demonstrated strong growth with a 167.3% increase in sales to ¥278 million and a 326.3% rise in operating income.
+1
Koei Tecmo
Report1 pages
Financial Highlights: 1st Quarter of the Fiscal Year Ending March 2012
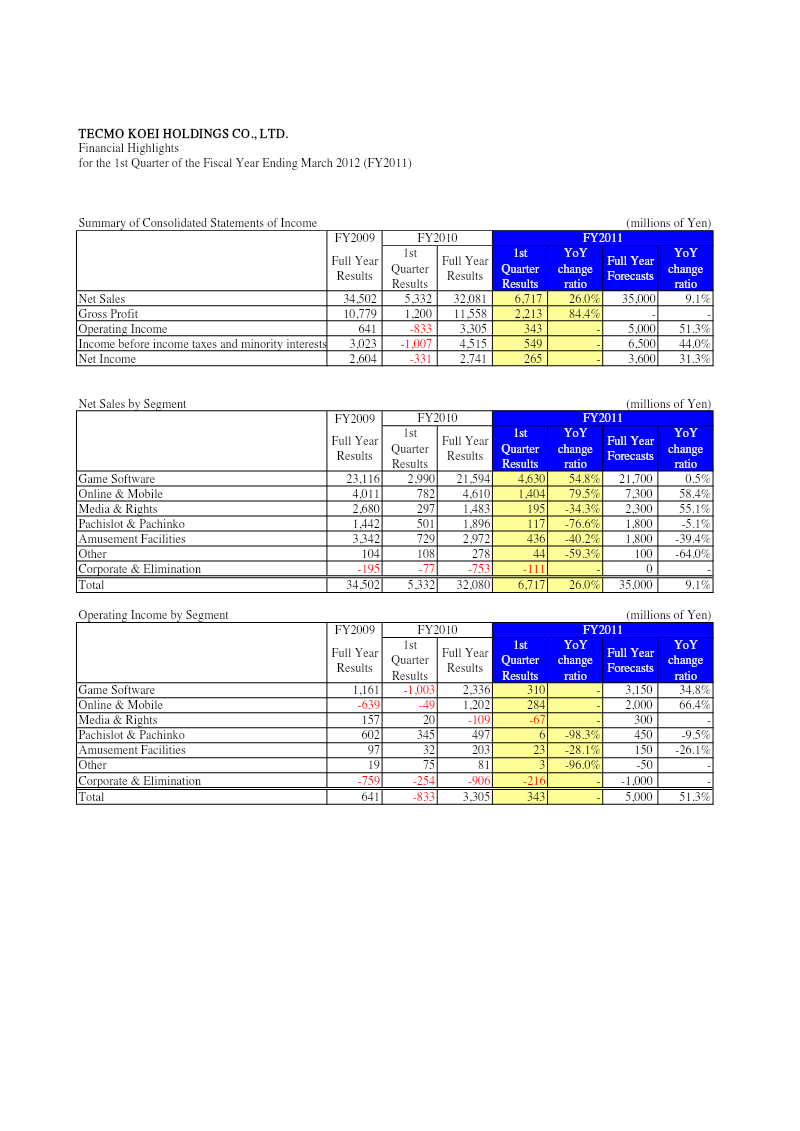
The financial highlights present Tecmo Koei Holdings’ performance for the first quarter of fiscal year 2011, ending March 31, 2012. Net sales rose 26 % year‑over‑year to ¥34.5 billion, driven primarily by the Game Software segment, which generated ¥23.1 billion in sales and contributed a 54.8 % increase from the previous year’s first quarter. Online & Mobile sales also grew strongly, up 79.5 % to ¥4.6 billion, while Media & Rights and Pachislot & Pachinko segments declined sharply by 34.3 % and 76.6 %, respectively. Amusement Facilities sales fell 40.2 %. Corporate and elimination items offset gains, resulting in a net income of ¥2.6 billion, up 31.3 % from the prior year’s first quarter.
Operating income improved markedly to ¥641 million, a 51.3 % increase from the prior year’s first quarter, largely due to gains in Game Software (¥1.16 billion) and Online & Mobile (¥1.20 billion). However, the Media & Rights segment posted a loss of ¥109 million, and Pachislot & Pachinko’s operating income fell 98.3 % to ¥497 million, reflecting a significant downturn in that business line.
The report covers Japan‑based operations across five core segments—Game Software, Online & Mobile, Media & Rights, Pachislot & Pachinko, and Amusement Facilities—over the first quarter of FY2011. Data are presented in millions of yen, with year‑on‑year comparisons and forecasts for the full fiscal year. The methodology relies on consolidated financial statements, with no explicit survey or sampling details disclosed. Overall, the company experienced robust growth in its core gaming and online divisions, offset by declines in traditional gambling‑related businesses.
- Tecmo Koei Holdings reported a 26% year-over-year increase in net sales to ¥34.5 billion and a 31.3% rise in net income to ¥2.6 billion for the first quarter of the fiscal year ending March 2012.
- The Game Software segment was the primary growth driver, generating ¥23.1 billion in sales—a 54.8% increase compared to the same period in the previous year.
- The Online & Mobile segment experienced significant expansion, with sales rising 79.5% to ¥4.6 billion and contributing ¥1.20 billion to operating income.
- Operating income for the company reached ¥641 million, a 51.3% improvement year-over-year, bolstered by strong performance in the gaming and online divisions.
- The Pachislot & Pachinko segment suffered a major downturn, with sales falling 76.6% and operating income declining by 98.3% to ¥497 million.
+1
Koei Tecmo
Report1 pages
Financial Highlights: 3rd Quarter of the Fiscal Year Ending March 2012
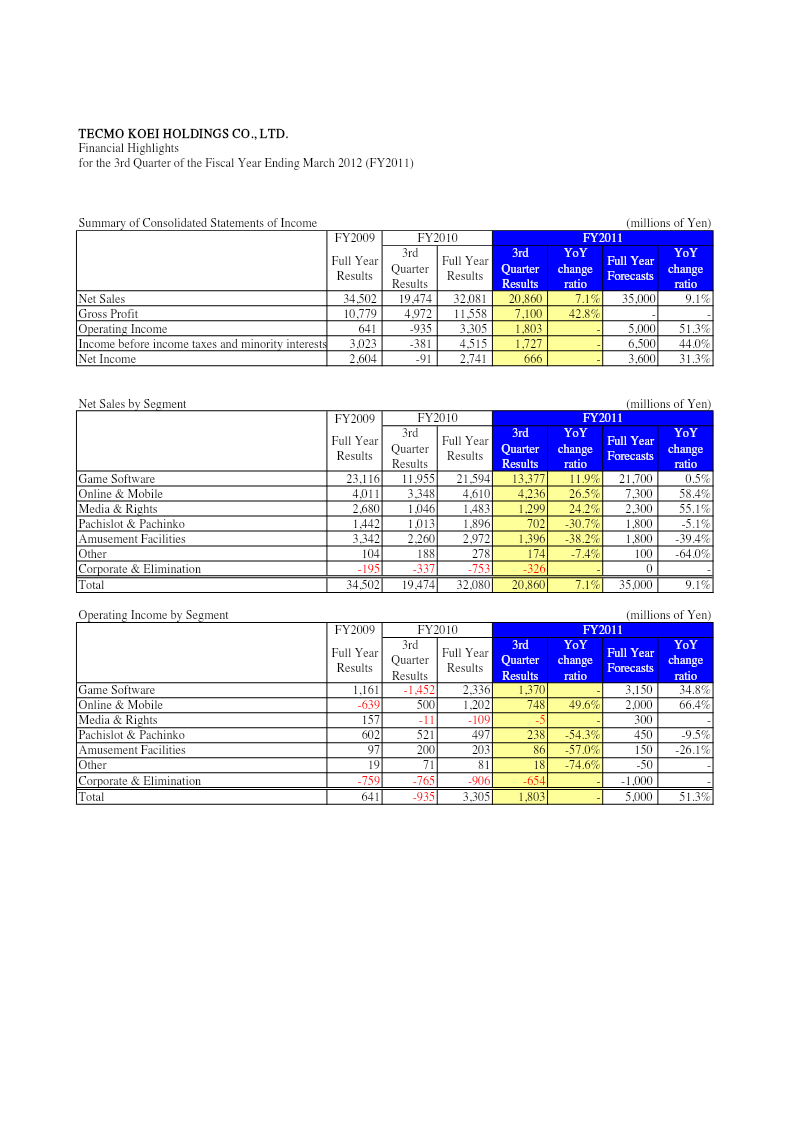
The financial highlights for the third quarter of fiscal year 2011 (ending March 2012) show a modest improvement in consolidated performance compared with the same period in 2010. Net sales rose by 7.1 % to ¥32,080 million from ¥29,974 million in the prior year’s third quarter. Gross profit increased 42.8 % to ¥11,558 million, while operating income surged 51.3 % to ¥3,305 million, reflecting stronger profitability across most business segments.
Segment analysis reveals that Game Software sales grew 11.9 % to ¥21,594 million, contributing the largest share of operating income (¥2,336 million). Online & Mobile sales expanded 26.5 % to ¥4,610 million and generated a positive operating income of ¥1,202 million after a loss in the previous year. Media & Rights sales increased 24.2 % to ¥1,483 million but produced a modest operating profit of ¥157 million. Pachislot & Pachinko and Amusement Facilities sales both declined sharply (−30.7 % and −38.2 %, respectively), resulting in lower operating contributions of ¥497 million and ¥203 million. The Other segment saw a 7.4 % sales rise but remained a small contributor to operating income.
Overall, the company’s forecasted full‑year net sales for FY2011 were set at ¥35,000 million, a 9.1 % increase over the prior year’s full‑year figure. Operating income forecasts were raised to ¥5,000 million, reflecting a 51.3 % year‑over‑year improvement. The data derive from consolidated financial statements covering all business segments in Japan, with figures reported in millions of yen.
- Consolidated net sales for Q3 of the fiscal year ending March 2012 rose 7.1% to ¥32,080 million, while operating income surged 51.3% to ¥3,305 million.
- The Game Software segment remains the primary driver of profitability, growing 11.9% to ¥21,594 million in sales and contributing ¥2,336 million in operating income.
- The Online & Mobile segment achieved a turnaround, growing 26.5% to ¥4,610 million in sales and generating ¥1,202 million in operating income after posting a loss in the prior year.
- Pachislot & Pachinko and Amusement Facilities segments experienced significant declines, with sales falling 30.7% and 38.2% respectively.
- Full-year forecasts for FY2011 were updated to ¥35,000 million in net sales, representing a 9.1% year-over-year increase.
+1
Koei Tecmo
Report2 pages
Financial Highlights: 1st Quarter of Fiscal Year Ending March 2014
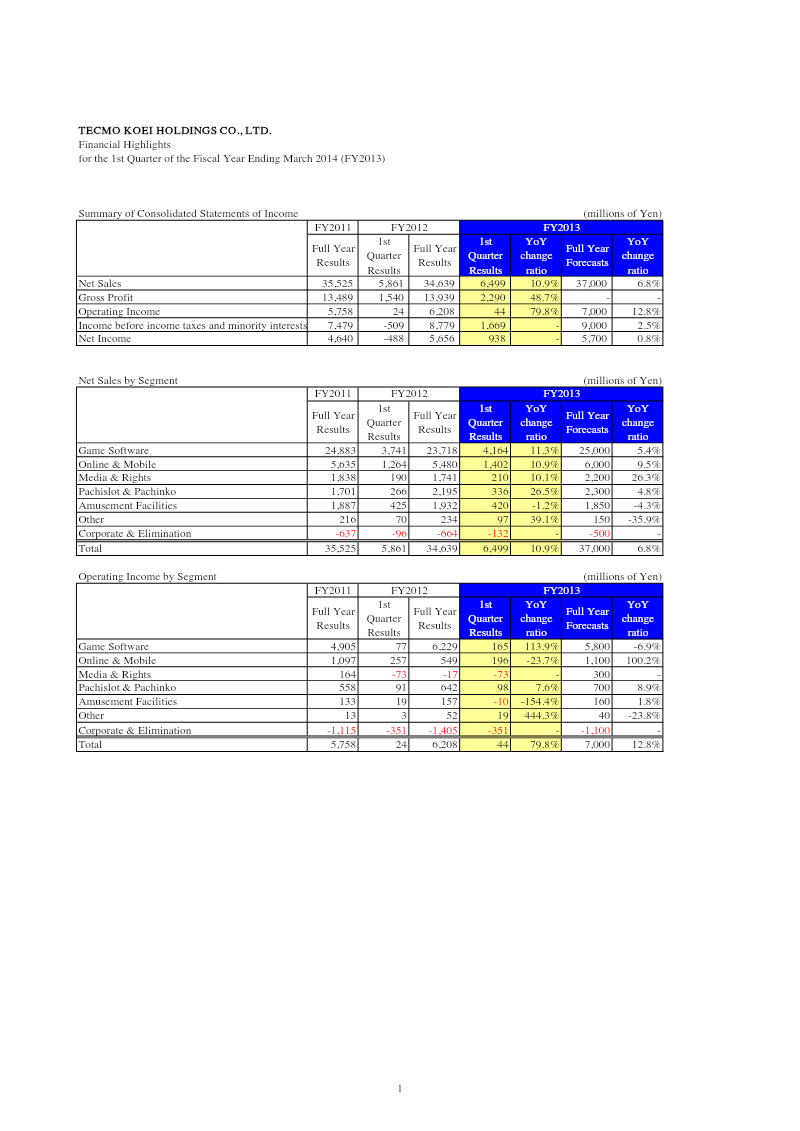
The first‑quarter results for the fiscal year ending March 2014 show a 10.9 % rise in consolidated net sales to ¥35,525 million, driven mainly by a 10.9 % increase in game‑software revenue and a 26.5 % jump in pachislot & pachinko sales. Operating income climbed 79.8 % to ¥6,208 million, largely from a 113.9 % surge in game‑software operating profit and a 444.3 % rise in the “Other” segment, offset by declines in online & mobile and amusement‑facility operating income. Net income increased 938 million yen (18.0 % YoY) to ¥5,656 million, although the year‑to‑date net income for FY2013 remained slightly below forecast at ¥5,700 million.
Segment‑level analysis indicates that game software remains the core driver of profitability, while online & mobile revenue grew modestly (10.9 %) but with a 23.7 % decline in operating income, reflecting higher costs or lower margins. Media & rights and pachislot & pachinko segments showed modest operating gains, whereas amusement facilities experienced a 10.4 % drop in operating income.
Balance‑sheet activity shows current assets falling from ¥31,416 million to ¥19,267 million as cash and receivables declined sharply, while fixed assets remained stable. Total assets increased to ¥65,782 million, supported by a rise in investment securities. Current liabilities dropped from ¥12,303 million to ¥4,708 million, largely due to reduced trade payables and accrued bonuses. Shareholders’ equity decreased slightly from ¥82,392 million to ¥80,478 million, reflecting a modest decline in retained earnings and treasury stock adjustments. Overall, the company maintained solid revenue growth and profitability in Q1 FY2014, with notable strength in its core game‑software segment.
- Consolidated net sales rose 10.9% to ¥35,525 million in Q1 FY2014, driven by a 10.9% increase in game-software revenue and a 26.5% surge in pachislot & pachinko sales.
- Operating income grew 79.8% to ¥6,208 million, bolstered by a 113.9% increase in game-software operating profit and a 444.3% rise in the 'Other' segment.
- Net income increased 18.0% year-over-year to ¥5,656 million, though this figure fell slightly short of the ¥5,700 million forecast for the period.
- While online & mobile revenue grew by 10.9%, the segment's operating income declined by 23.7%, indicating reduced margins or increased operational costs.
- Amusement facility operations underperformed, recording a 10.4% drop in operating income during the quarter.
+1
Koei Tecmo
Report2 pages
Financial Highlights: Q1 FY2014
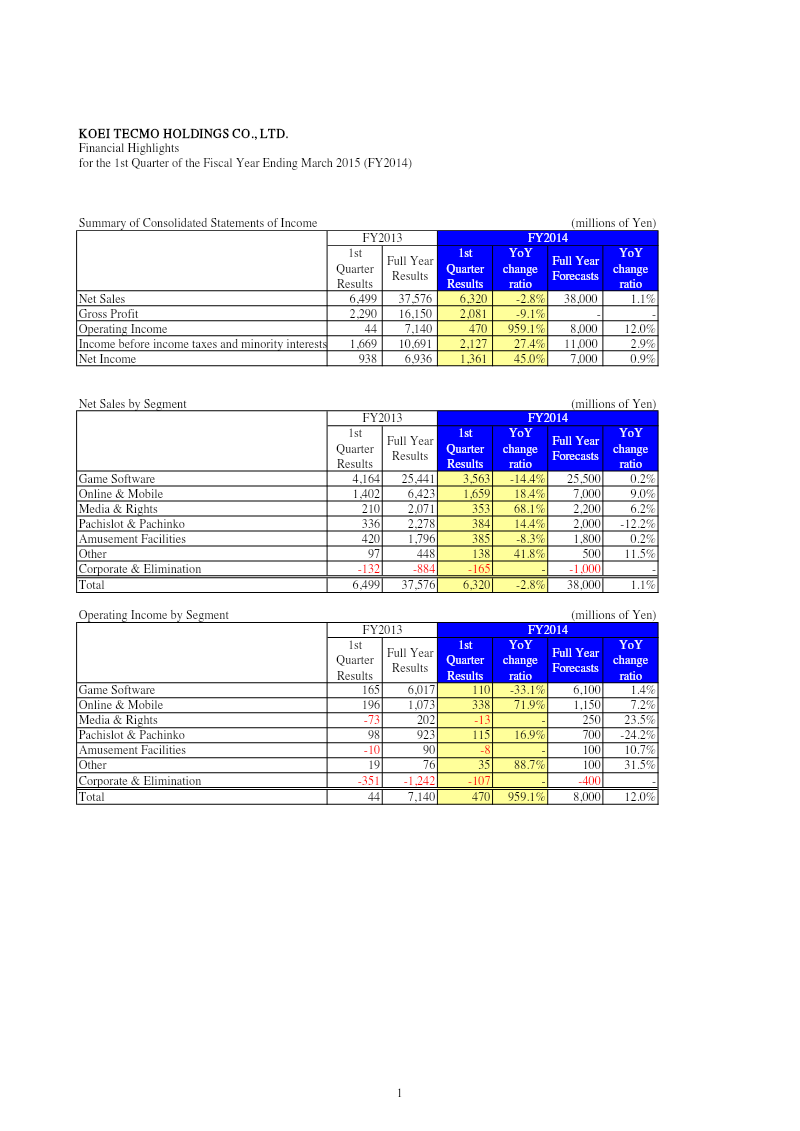
Financial highlights for the first quarter of fiscal year 2014 demonstrate a robust performance across KOEI TECMO HOLDINGS’ diversified portfolio. Net sales reached ¥37,576 million, a 2.8% decline from the prior year’s full‑year figure but aligned with the forecasted ¥38,000 million. Gross profit fell 9.1% to ¥16,150 million, while operating income surged 959.1% to ¥7,140 million, reflecting a sharp rise in profitability from the core gaming segment. Income before taxes climbed 27.4% to ¥10,691 million, and net income increased 45.0% to ¥6,936 million, approaching the forecasted ¥7,000 million.
Segment analysis shows Game Software sales of ¥25,441 million, down 14.4% YoY but near forecasted levels; Online & Mobile sales rose 18.4% to ¥6,423 million, surpassing the projected ¥7,000 million by 9.0%. Media & Rights and Pachislot & Pachinko segments posted significant gains of 68.1% and 18.4%, respectively, while Amusement Facilities declined 8.3%. Operating income mirrored these trends: Game Software contributed ¥6,017 million (−33.1% YoY), Online & Mobile added ¥1,073 million (+71.9%), and Media & Rights turned a profit of ¥202 million after a prior loss.
Balance‑sheet data as of June 30, 2014 show total assets at ¥93,826 million, down from ¥100,622 million the previous year, largely due to a reduction in current assets and a modest decline in fixed assets. Current liabilities fell sharply from ¥10,122 million to ¥4,421 million, improving liquidity. Shareholders’ equity remained strong at ¥84,433 million, with retained earnings slightly lower than the prior year. Overall, the quarter reflects a strategic shift toward higher‑margin online and mobile offerings while maintaining solid financial health.
- KOEI TECMO HOLDINGS reported a massive 959.1% surge in operating income to ¥7,140 million for Q1 FY2014, driven by increased profitability in its core gaming segment.
- Net income rose 45.0% to ¥6,936 million, nearly meeting the company's ¥7,000 million forecast despite a 2.8% decline in net sales to ¥37,576 million.
- The Online & Mobile segment outperformed expectations with an 18.4% sales increase to ¥6,423 million and a 71.9% rise in operating income to ¥1,073 million.
- Game Software sales fell 14.4% year-over-year to ¥25,441 million, resulting in a 33.1% decline in segment operating income to ¥6,017 million.
- Media & Rights and Pachislot & Pachinko segments saw significant growth, with sales increasing by 68.1% and 18.4% respectively.
+1
Koei Tecmo
Report2 pages
Financial Highlights: 3rd Quarter of the Fiscal Year Ending March 2015
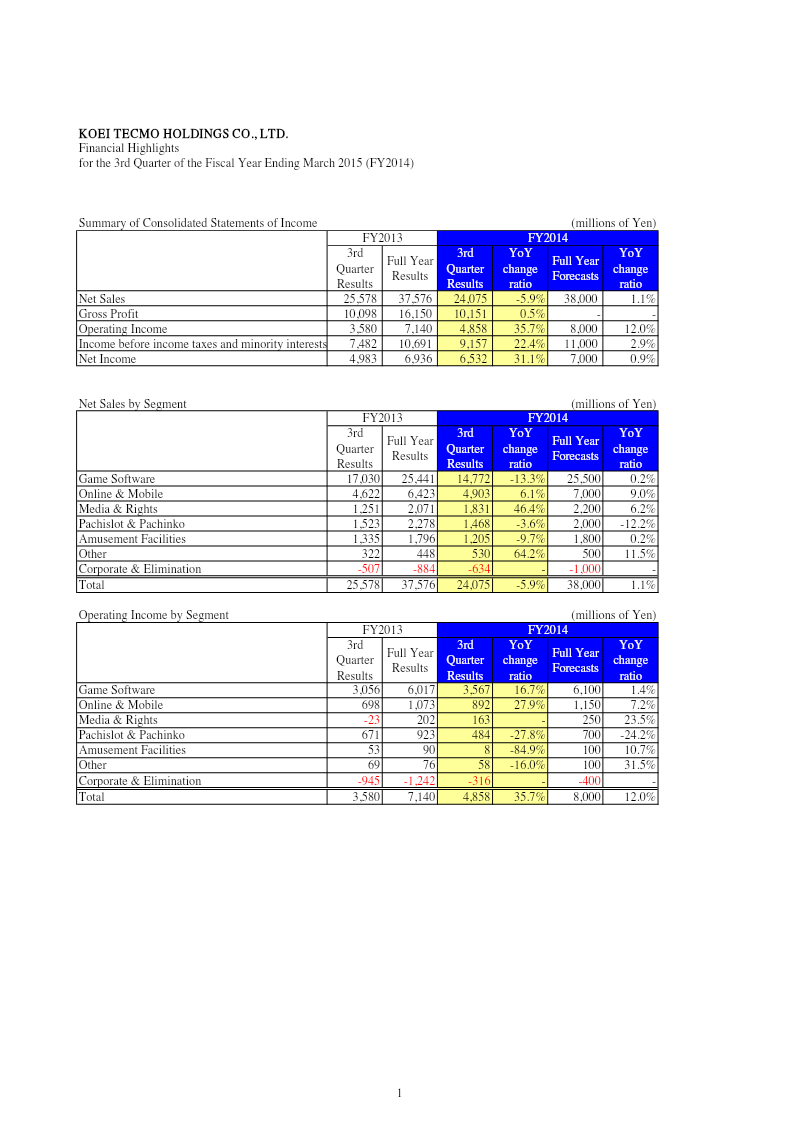
Financial highlights for the third quarter of fiscal year 2014, ending March 31 2015, show a robust performance across KOEI TECMO HOLDINGS’ core segments. Net sales rose to ¥37,576 million from ¥25,578 million in the same quarter of FY2013, a 5.9% decline versus the prior year but an increase of 1.1 % against the company’s forecast. Gross profit climbed to ¥16,150 million, up 0.5 % from the previous year’s figure, while operating income surged to ¥7,140 million, a 35.7 % jump from the prior year’s ¥3,580 million and 12.0 % above forecasted levels. Net income reached ¥6,936 million, up 31.1 % from FY2013’s ¥4,983 million and slightly above the projected ¥7,000 million.
Segment analysis reveals that Game Software sales increased to ¥25,441 million, a 13.3 % year‑over‑year decline but only 0.2 % below forecast, whereas Online & Mobile sales grew by 6.1 % to ¥6,423 million, outperforming the 9.0 % forecasted rise. Media & Rights sales expanded sharply by 46.4 % to ¥2,071 million, surpassing the 6.2 % forecasted growth. Pachislot & Pachinko and Amusement Facilities sales fell 3.6 % and 9.7 %, respectively, yet both remained close to or above their forecasted changes.
Operating income by segment mirrored these trends: Game Software and Online & Mobile segments delivered the largest gains, while Media & Rights shifted from a loss to a profit of ¥202 million. The company’s balance sheet strengthened, with total assets increasing from ¥100,622 million to ¥106,432 million and shareholders’ equity rising to ¥89,845 million. Current liabilities fell markedly, improving liquidity ratios. Overall, the quarter demonstrated solid profitability growth driven by strong performance in core software and online segments, offsetting declines in traditional gaming and amusement operations.
- KOEI TECMO HOLDINGS achieved a 35.7% surge in operating income to ¥7,140 million, significantly outperforming the company's forecast by 12.0%.
- Net income for the third quarter ending March 31, 2015, rose 31.1% year-over-year to ¥6,936 million, despite a 5.9% decline in net sales to ¥37,576 million compared to the prior year.
- The Media & Rights segment experienced a sharp 46.4% revenue expansion to ¥2,071 million, successfully shifting from a loss to a profit of ¥202 million.
- Online & Mobile sales grew by 6.1% to ¥6,423 million, contributing to the company's overall profitability alongside the core Game Software segment.
- Game Software sales totaled ¥25,441 million, representing a 13.3% year-over-year decline that remained nearly in line with forecasts at 0.2% below projections.
+1
Koei Tecmo
Report2 pages
Financial Highlights: 1st Half of the Fiscal Year Ending March 2016
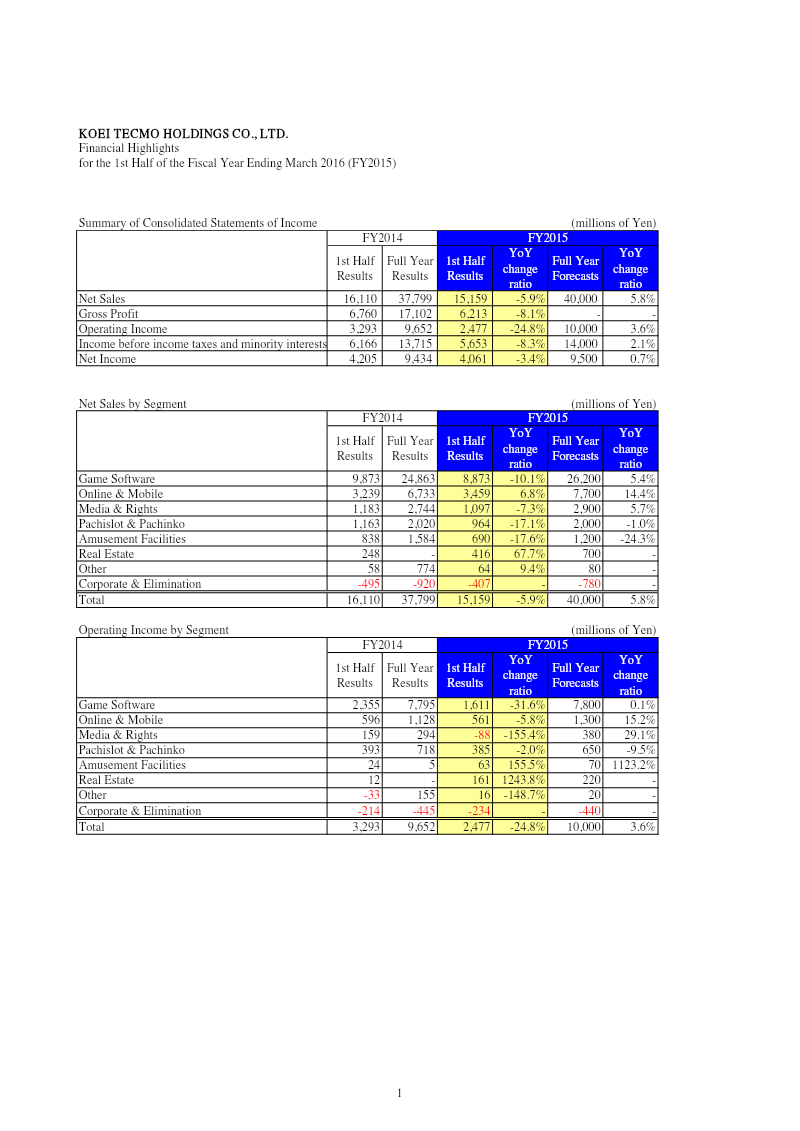
Koei Tecmo Holdings reported its first‑half financial results for the fiscal year ending March 2016, showing a 5.9 % decline in net sales to ¥37.8 billion compared with the same period a year earlier, while full‑year sales are projected to rise 5.8 % to ¥40 billion. Gross profit fell 8.1 % to ¥17.1 billion, and operating income dropped 24.8 % to ¥9.7 billion; net income decreased 3.4 % to ¥9.4 billion, reflecting a modest 0.7 % increase over the full‑year forecast of ¥9.5 billion.
Segment analysis indicates that Game Software sales declined 10.1 % to ¥24.9 billion, whereas Online & Mobile sales grew 6.8 % to ¥6.7 billion, and Media & Rights sales rose 5.4 % to ¥26.2 billion. Pachislot & Pachinko and Amusement Facilities segments experienced sharp declines of 17.1 % and 17.6 %, respectively, while Real Estate sales increased 67.7 %. Operating income was strongest in Game Software (¥7.8 billion) and Online & Mobile (¥1.3 billion), with Media & Rights showing a 155.4 % decline.
Balance‑sheet highlights show total assets reduced from ¥115.2 billion to ¥101.5 billion, largely due to a drop in investment securities and current assets. Current liabilities fell from ¥10.9 billion to ¥6.0 billion, and long‑term liabilities decreased from ¥3.6 billion to ¥1.1 billion, improving liquidity and leverage ratios. Shareholders’ equity remained stable at ¥92.2 billion, with retained earnings slightly lower. The company’s financial position remains solid, though operating performance is pressured by declines in core gaming and amusement segments.
- Koei Tecmo reported a 5.9% decline in net sales to ¥37.8 billion for the first half of the fiscal year ending March 2016, though the company projects a 5.8% increase in full-year sales to ¥40 billion.
- Operating income fell by 24.8% to ¥9.7 billion, while net income saw a more modest decline of 3.4% to ¥9.4 billion.
- The core Game Software segment experienced a 10.1% revenue decline to ¥24.9 billion, though it remained the primary driver of operating income at ¥7.8 billion.
- Growth was observed in the Online & Mobile segment, which rose 6.8% to ¥6.7 billion, and the Real Estate segment, which surged 67.7%.
- Pachislot & Pachinko and Amusement Facilities segments faced significant downturns, with revenues dropping 17.1% and 17.6% respectively.
+1
Koei Tecmo
Report2 pages
Financial Highlights: 3rd Quarter of the Fiscal Year Ending March 2016
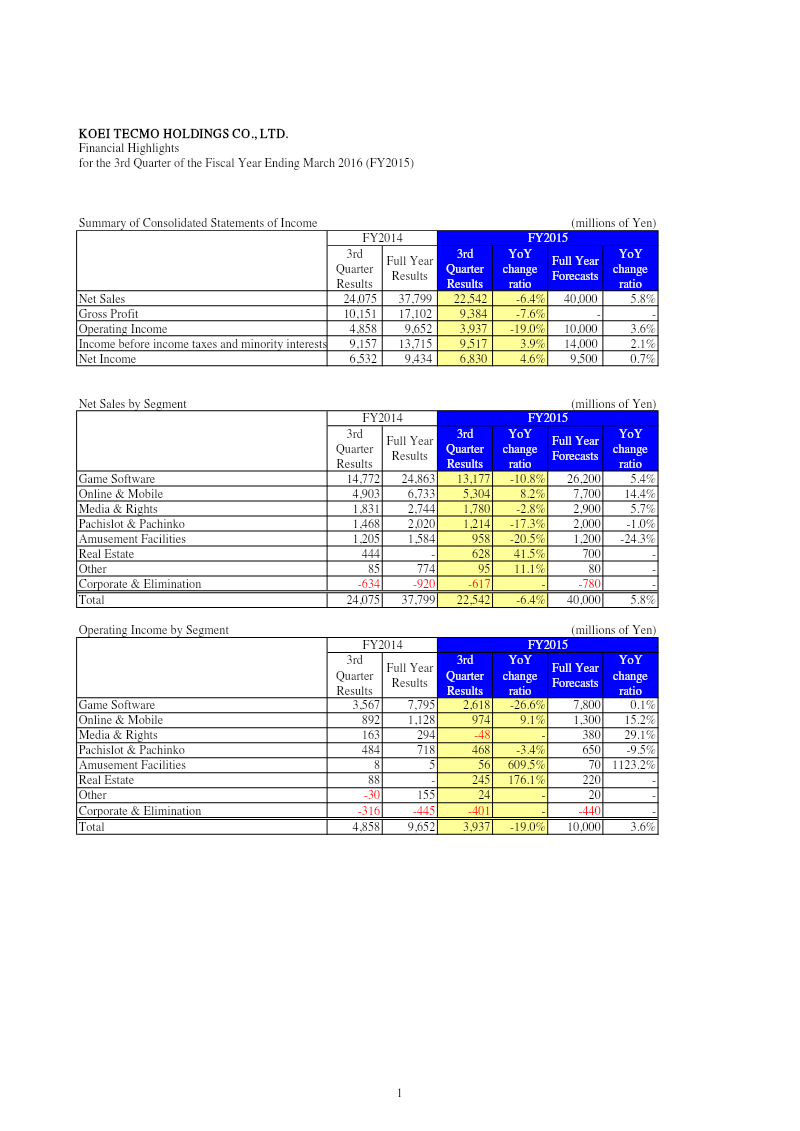
Koei Tecmo Holdings reported a strong third‑quarter performance for fiscal year 2015, with net sales rising to ¥37.8 billion from ¥24.1 billion in the same period of FY2014, a 6.4% increase that exceeded the ¥40 billion forecast by 5.8%. Gross profit grew to ¥17.1 billion, up 7.6% from the prior year’s quarter, while operating income surged to ¥9.65 billion, a 19% rise that still fell short of the ¥10 billion target by 3.6%. Net income reached ¥9.43 billion, up 4.6% year‑on‑year and slightly below the ¥9.5 billion forecast.
Segment analysis shows Game Software sales at ¥24.86 billion, a 10.8% decline from the previous year’s quarter but still above the ¥26.2 billion forecast by 5.4%. Online & Mobile sales increased 8.2% to ¥6.73 billion, outperforming the ¥7.7 billion forecast by 14.4%. Media & Rights, Pachislot & Pachinko, and Amusement Facilities all posted declines ranging from 2.8% to 20.5%, with the latter two falling below forecast expectations. Real Estate sales rose sharply by 41.5% to ¥628 million, while Other segment sales grew 11.1%.
Operating income by segment mirrored these trends: Game Software contributed ¥7.8 billion, Online & Mobile added ¥1.13 billion, and Media & Rights delivered a modest ¥294 million. Pachislot & Pachinko added ¥718 million, and Amusement Facilities surprisingly posted a 609.5% increase to ¥56 million, though still below the ¥70 million forecast.
Balance‑sheet data as of December 31, 2015 show total assets at ¥104.5 billion, down from ¥115.2 billion a year earlier, largely due to reductions in current assets and investment securities. Current liabilities fell to ¥5.38 billion from ¥10.95 billion, improving liquidity. Shareholders’ equity rose to ¥95.0 billion, supported by retained earnings and a modest increase in capital surplus. Overall, the company maintained solid profitability while tightening its balance sheet ahead of the next fiscal year.
- Koei Tecmo reported net sales of ¥37.8 billion for Q3 FY2015, a 6.4% year-over-year increase that exceeded the company's ¥40 billion forecast by 5.8%.
- Operating income rose 19% year-over-year to ¥9.65 billion, though this result fell 3.6% short of the ¥10 billion target.
- Net income reached ¥9.43 billion, representing a 4.6% year-over-year increase but missing the ¥9.5 billion forecast.
- The Game Software segment, the company's primary revenue driver, generated ¥24.86 billion in sales, marking a 10.8% decline from the previous year.
- Online & Mobile sales grew by 8.2% to ¥6.73 billion, outperforming the segment's forecast by 14.4%.
+1
Koei Tecmo