
Dragon Quest Walk
GameBy COLOPL, Inc. · Released Sep 12, 2019
Documents about Dragon Quest Walk

Monster Hunter Now: Has Niantic Finally Found Another Pokémon Go-Sized Hit?
This analysis evaluates the initial performance and potential longevity of Niantic's Monster Hunter Now, comparing its success to Pokémon GO and other location-based AR titles.
- Monster Hunter Now has successfully established itself in the top 200 grossing apps in the US, marking a significant improvement over Niantic’s previous title, Peridot, which failed to maintain its initial ranking.
- The game’s success is driven by its adaptation of the established Monster Hunter franchise, which has sold over 94 million copies globally and gained significant Western recognition through console titles like Monster Hunter World.
- Location-based AR games see higher adoption in Japan than in the US, with three such titles currently in the Japanese top 20, compared to only two in the US market.
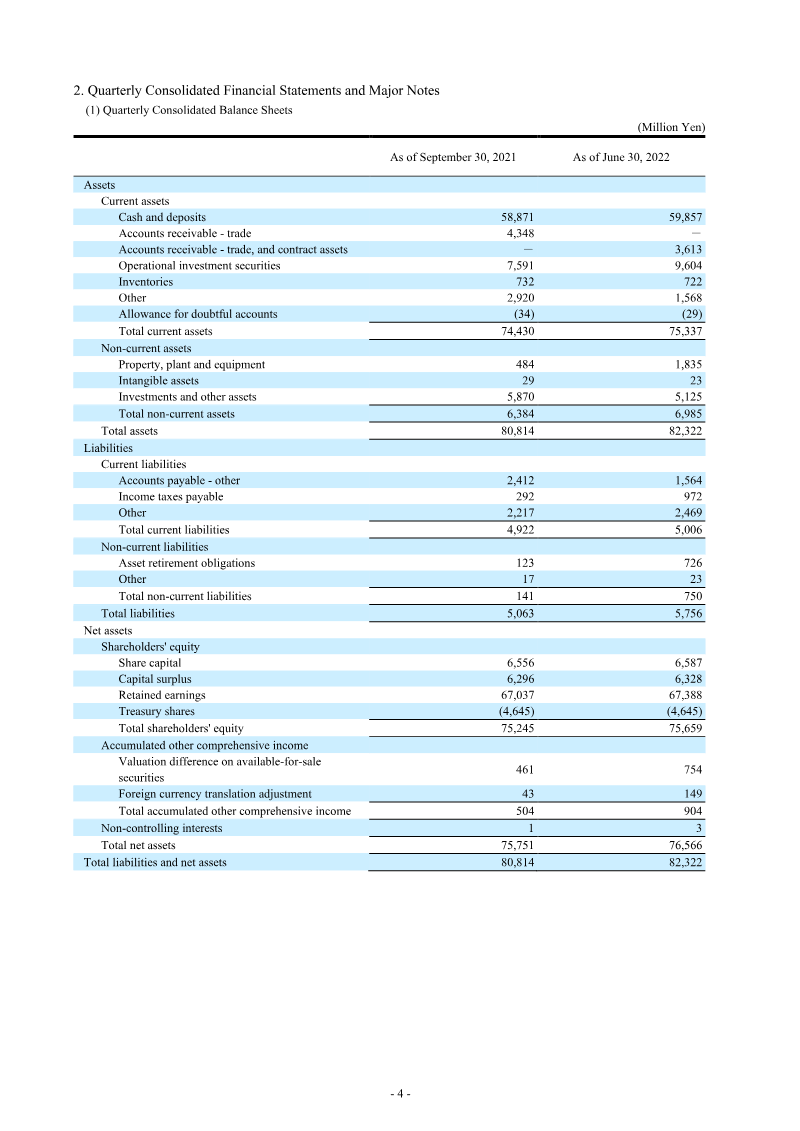
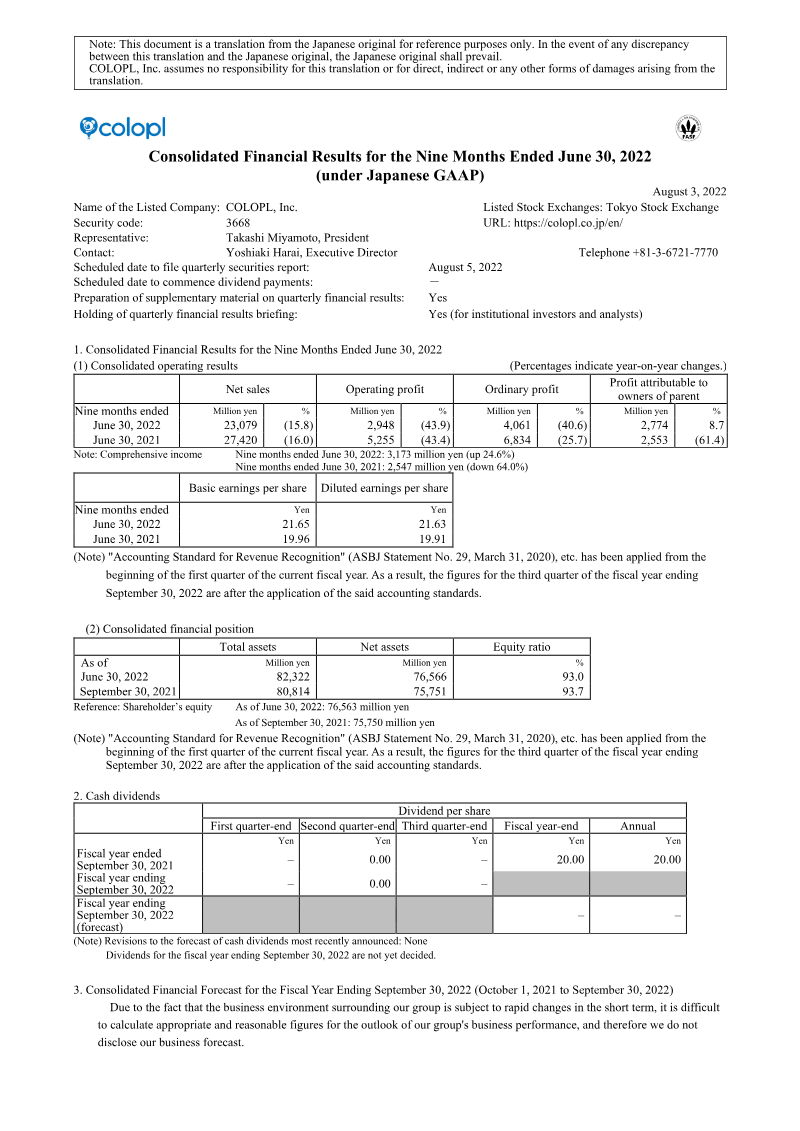
COLOPL Consolidated Financial Results for the Nine Months Ended June 30, 2022
COLOPL, Inc. reported its consolidated financial results for the nine-month period ending June 30, 2022, reflecting a challenging fiscal environment characterized by decreased net sales and operating profits compared to the same period in the previous year.
- Net sales fell 15.8% to 23,079 million yen and operating profit fell 43.9% to 2,948 million yen for the nine months ended June 30, 2022, compared with the prior-year period.
- Profit attributable to owners of the parent rose 8.7% to 2,774 million yen despite the core operating declines, a gap the report does not fully explain in the summarized content beyond the broader accounting and consolidation changes.
- The Entertainment Business drove nearly all revenue, generating 22,748 million yen in sales and 2,869 million yen in operating profit, supported by ongoing titles Dragon Quest Walk and Shironeko Project.
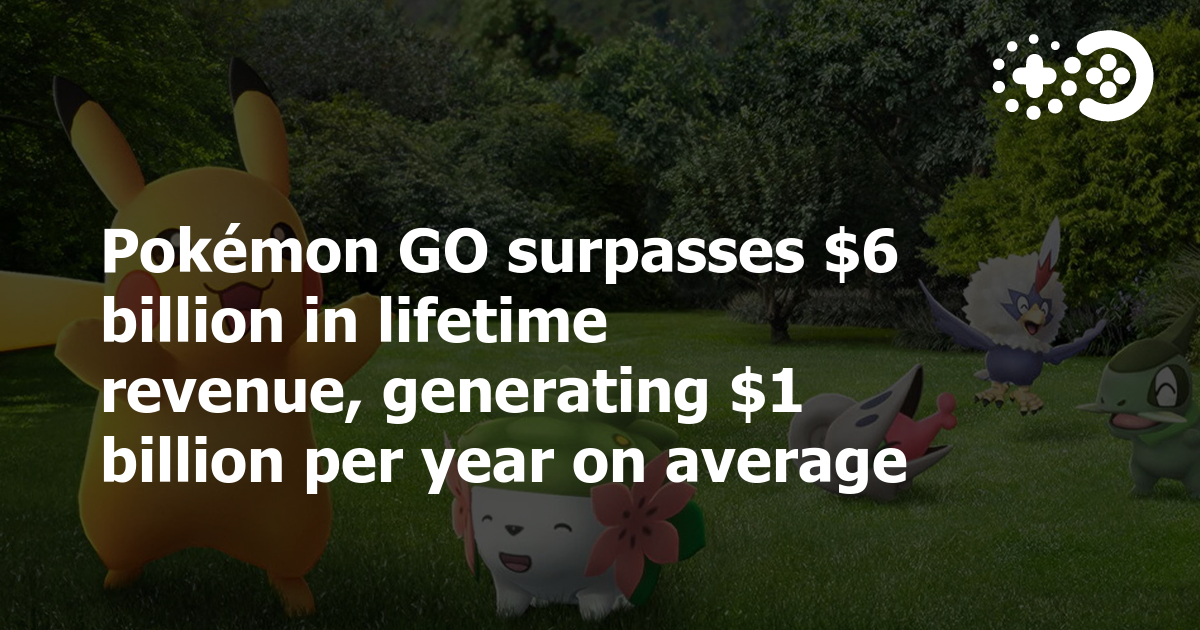
Pokémon GO Surpasses $6 Billion in Lifetime Revenue
Pokémon GO crossed $6 billion in lifetime player spending since its 2016 launch, averaging roughly $1 billion per year, and remained the highest-grossing augmented reality game worldwide in the most recent quarter.
- Scopely has acquired Niantic’s game development business for $3.5 billion, taking ownership of titles including Pokémon GO, Monster Hunter Now, and Pikmin Bloom.
- Pokémon GO has surpassed $8 billion in cumulative gross player spending since its 2016 launch, maintaining an average annual revenue of $1 billion.
- The acquired game portfolio generates over $1 billion in annual revenue and maintains a combined monthly active user base exceeding 30 million.
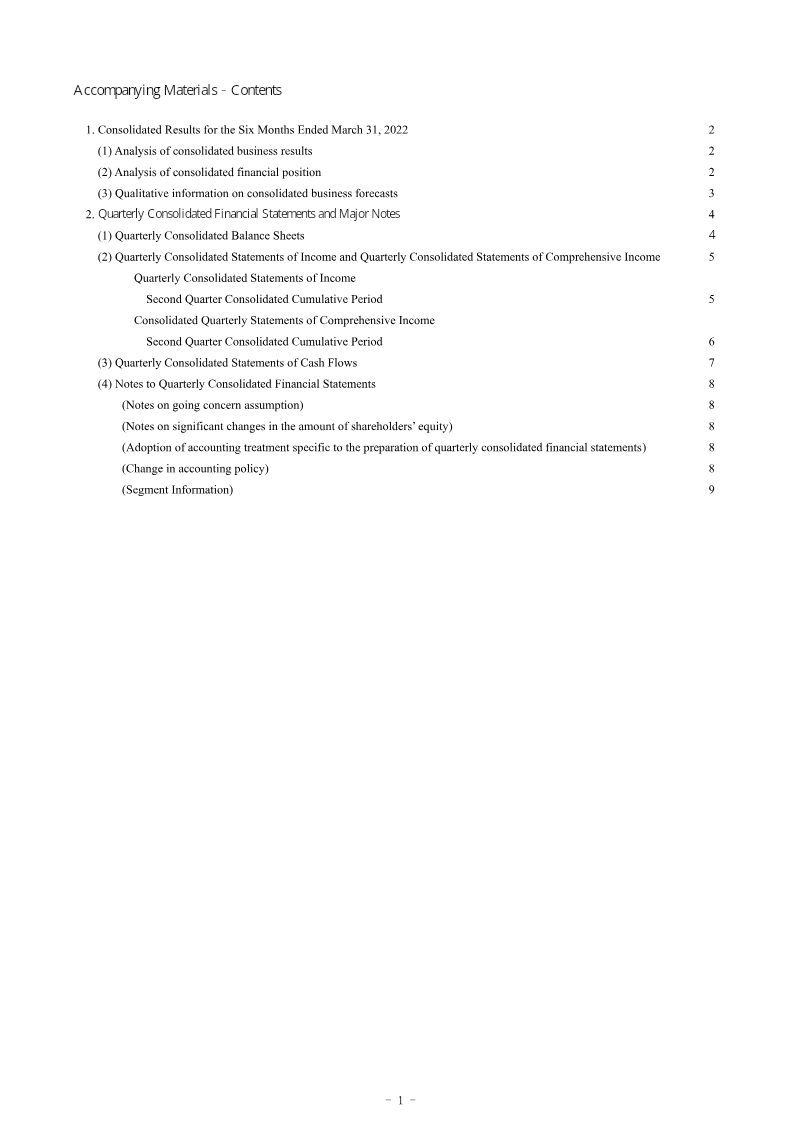
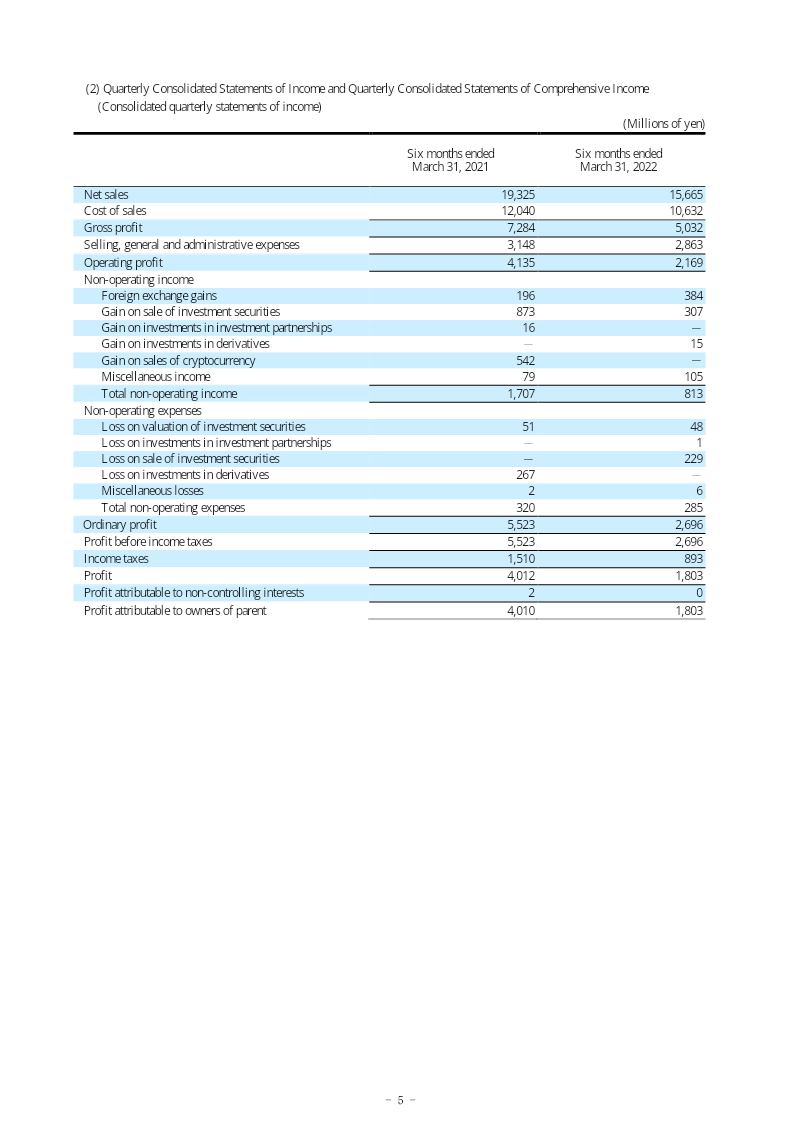
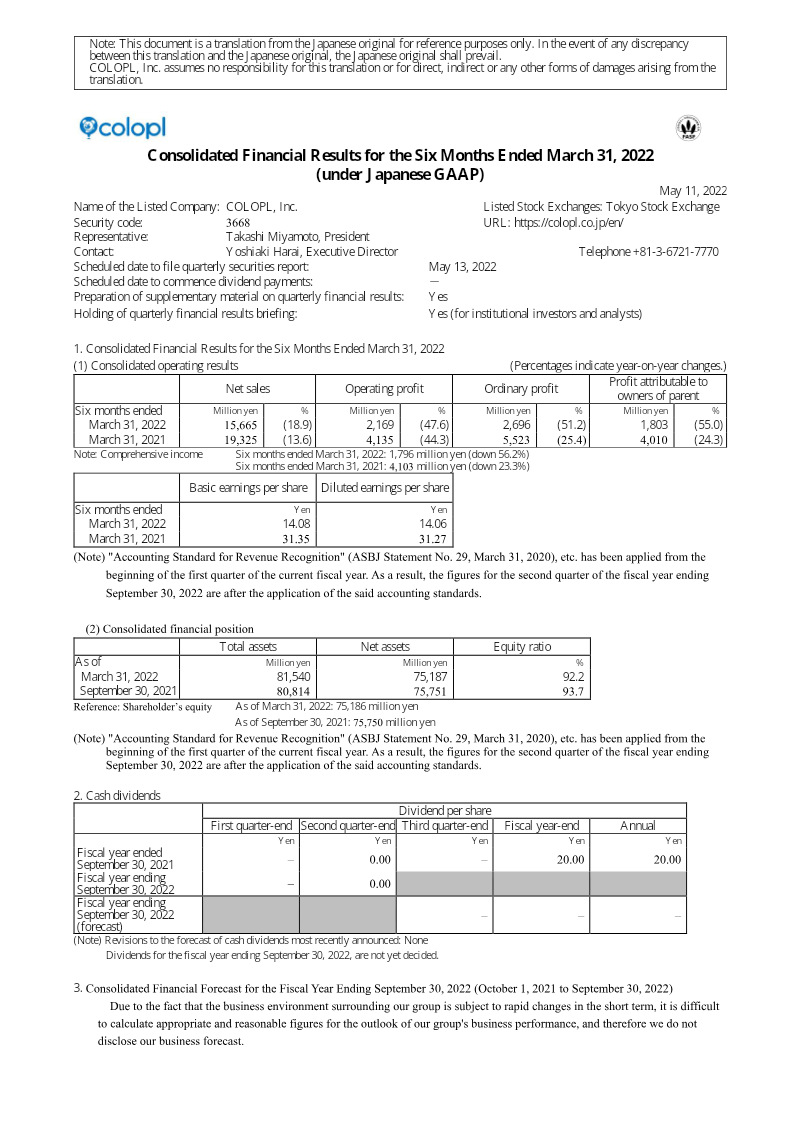
COLOPL Consolidated Financial Results for the Six Months Ended March 31, 2022
The consolidated financial results for the six months ended March 31, 2022, reflect a period of contraction for the company compared to the same period in the previous fiscal year.
- COLOPL experienced a significant downturn in the six months ending March 31, 2022, with net sales falling 18.9% year-on-year to 15,665 million yen.
- Profitability contracted sharply, as operating profit dropped 47.6% to 2,169 million yen and profit attributable to owners of the parent fell 55.0% to 1,803 million yen.
- Due to high business volatility, the company has declined to provide specific earnings forecasts for the remainder of the fiscal year ending September 30, 2022.
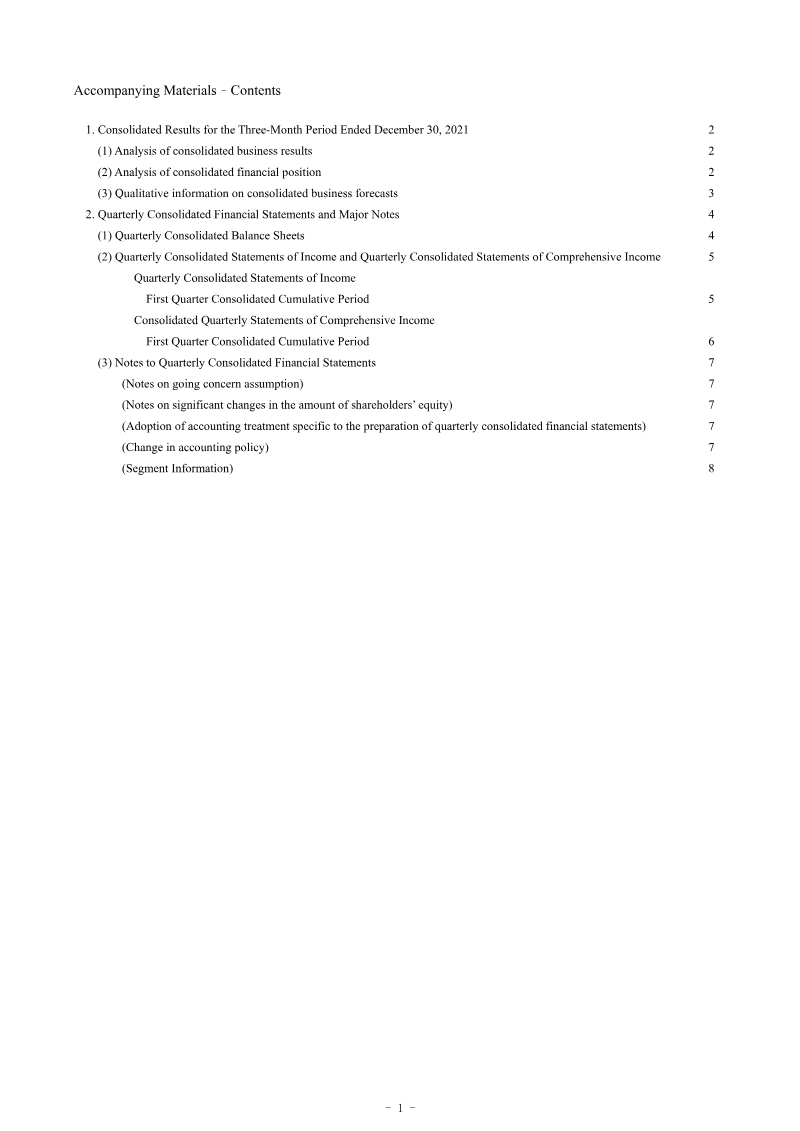
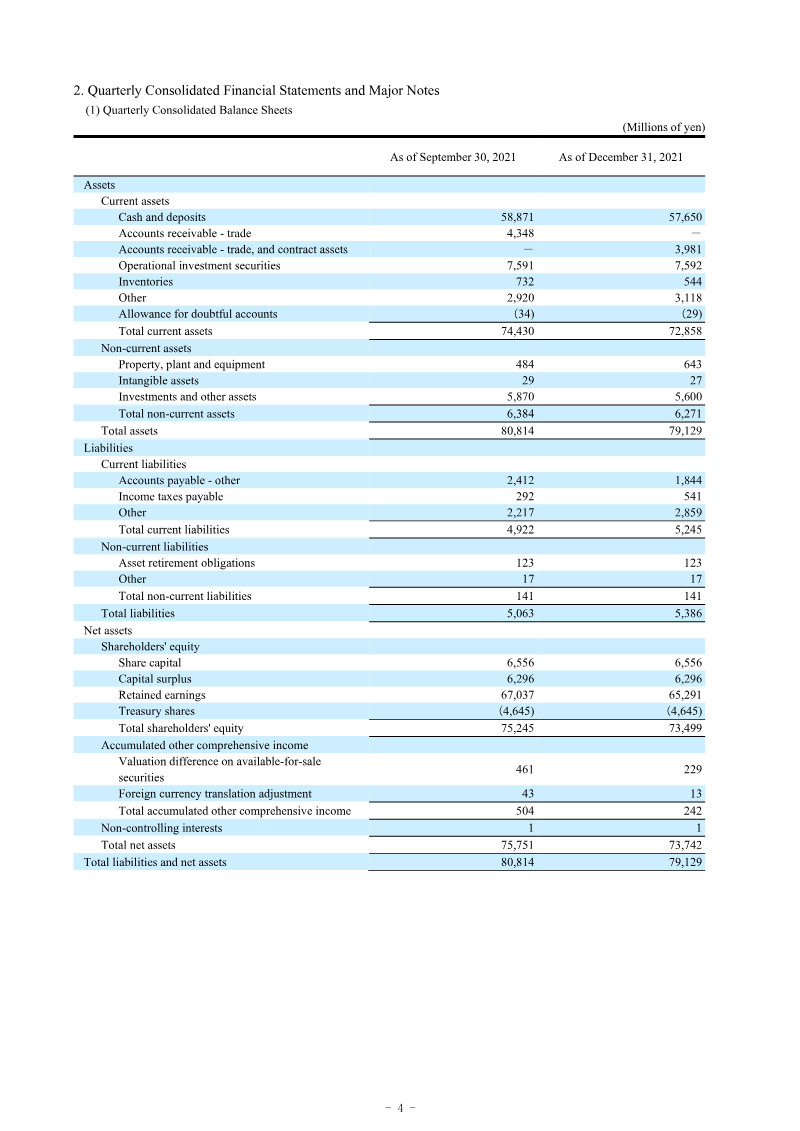
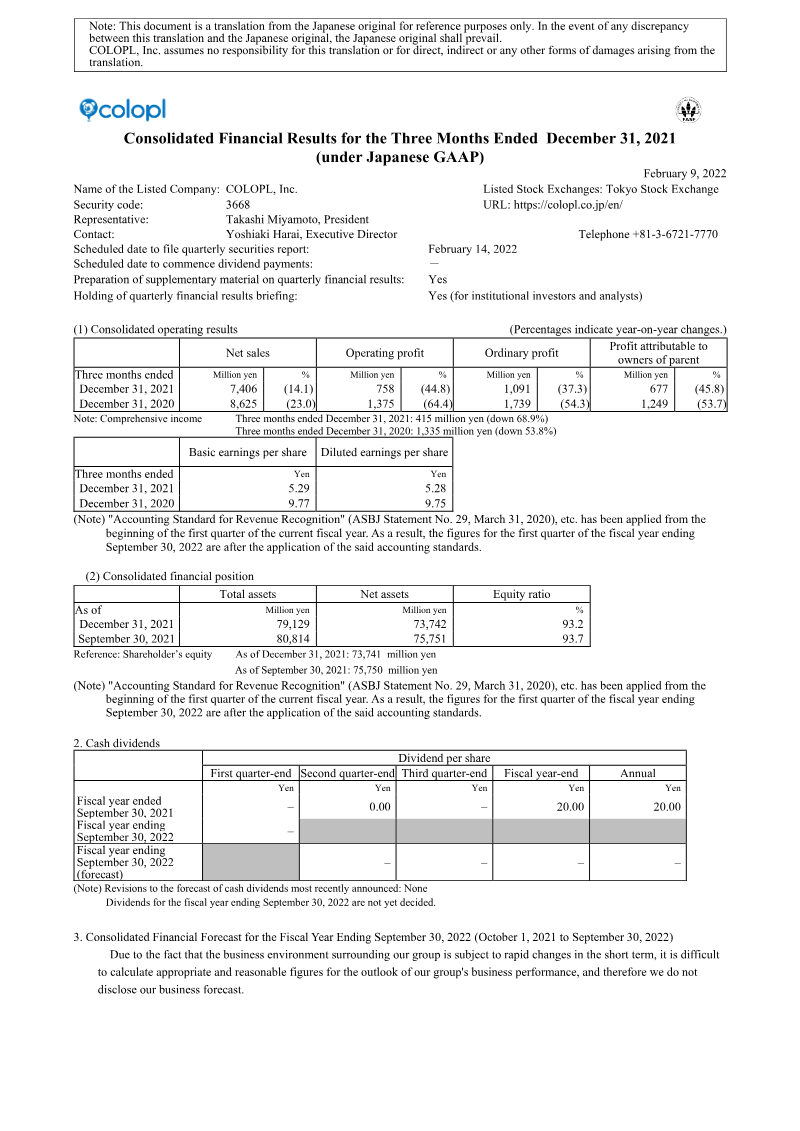
COLOPL Consolidated Financial Results for the Three Months Ended December 31, 2021
COLOPL, Inc. reported its consolidated financial results for the first quarter of the fiscal year ending September 30, 2022, covering the period from October 1, 2021, to December 31, 2021.
- COLOPL's net sales for the quarter ended December 31, 2021 fell 14.1% year-on-year to 7,406 million yen, while operating profit dropped 44.8% to 758 million yen.
- Profit attributable to owners of the parent declined 45.8% year-on-year, and ordinary profit fell 37.3%, signalling weaker profitability across the business.
- The Entertainment segment generated 7,395 million yen in sales and 798 million yen in operating profit, driven by titles such as Dragon Quest Walk, and carried the company's results.
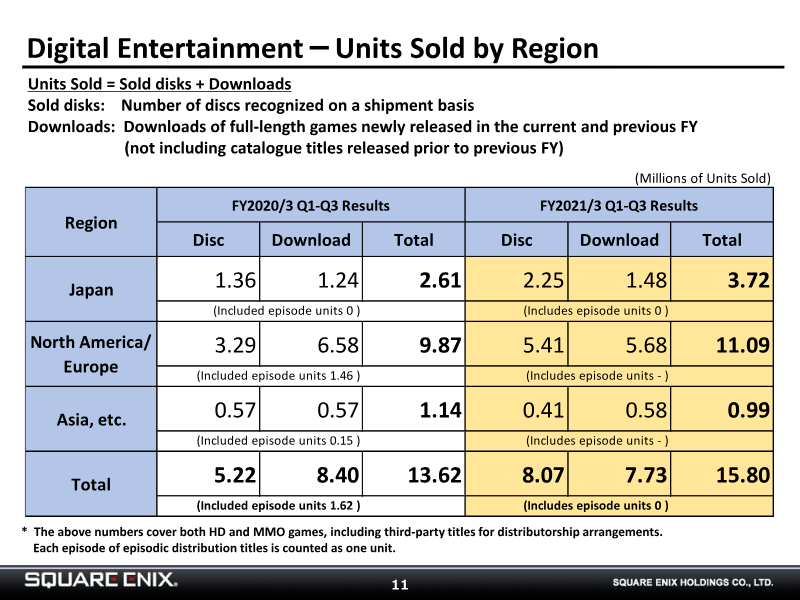

Square Enix Holdings Financial Results: Nine-Month Period Ended December 31, 2020
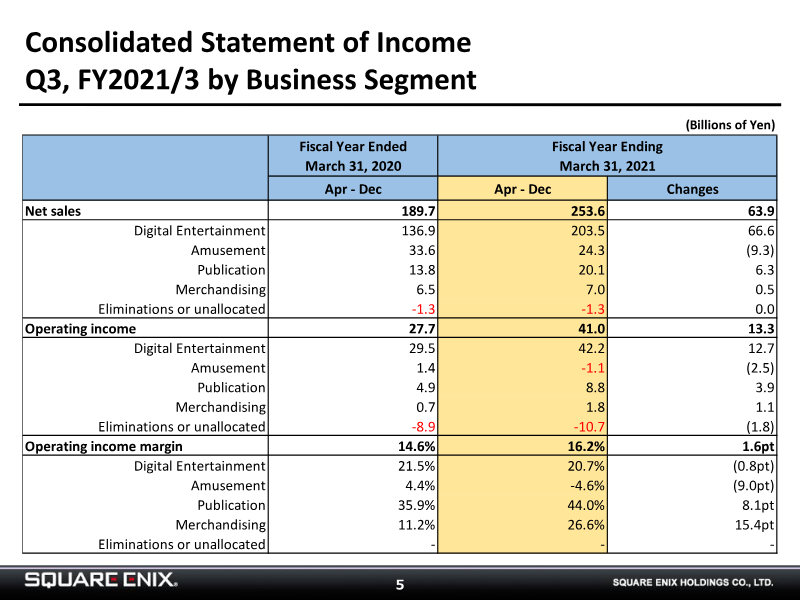
Square Enix Holdings reported strong financial growth for the nine-month period ending December 31, 2020, characterized by significant increases in net sales and operating income compared to the same period in the previous fiscal year.
- Square Enix reported a strong nine-month performance ending December 31, 2020, with net sales reaching 253.6 billion yen and operating income rising to 41.0 billion yen, a significant increase from 27.7 billion yen in the same period the previous year.
- The Digital Entertainment segment drove growth through major HD game releases like 'FINAL FANTASY VII REMAKE' and 'Marvel's Avengers,' alongside strong performance in smart device and PC browser titles such as 'DRAGON QUEST WALK' and 'DRAGON QUEST TACT.'
- The Amusement segment suffered a sharp decline, recording an operating loss due to COVID-19-related facility closures through mid-June 2020, with quarterly net sales bottoming out at 4.6 billion yen in Q1 FY2021/3.
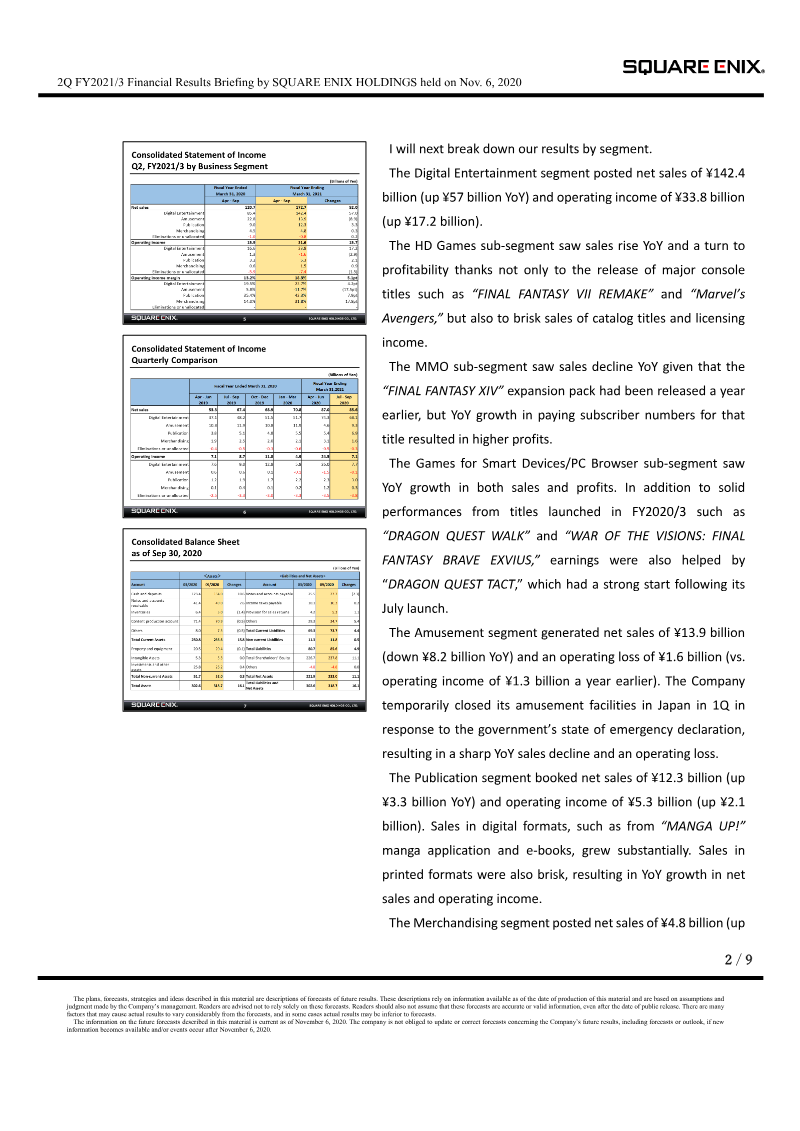
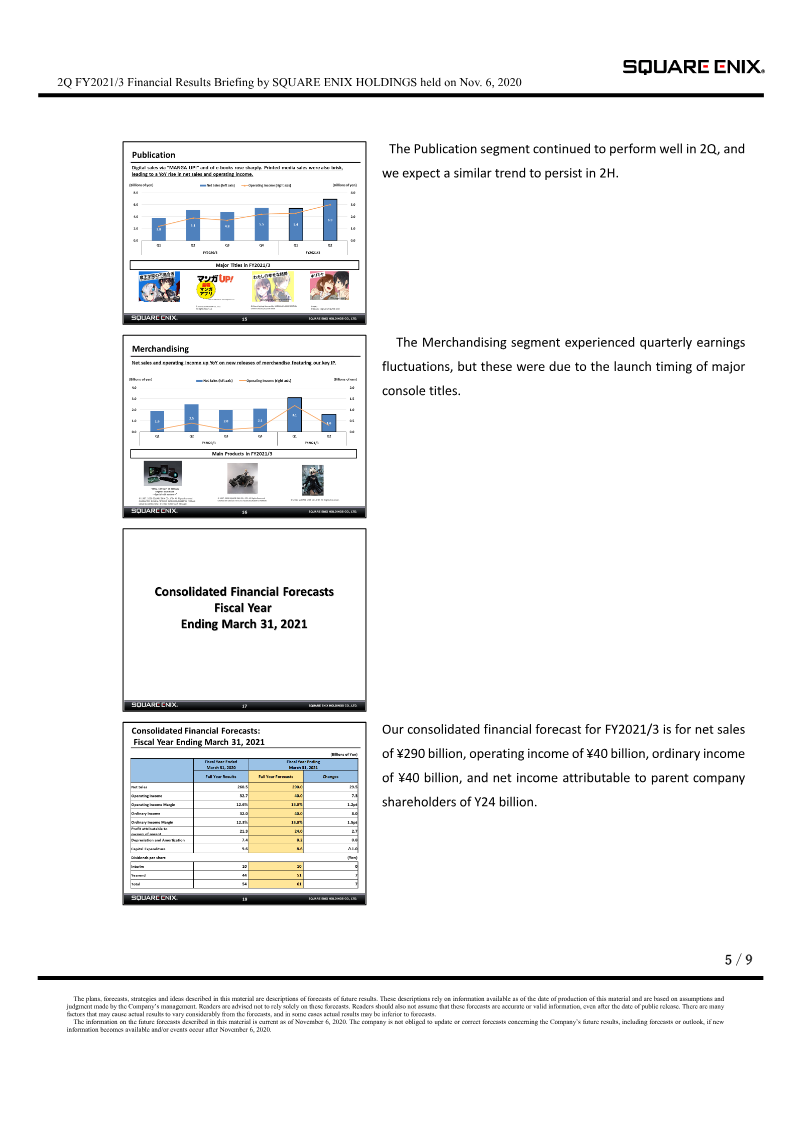
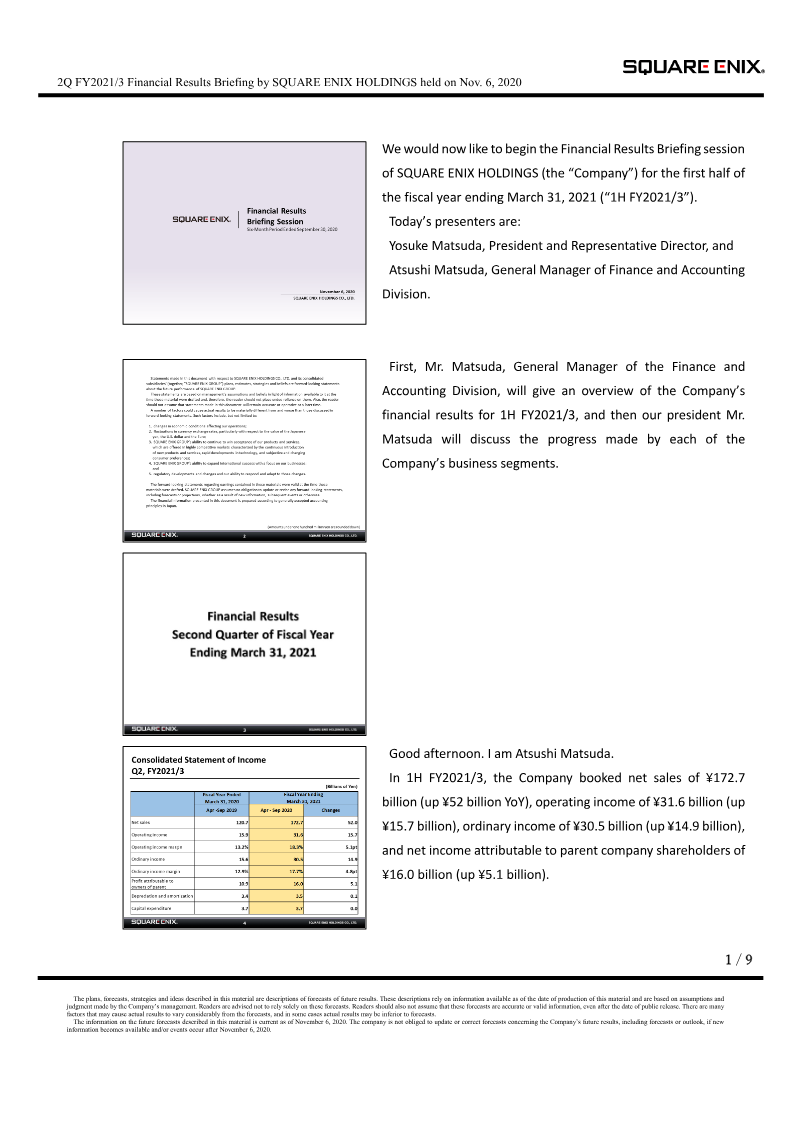
Square Enix Holdings 2Q FY2021/3 Financial Results Briefing
Square Enix Holdings reported strong financial growth for the first half of the fiscal year ending March 31, 2021, driven primarily by robust performance in its Digital Entertainment segment.
- Square Enix's first-half results for the fiscal year ending March 2021 showed net sales of ¥172.7 billion (up ¥52 billion year-over-year) and operating income of ¥31.6 billion (up ¥15.7 billion).
- The Digital Entertainment segment drove the growth with net sales of ¥142.4 billion, helped by console releases such as Final Fantasy VII Remake and mobile titles Dragon Quest Walk and Dragon Quest Tact.
- Marvel's Avengers underperformed expectations in the HD Games sub-segment, creating significant development cost amortization and marketing expenses that offset part of the gains from major releases.
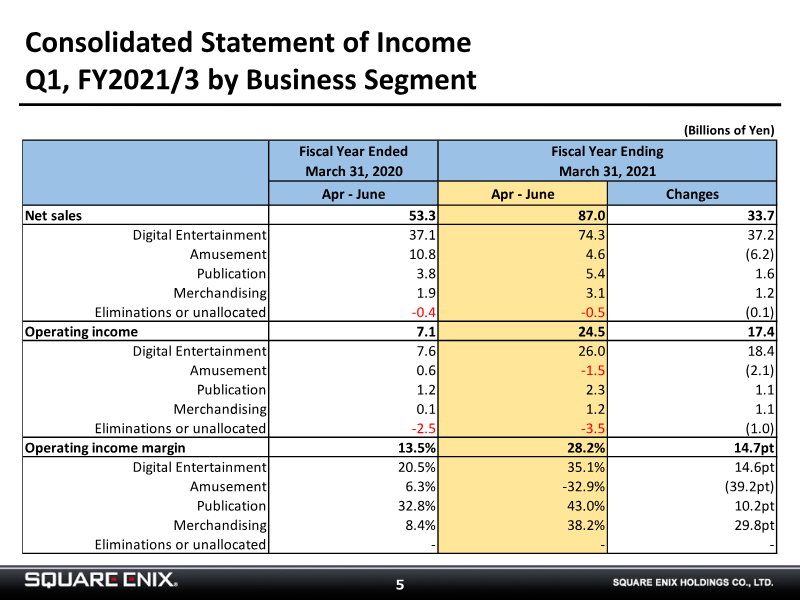

Financial Results Briefing Session: Three-Month Period Ended June 30, 2020
Square Enix Holdings reported strong financial growth for the first quarter of the fiscal year ending March 31, 2021, driven primarily by the robust performance of its Digital Entertainment segment.
- Square Enix reported a significant year-on-year increase in Q1 FY2021/3 performance, with net sales rising to 87.0 billion yen and operating income reaching 24.5 billion yen, up from 53.3 billion yen and 7.1 billion yen respectively in the same period last year.
- The Digital Entertainment segment drove the majority of growth, with operating income surging to 26.0 billion yen, fueled by strong digital sales of 'FINAL FANTASY VII REMAKE' and increased monthly subscribers for 'FINAL FANTASY XIV'.
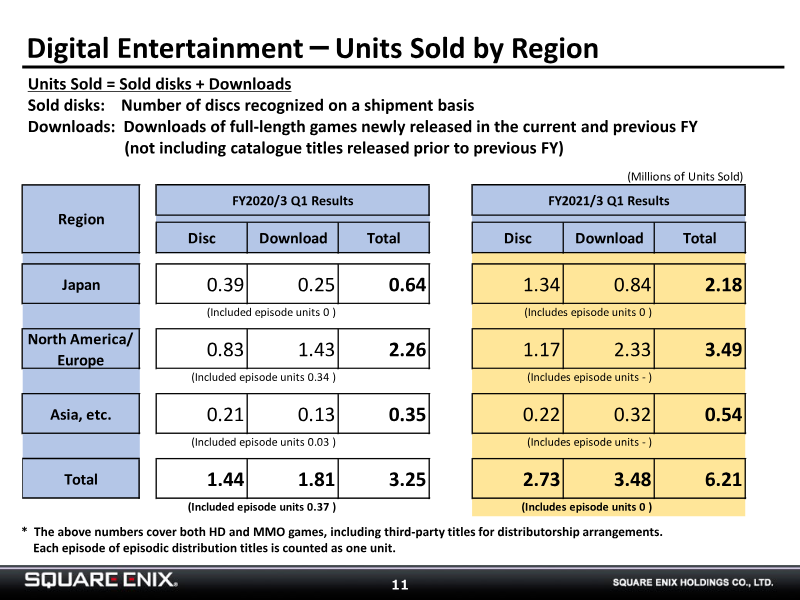
- Total game units sold (discs and downloads) nearly doubled year-on-year, growing from 3.25 million units in Q1 FY2020/3 to 6.21 million units in Q1 FY2021/3.
Square Enix Holdings Consolidated Financial Results: Three-Month Period Ended June 30, 2020
Square Enix Holdings reported strong consolidated financial results for the three-month period ending June 30, 2020, characterized by significant year-over-year growth in net sales and operating income.
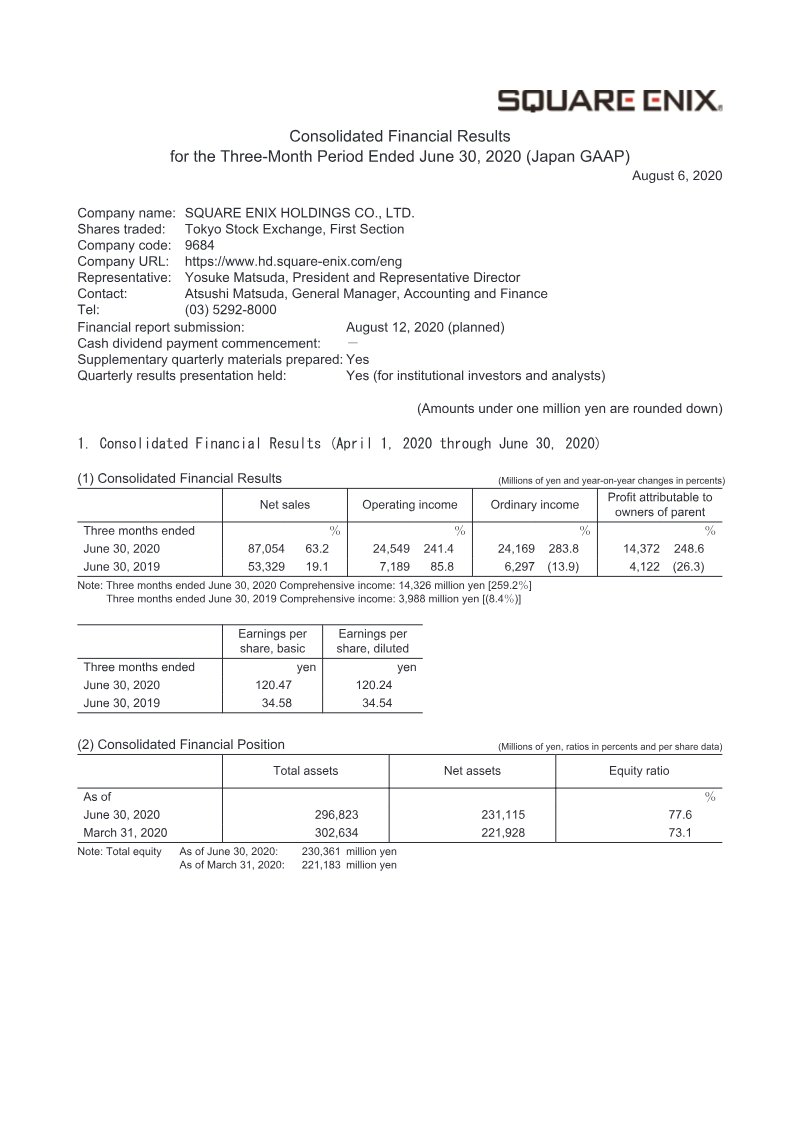
- Square Enix reported a significant surge in financial performance for the three-month period ended June 30, 2020, with net sales rising 63.2% year-on-year to ¥87,054 million and operating income jumping 241.4% to ¥24,549 million.
- The Digital Entertainment segment was the primary growth driver, achieving ¥74,363 million in net sales (up 100.1%) and ¥26,069 million in operating income (up 242.0%) due to strong digital sales and the performance of titles like 'FINAL FANTASY XIV', 'DRAGON QUEST WALK', and 'TRIALS OF MANA'.
- Profit attributable to owners of the parent reached ¥14,372 million, a 248.6% increase compared to the same period in 2019, despite an extraordinary loss of ¥2,226 million related to COVID-19-driven arcade closures.
Pokémon GO Surpasses $3.6 Billion in Lifetime Revenue
Pokémon GO has surpassed $3.6 billion in lifetime global player spending as of its fourth launch anniversary on July 6, 2020, according to Sensor Tower Store Intelligence estimates.
- Pokémon GO has surpassed $3.6 billion in lifetime global player spending four years after its July 2016 launch.
- The game generated $905 million in 2019, marking its most successful year to date and surpassing the $832.5 million earned during its 2016 launch window.
- H1 2020 revenue reached $445.3 million, putting the title on track to match or exceed its 2019 record despite global pandemic-related lockdowns.

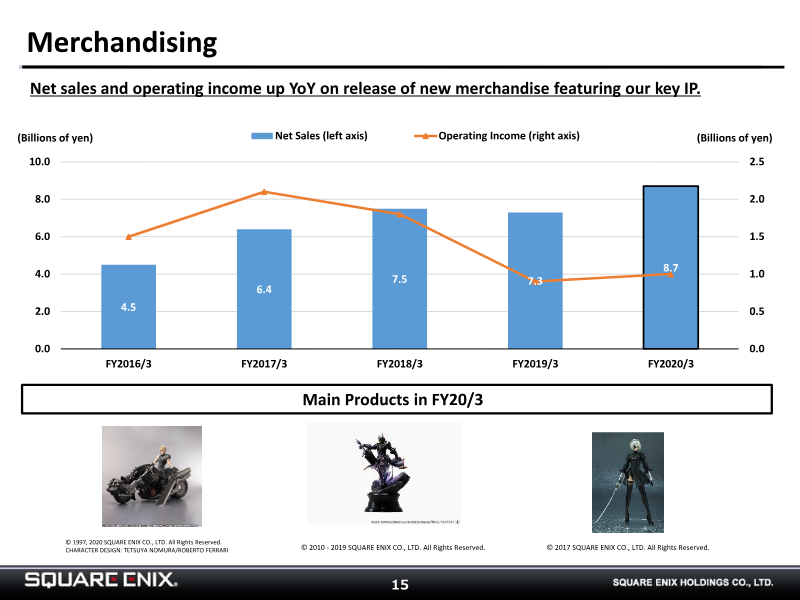

Financial Results Briefing Session: Fiscal Year Ended March 31, 2020
The financial results for the fiscal year ended March 31, 2020, reflect a period of strategic transition for Square Enix Holdings Co., Ltd.
- Square Enix reported a net sales decline of 10.7 billion yen to 260.5 billion yen for the fiscal year ended March 31, 2020, though operating income increased by 8.1 billion yen to 32.7 billion yen.
- The Digital Entertainment segment, the company's largest, saw operating income rise to 35.3 billion yen (up 6.4 billion yen) despite a net sales decrease, driven by strong performance in MMOs and mobile/PC browser games.
- The Games for Smart Devices/PC Browser category reached 106.4 billion yen in net sales, fueled by the successful launches of 'Romancing SaGa Re;univerSe' and 'DRAGON QUEST WALK'.
Square Enix Holdings 3Q FY2020/3 Financial Results Briefing
Square Enix Holdings reported strong financial growth for the first three quarters of the fiscal year ending March 31, 2020.
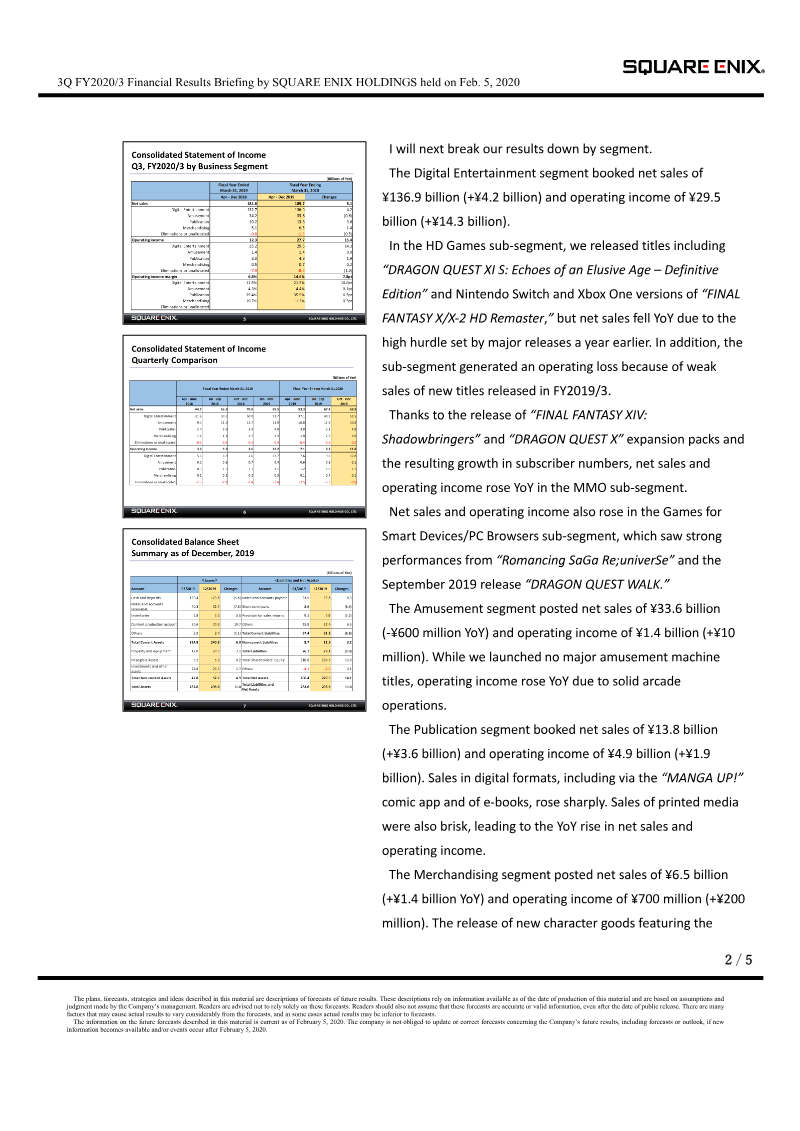
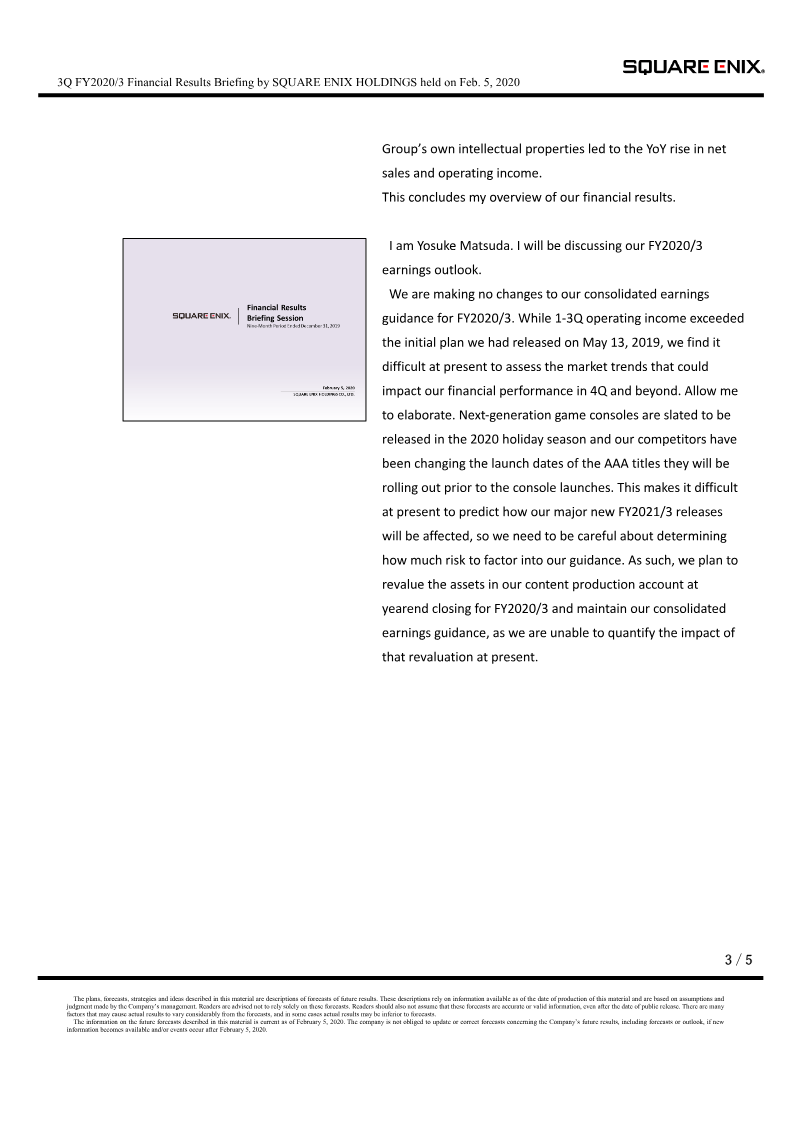
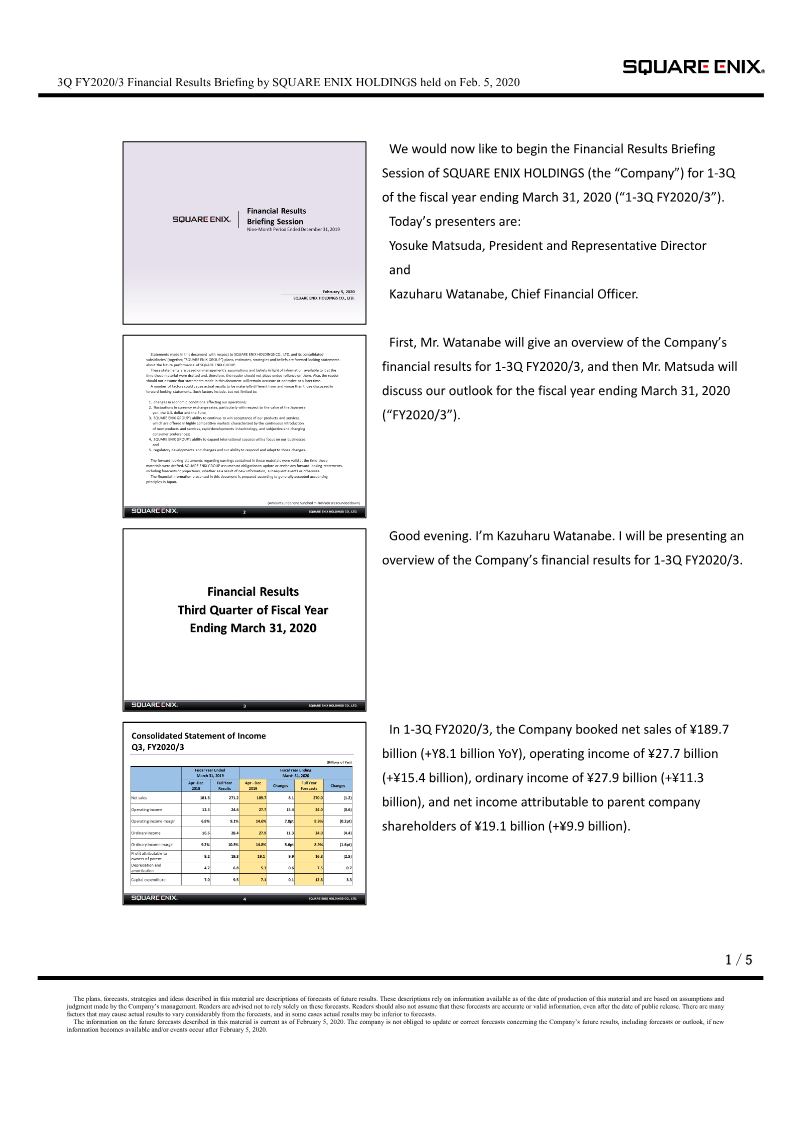
- Square Enix reported net sales of ¥189.7 billion and operating income of ¥27.7 billion for the first three quarters of FY2020/3, marking a year-over-year operating income increase of ¥15.4 billion.
- The Digital Entertainment segment served as the primary growth driver, generating ¥29.5 billion in operating income through strong performance in MMOs and smart device titles.
- MMO revenue was bolstered by the release of expansion packs for Final Fantasy XIV and Dragon Quest X, while smart device growth was driven by Romancing SaGa Re;univerSe and Dragon Quest Walk.
Companies behind it



As the documents state it.