2015
Company
Documents about 2015
Kadokawa Dwango Financial Results for the Fiscal Year Ended March 31, 2015
Kadokawa Dwango’s financial results for the fiscal year ended March 31, 2015, reflect a diversified media conglomerate navigating a period of structural transition.
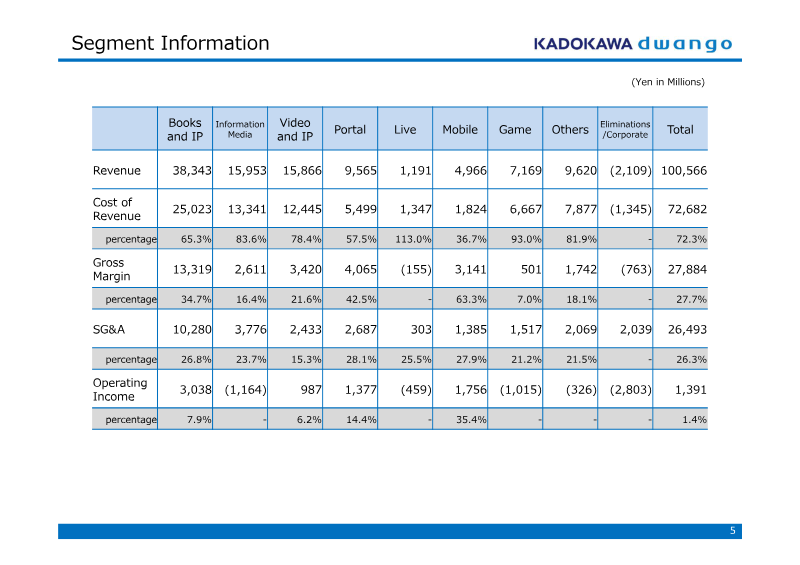
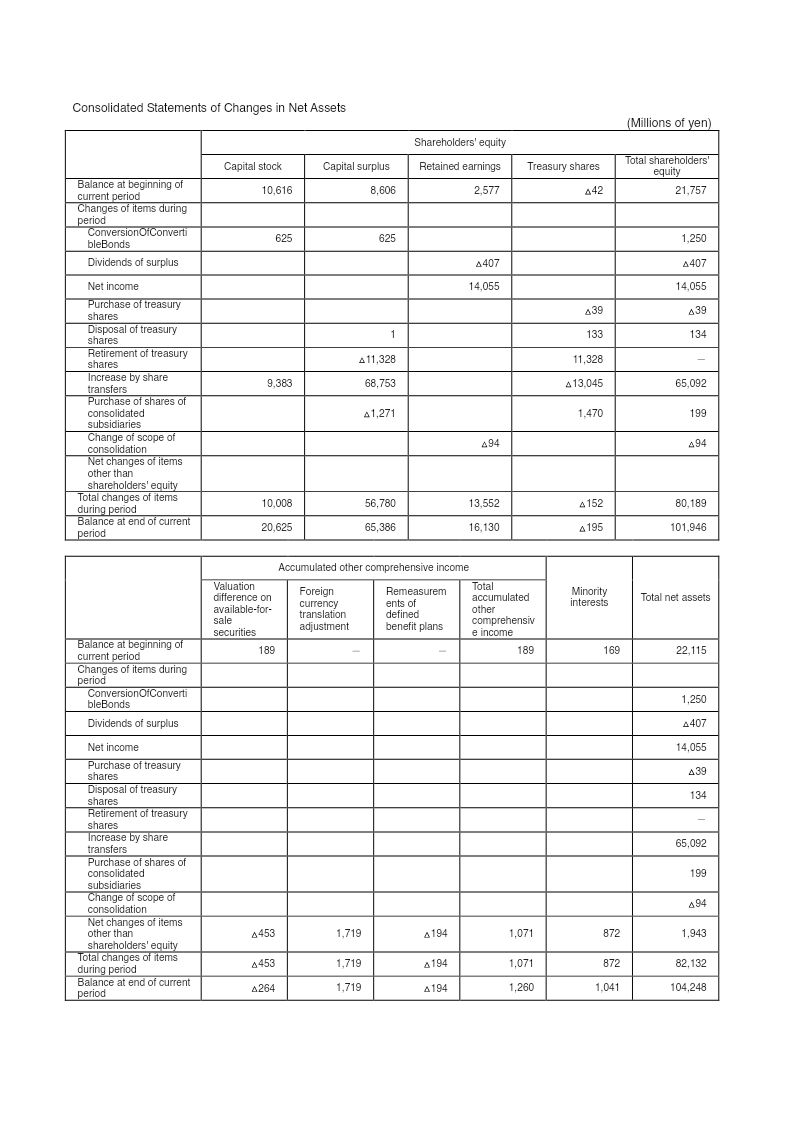
- Kadokawa Dwango reported 100.57 billion yen in revenue for the six months ended March 31, 2015, with an operating income of 1.39 billion yen.
- Net income for the period was 14.06 billion yen, significantly impacted by 22.3 billion yen in negative goodwill offset by 11.5 billion yen in extraordinary losses.
- The Books and IP business was the primary revenue driver at 38.34 billion yen, bolstered by strong e-book performance and successful cost-control measures implemented in October 2014.
Kadokawa Dwango Corporation FY2015 Consolidated Financial Results
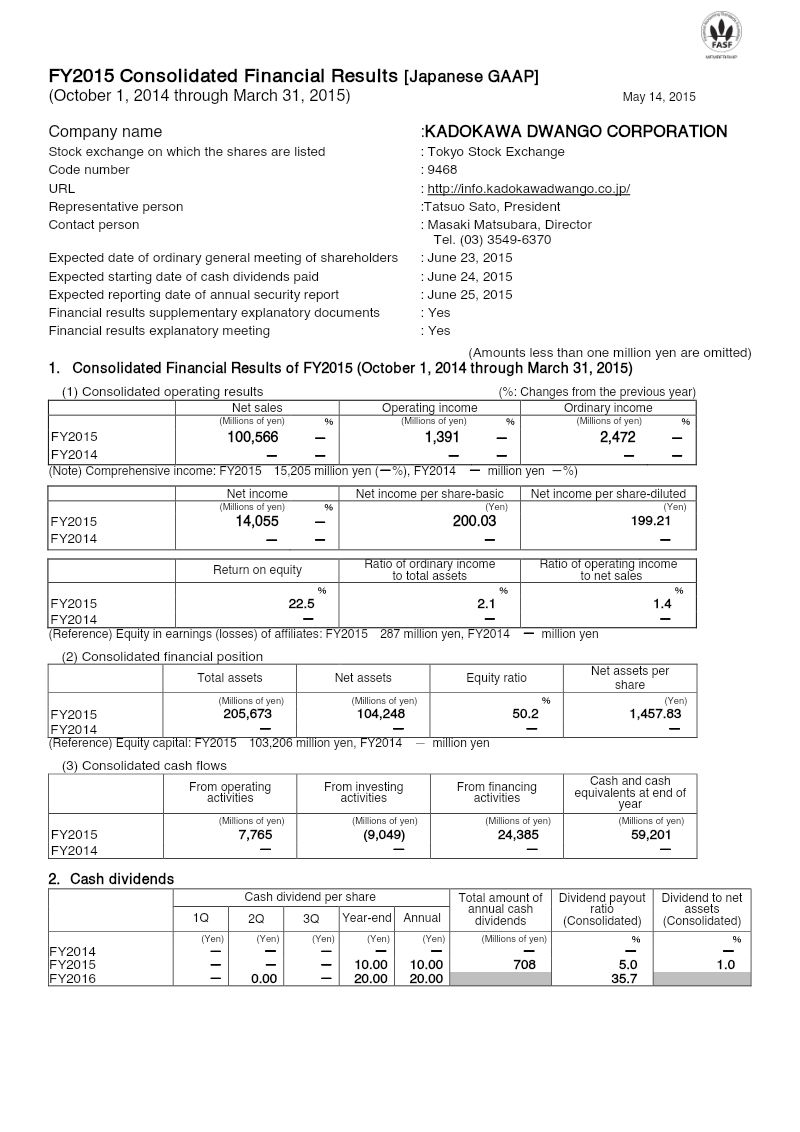
The Kadokawa Dwango Corporation FY2015 consolidated financial results cover the six-month period from October 1, 2014, to March 31, 2015.
- Kadokawa Dwango Corporation reported net sales of 100,566 million yen and an operating income of 1,391 million yen for the six-month period ending March 31, 2015.
- Net income reached 14,055 million yen, heavily influenced by a 22,301 million yen gain on bargain purchase that offset 5,798 million yen in impairment losses and 5,118 million yen in restructuring costs.
- The Books and Information segment was the top performer, contributing 37,544 million yen in sales and 3,038 million yen in segment income.



First Quarterly Report 2015
IGG Inc. demonstrated resilient year-over-year growth during the first quarter of 2015, characterized by a 21.5% revenue increase to US$53.6 million and a 2.9% rise in profit to US$14.0 million.
- IGG Inc. reported Q1 2015 revenue of US$53.6 million, a 21.5% year-over-year increase, though revenue declined 11.4% sequentially compared to Q4 2014.
- Mobile titles accounted for 92.9% of total revenue, with the game Castle Clash serving as the primary driver of financial performance.
- Net profit rose 2.9% year-over-year to US$14.0 million, while the gross profit margin contracted to 68.8% due to rising mobile distribution channel costs.

KLab Q1 2015 Financial Results
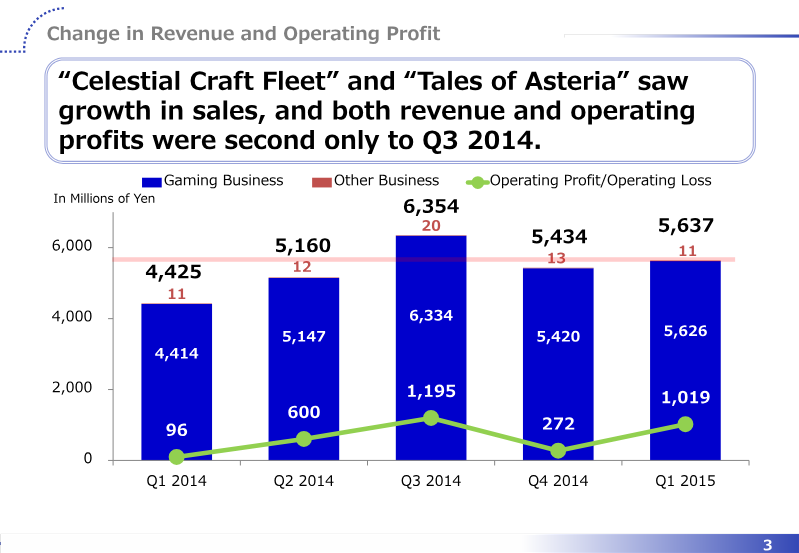
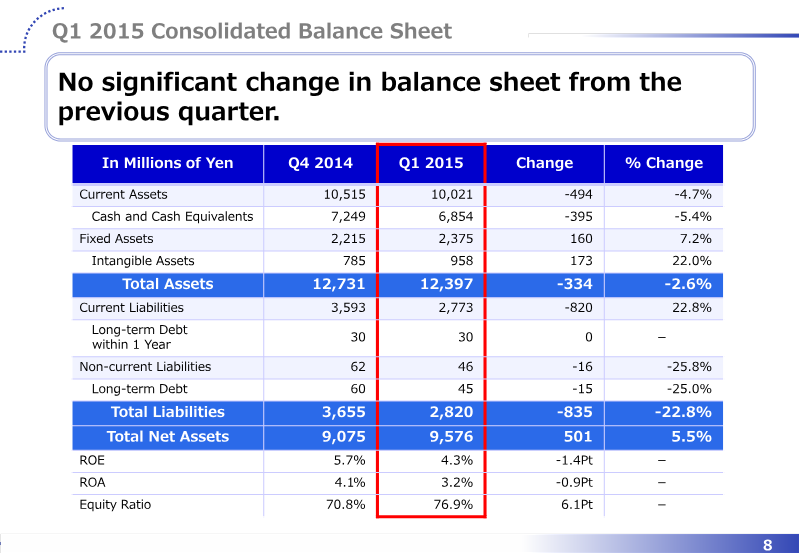
KLab’s financial results for the first quarter of 2015 demonstrate significant growth in profitability compared to the previous year, driven by the strong performance of key gaming titles.
- KLab reported Q1 2015 revenue of 5,637 million yen, a 27.4% year-over-year increase, and an operating profit of 1,019 million yen, marking a 961.5% surge compared to Q1 2014.
- The company forecasts a Q2 2015 contraction of 20% in revenue and a 60% decline in operating profit due to lower ARPU for 'Love Live! School Idol Festival' and the release delay of 'Bleach: Brave Souls'.
- Operating margins improved significantly following a 36.8% reduction in selling, general, and administrative expenses compared to Q4 2014, driven by a strategic shift away from expensive television advertising.


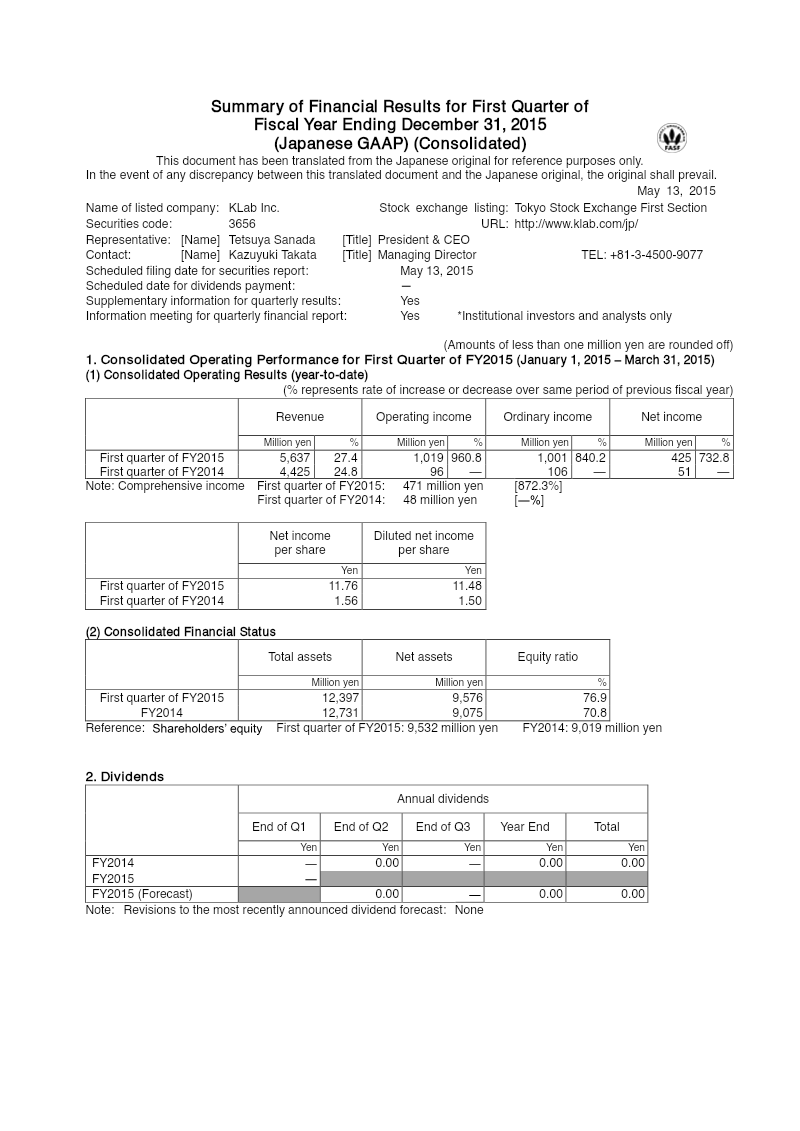
Summary of Financial Results for First Quarter: Fiscal Year Ending December 31, 2015
KLab Inc. reported first-quarter fiscal 2015 results that marked a dramatic turnaround from the same period in FY2014.
- KLab Inc. achieved a major financial turnaround in Q1 2015, with operating income surging 960.8% to ¥1,019 million and net income rising 732.8% to ¥426 million.
- Consolidated revenue for the first quarter grew 27.4% year-over-year to ¥5,637 million, primarily fueled by the strong performance of titles 'Celestial Craft Fleet' and 'Tales of Asteria'.
- Comprehensive income for the quarter reached ¥471 million, representing an 872% increase compared to the same period in fiscal year 2014.

Ubisoft FY15 Earnings Presentation
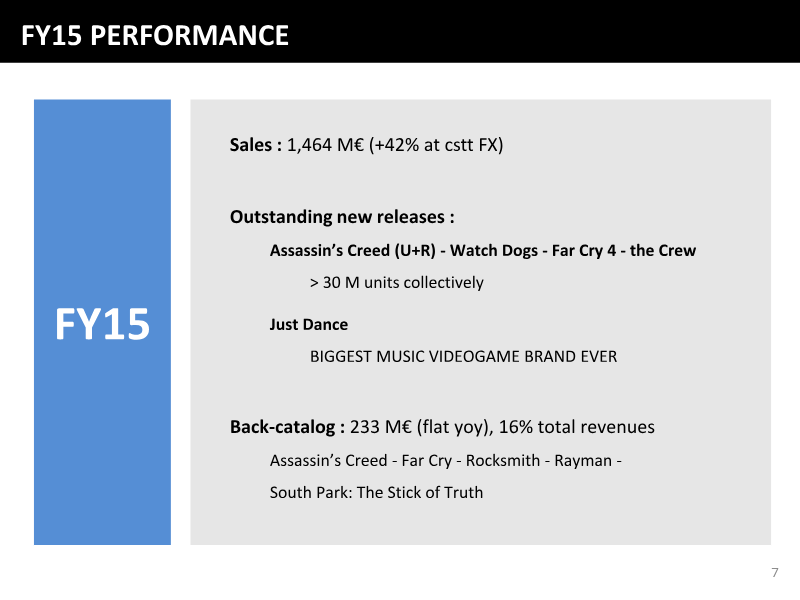
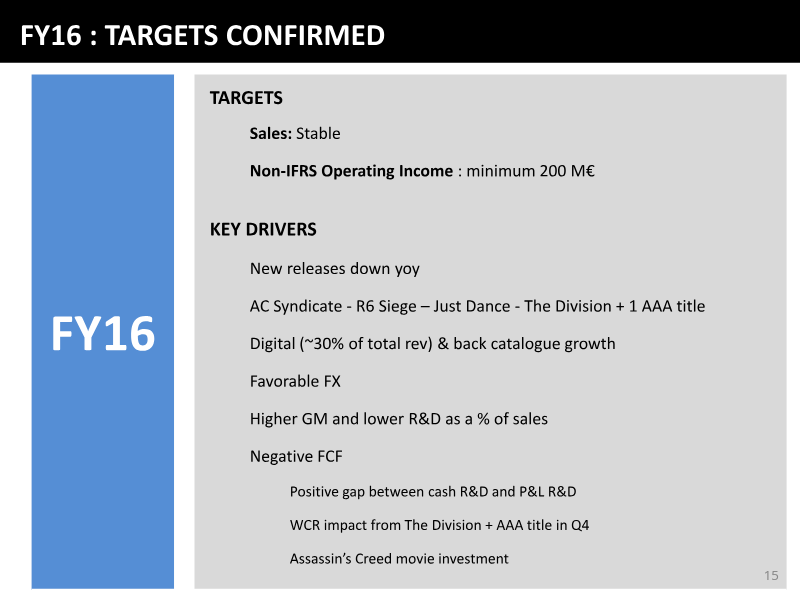
The Ubisoft Fiscal Year 2015 earnings presentation outlines a period of significant financial recovery and operational growth, driven by the successful execution of a strategy centered on systemic open-world games, digital expansion, and community engagement.
- Ubisoft's FY15 annual sales reached 1,464 million euros, a 42% increase at constant exchange rates, driven by new releases including Assassin's Creed, Watch Dogs, Far Cry 4, and The Crew, which together sold over 30 million units.
- The company posted a record gross margin of 77% and a non-IFRS operating profit of 171 million euros, beating its initial target of 165 million euros.
- Digital revenue rose 97% to 383 million euros, making up 26% of total sales and emerging as a critical growth engine.
Financial Results: Fiscal Year Ended March 31, 2015
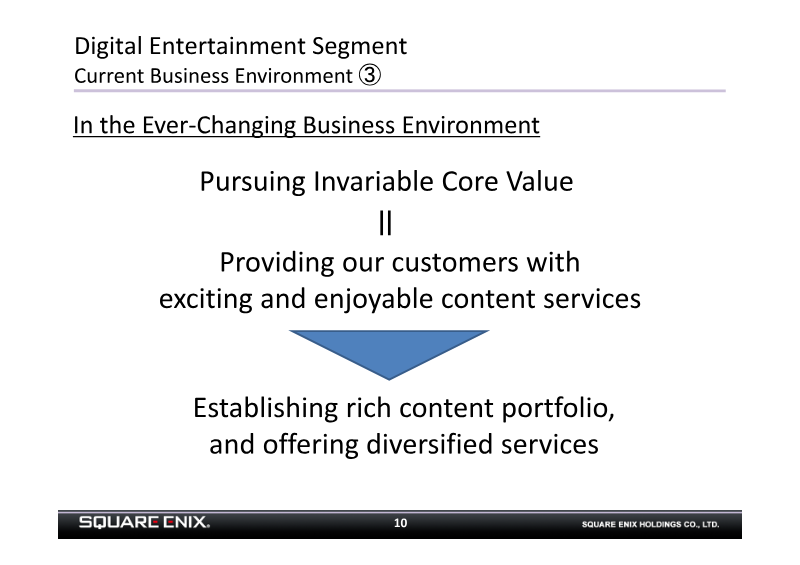
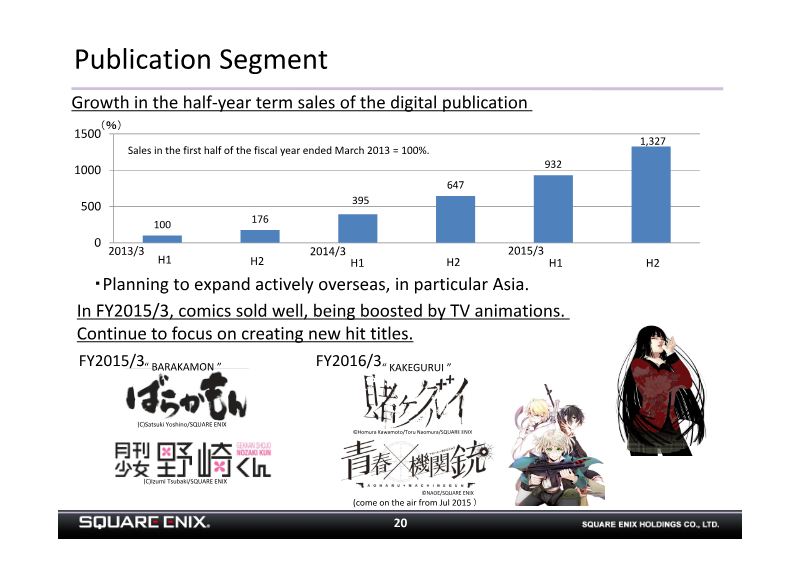
The financial results for Square Enix Holdings for the fiscal year ended March 31, 2015, demonstrate a period of significant growth and operational recovery.
- Square Enix reported strong fiscal growth for the year ending March 31, 2015, with net sales rising 8.3% to 167.9 billion yen and operating income increasing 55.8% to 16.4 billion yen.
- The Digital Entertainment segment served as the primary revenue driver, generating 111.9 billion yen in sales and 17.3 billion yen in operating income.
- Performance was bolstered by the stable revenue streams of MMO titles, specifically Final Fantasy XIV and Dragon Quest X, alongside growth in the smart device market.
Sega Sammy FY Ended March 2015 Full Year Results Presentation
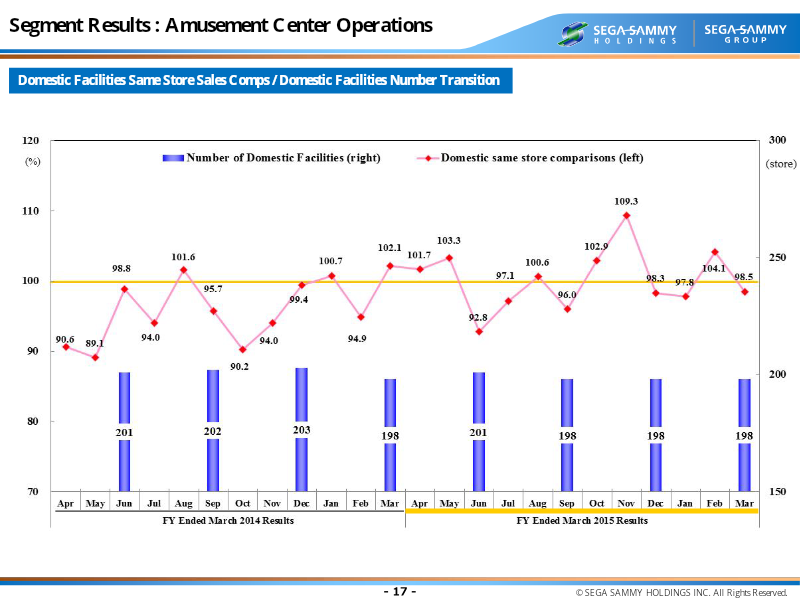
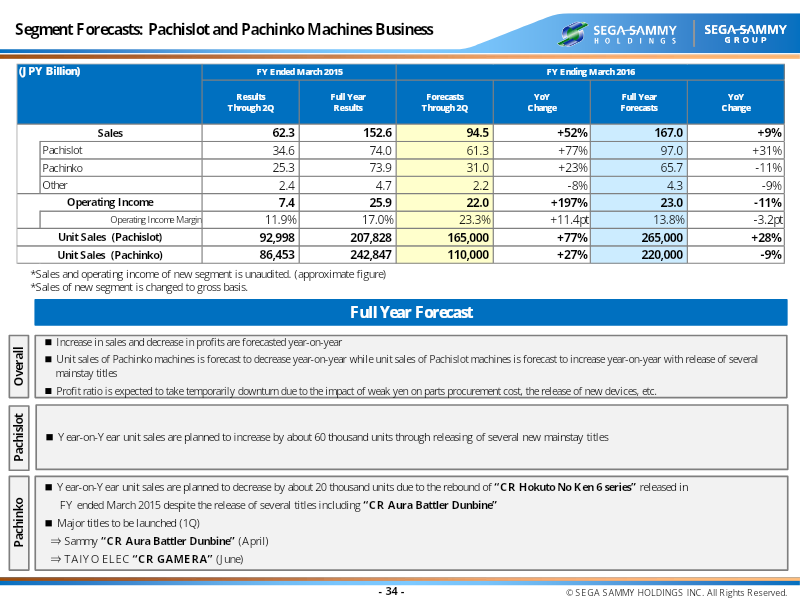
Sega Sammy experienced a challenging fiscal year ending in March 2015, characterized by a year-on-year decline in both sales and profits.
- Sega Sammy reported a year-on-year decline in sales and profits for the fiscal year ending March 2015, driven primarily by a significant contraction in pachislot machine unit sales.
- The company recorded a net loss due to substantial extraordinary costs incurred from group-wide structural reforms, including business unit consolidation and cost-reduction measures.
- Structural reforms are projected to reduce fixed expenses by 6 billion yen in the following fiscal year.
Ubisoft Full-Year 2014-15 Sales and Earnings Figures
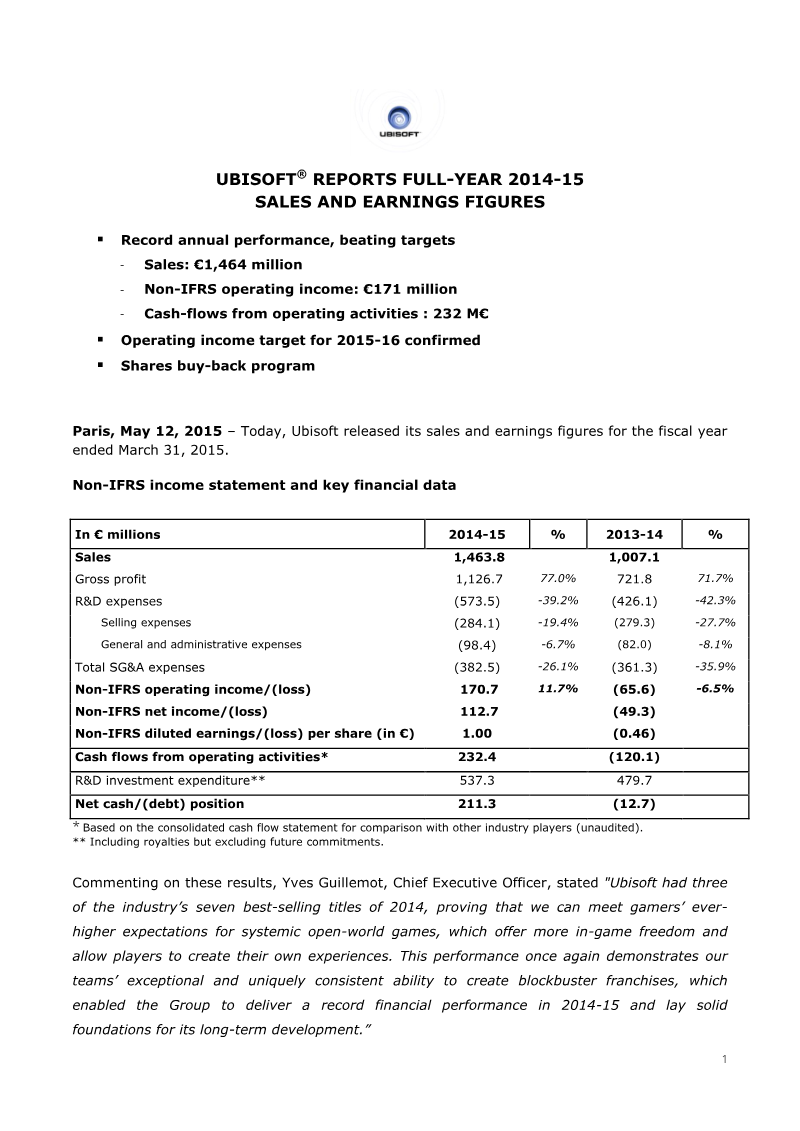
Ubisoft achieved record financial performance for the 2014-15 fiscal year, ending March 31, 2015, with total sales reaching €1,463.8 million. This represents a 45.3% increase compared to the previous fiscal year.
- Ubisoft achieved record financial performance in fiscal year 2014-15 with sales of €1,463.8 million, a 45.3% increase over the previous year.
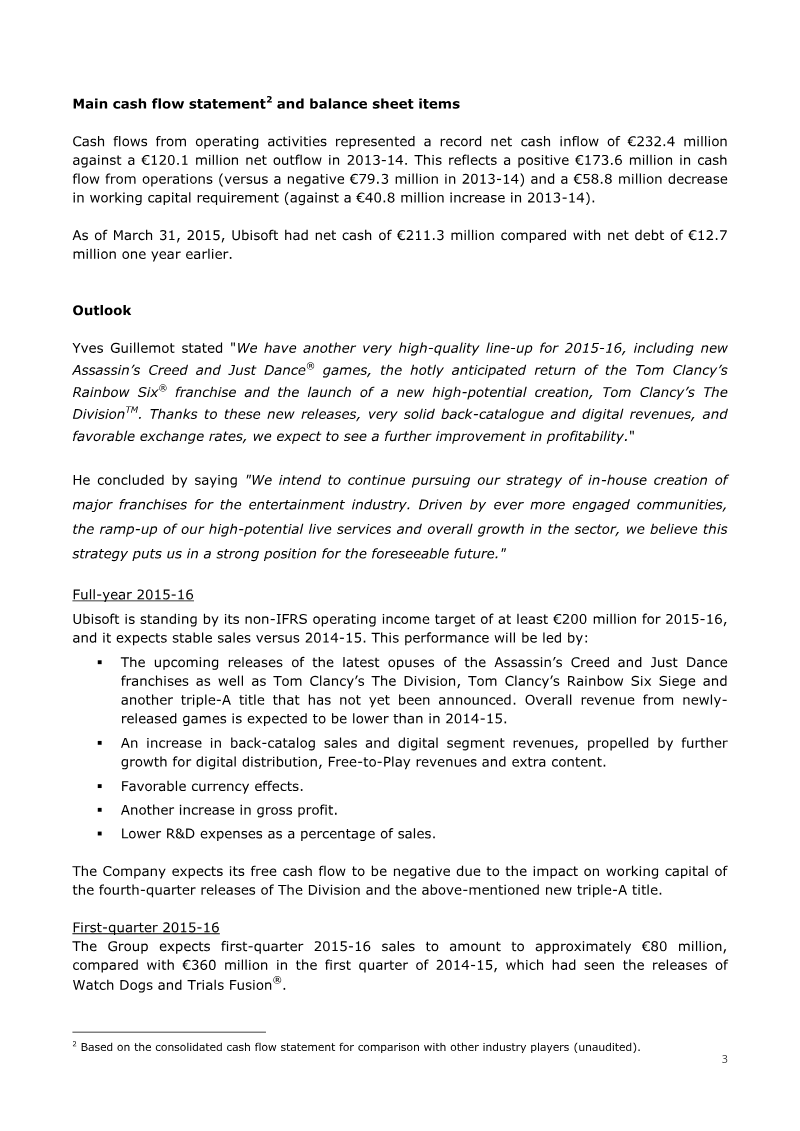
- The company shifted from a non-IFRS operating loss of €65.6 million in 2013-14 to a record non-IFRS operating income of €170.7 million.
- Digital revenue surged 96.8% to €382.7 million, representing 26.1% of total sales and contributing to a record 77.0% gross profit margin.

DeNA Consolidated Financial Results for the Fiscal Year Ended March 31, 2015
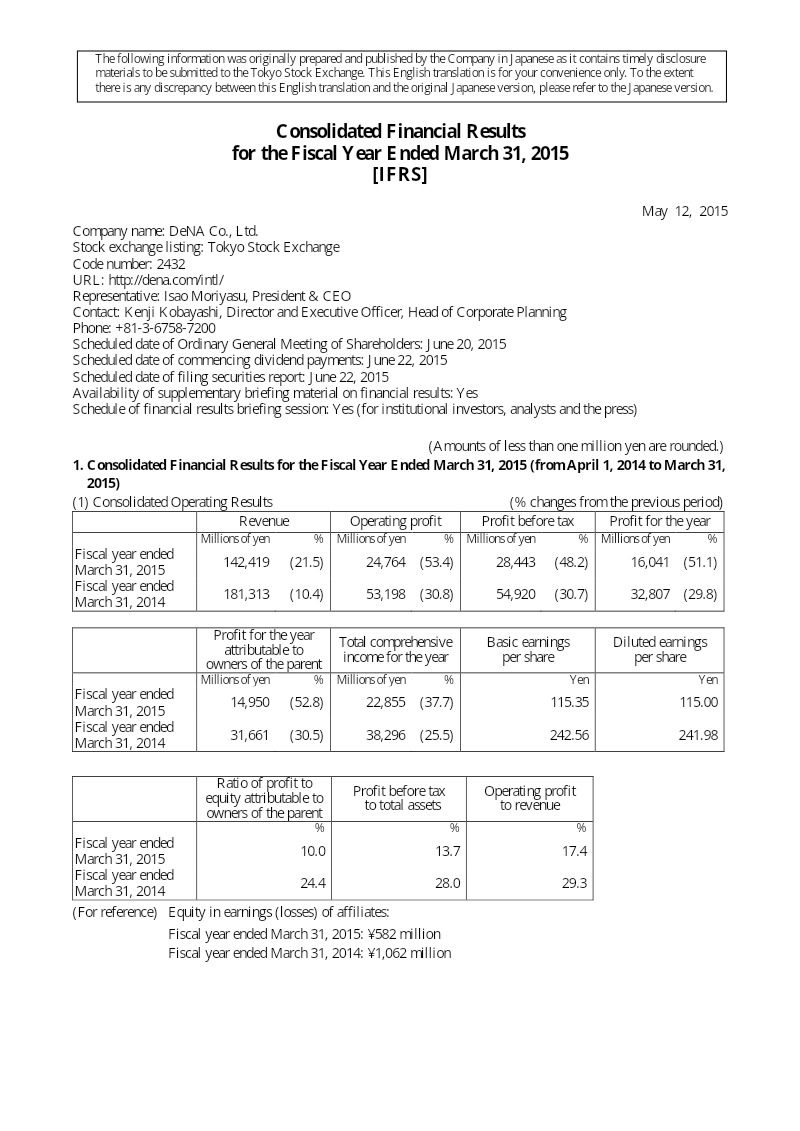
DeNA experienced a period of significant financial contraction during the fiscal year ended March 31, 2015, as the company navigated a challenging transition in its core business segments.
- DeNA reported a significant financial downturn for the fiscal year ended March 31, 2015, with total revenue falling 21.5% to 142.4 billion yen and operating profit dropping 53.4% to 24.8 billion yen.
- The company’s primary revenue decline was driven by a 25.9% decrease in its social media business, caused by the waning performance of legacy game titles.
- In March 2015, DeNA finalized a strategic capital and business alliance with Nintendo involving a reciprocal exchange of treasury stock valued at approximately 22 billion yen.
DeNA Q4 FY2014 Earnings Results Briefing: Q&A Summary
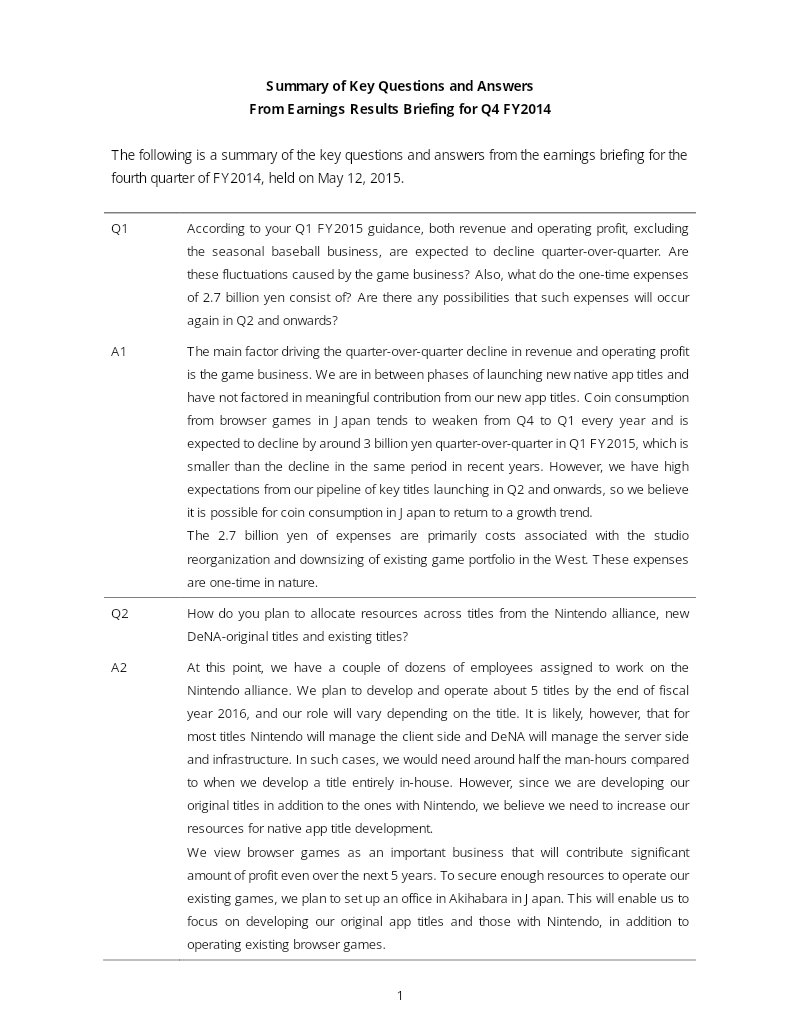
The fiscal year 2014 fourth-quarter earnings briefing for DeNA outlines a strategic transition period characterized by a temporary decline in revenue and operating profit as the company shifts its focus toward new native app development.
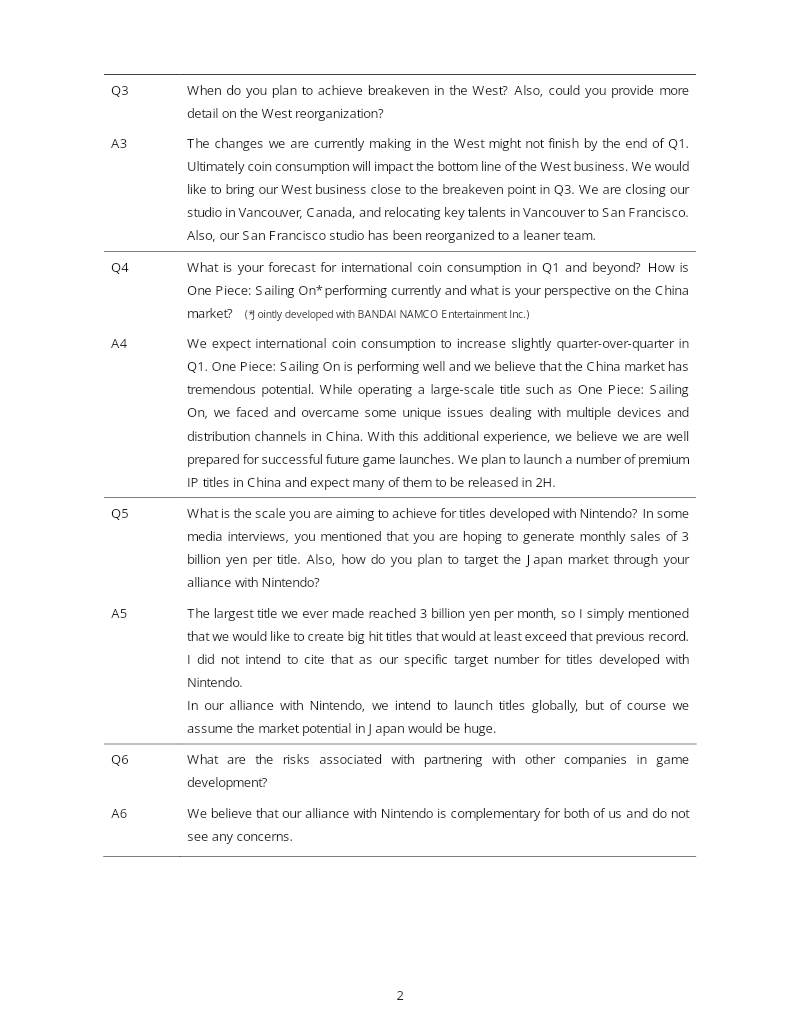
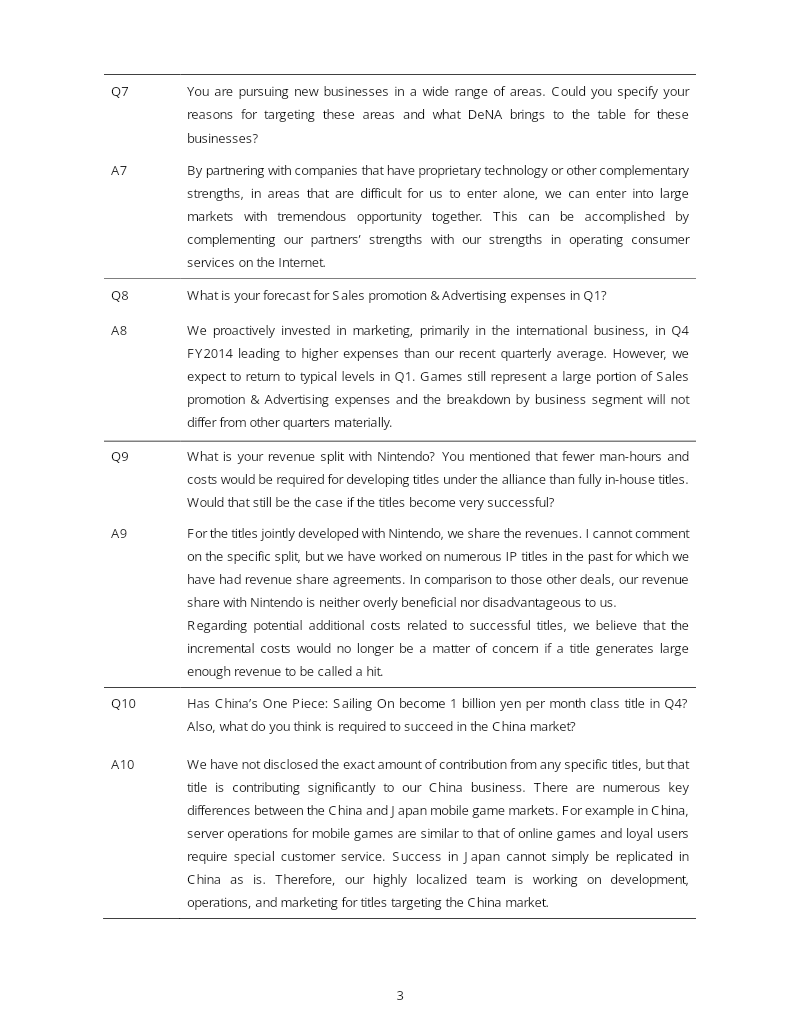
- DeNA is partnering with Nintendo to develop five mobile titles by the end of fiscal year 2016, utilizing a division of labor where Nintendo handles client-side development and DeNA manages server infrastructure.
- The company is undergoing a strategic reorganization of its Western operations, including a 2.7 billion yen one-time expenditure to close its Vancouver studio and consolidate in San Francisco to reach breakeven by Q3.
- DeNA projects a near-term revenue and operating profit decline due to a lull in its native app launch pipeline and seasonal drops in Japanese browser game coin consumption.

FY2014 Earnings Result Briefing Session: Mixi
Mixi, Inc.’s fiscal year 2014 earnings briefing highlights a period of significant financial expansion driven primarily by the success of its smartphone-native game, Monster Strike.
- Mixi's FY2014 sales rose to 112.9 billion yen from 12.1 billion yen the prior year, while operating profit jumped to 52.7 billion yen from 480 million yen.
- The growth was driven primarily by the smartphone game Monster Strike, whose quarterly sales exceeded 40 billion yen by the final quarter of the fiscal year.
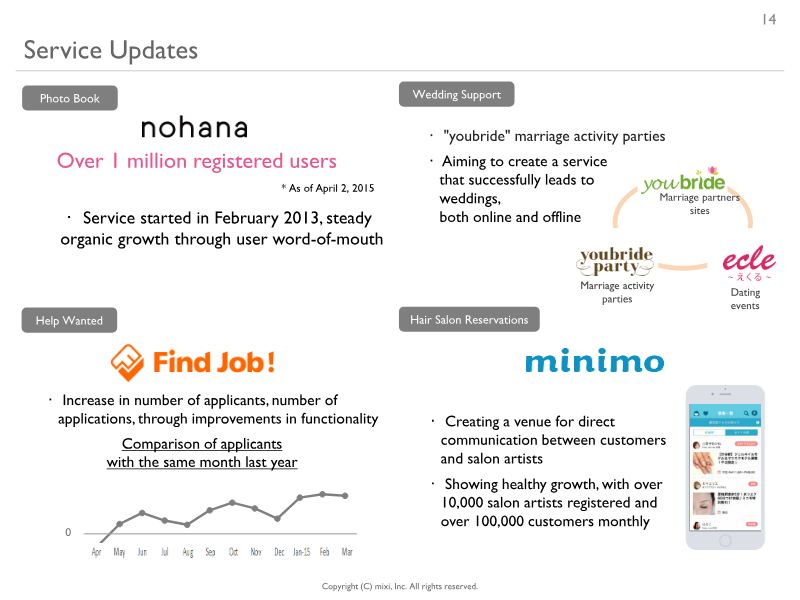
- Mixi operates two segments: Entertainment (smartphone games) and Media Platform (B2C and C2C services such as Find Job!, youbride, and the newly acquired Ticket Camp).