Reports in the Market (PC & Console) category.
The global gaming landscape in 2026 is defined by a widening performance gap between a small elite of top-tier titles and the broader market. Data derived from over 16,000 live mobile games indicates that retention metrics, including D1, D7, and D30, are in a state of decline. With median D30 retention falling below 1%, the industry has become increasingly unforgiving, necessitating a strategic shift toward immediate, high-quality onboarding and the refinement of core gameplay loops to mitigate rising churn rates.
Mobile gaming engagement remains characterized by high-frequency, habitual daily play, yet the industry suffers from a stagnation in innovation and an over-reliance on monetization at the expense of genuine engagement. Success in this segment requires developers to move beyond generic feature sets and instead prioritize behavioral loops that foster long-term habit formation. Conversely, the PC gaming sector operates on a different paradigm, where success is measured by depth, session length, and content longevity. On this platform, retention and engagement metrics serve as indicators of long-term player commitment and the intrinsic value of immersive, long-form experiences rather than simple return frequency.
To navigate these challenges, studios are increasingly turning to advanced data-driven infrastructure to optimize player experiences. By leveraging real-time insights and sophisticated market intelligence, developers can better align their growth strategies with evolving player behaviors. Ultimately, the ability to sustain a competitive advantage in both mobile and PC markets depends on a rigorous focus on content quality and the implementation of robust, data-informed engagement strategies that cater to the specific demands of each platform.
1. Market trajectory What direction is the PC and console market heading in 2026? 8 What direction is the PC and console market heading in 2026? 2. Attention & value allocation Where do players spend time and money on PC and console? 17 3. Market concentration What happens if you are not a top-20 game? 45 4.
The study aims to map the contemporary PC game distribution ecosystem and evaluate whether Steam functions as a de‑facto monopoly, while outlining alternative channels, associated risks, and growth opportunities for developers and publishers. It positions Steam’s dominance against emerging storefronts, physical media, and gray‑market platforms, offering strategic guidance for navigating a fragmented market beyond 2025.
Steam’s market power is evident: 2024 revenue reached $10.8 billion and concurrent active users rose from 25.4 million in 2021 to 40.5 million by September 2025. Eighty‑eight percent of surveyed studios report that Steam delivers over 75 % of their revenue, with 37 % relying on it for more than 90 %. Consequently, 72 % of respondents view Steam as a monopoly and 53 % express concern over this reliance. Nonetheless, diversification is growing—48 % have launched titles on the Epic Games Store, a similar share on the Xbox PC store, while 10 % and 8 % have used GOG and itch.io respectively. Physical releases persist, with 32 % of developers still issuing boxed copies and 72 % of consumers indicating a continued appetite for them.
Alternative distribution via e‑stores (e.g., Humble, Fanatical) and marketplaces (e.g., G2A, Kinguin) is gaining traction: 38 % of developers sell through e‑stores and 30 % through marketplaces. Seventy‑five percent anticipate at least a 10 % revenue uplift from these channels, and 80 % expect them to become
Nintendo Co., Ltd. – FY 2025 Q1‑Q3 Financial Results (Explanatory Material) Prepared 4 Feb 2025 – covering the period 1 Apr 2024 – 31 Dec 2024 (FY 25 Q1‑Q3)
1. Core Financial Highlights (FY 24 Q1‑Q3 vs. FY 25 Q1‑Q3)
| Metric | FY 24 Q1‑Q3 | FY 25 Q1‑Q3 | YoY Δ | |--------|------------|------------|-------| | Net sales | ¥1,394.7 bn | ¥956.2 bn | ‑31.4 % | | Operating profit | ¥464.4 bn | ¥247.5 bn | ‑46.7 % | | Operating profit margin | 33.3 % | 25.9 % | ‑7.4 pts | | Ordinary profit | ¥567.3 bn | ¥327.1 bn | ‑42.3 % | | Net profit (profit attributable to owners) | ¥408.0 bn | ¥237.1 bn | ‑41.9 % | | Net profit margin | 29.3 % | 24.8 % | ‑4.5 pts |
The decline is driven primarily by weaker hardware and software sales, a shift toward a higher share of “Other” (merchandise) revenue, and a less favorable foreign‑exchange environment.
2. Revenue Mix
| Category (FY 24 Q1‑Q3) | FY 25 Q1‑Q3 | YoY Δ | |------------------------|------------|-------| | Dedicated video‑game platform (hardware + software + accessories) | ¥895.5 bn | ‑31.7 % | | – Hardware | ¥895.5 bn × 46.1 % ≈ ¥413 bn | ‑30.6 % (units) | | – Software (first‑party) | ¥895.5 bn × 73.4 % ≈ ¥658 bn | ‑9.1 pts in share | | Mobile / IP‑related income | ¥49.7 bn | ‑33.9 % | | Other (merchandise, official stores, playing cards) | ¥10.9 bn | +27.6 % | | Proportion of sales outside Japan | 76.5 % (FY 25) | up from 71.5 % (FY 24) |
Digital sales grew as a share of software revenue (48.1 % → 51.0 %). The average USD/JPY exchange rate rose from ¥143.22 to ¥152.45, adding ¥9.23 per dollar to the yen‑denominated results.
3. Cost Structure
| Item | FY 24 Q1‑Q3 | FY 25 Q1‑Q3 | YoY Δ | |------|------------|------------|-------| | SG&A expenses | ¥
Global games spending reached a record $199.4 bn in 2024, rising 3.5 % year‑over‑year and projected to stabilize near $200 bn in 2025 with modest growth thereafter. The sector remains smaller than the broader video‑related entertainment market but is nine times larger than recorded music, underscoring its expanding economic footprint. Key growth levers include a $7‑8 bn upside from Nintendo’s Switch 2, which is expected to sell 103 million units by 2030, and an additional $1‑2 bn from enhanced in‑game monetisation. Emerging markets—particularly the Middle East, Africa, and Southeast Asia—offer significant upside driven by youthful, mobile‑savvy populations.
The launch delay of GTA VI is anticipated to shave $2.7 bn from 2025 console spend, creating a sales window for other publishers and Nintendo to capture holiday‑season revenue. Untapped consumer cohorts, such as 16‑24 year‑old females and players aged 55+, represent further opportunities for market expansion.
Publishers are responding to slower growth by shifting toward higher‑margin, low‑cost strategies. Remasters and remakes—examples include Resident Evil 4 and the Final Fantasy VII remake—are becoming primary revenue engines. Simultaneously, platform diversification across PC, console, and direct‑to‑consumer web stores, coupled with hybrid monetisation models that blend advertising, in‑app purchases, and subscriptions, are being tested to optimise returns. Expanding intellectual property into music, merchandising, and cloud‑gaming subscriptions further unlocks value from dormant franchises.
Global PC and console revenues are expected to grow modestly through 2027, with consoles driving the majority of expansion at an estimated +13 % CAGR while PC revenue rises only in single digits. 2024 saw a plateau for PCs, dominated by free‑to‑play and in‑game monetisation, whereas console sales are set to rebound from 2025 thanks to strong releases such as GTA VI and the launch of Nintendo Switch 2. Player growth remains incremental, with PC players increasing at +2.3 % annually and console players at +3.5 %, driven largely by established franchises rather than breakthrough innovation.
Playtime data confirm that 2024 experienced a 6 % YoY increase, with Pay‑to‑Play titles (e.g., Call of Duty) and free‑to‑play hits (Fortnite, Roblox) accounting for most of the lift. New releases captured only about 9 % of total playtime, underscoring that long‑running series dominate the market. Console audiences remain heavily slate‑dependent: 67 % of new‑release hours come from annual franchises, while PC players show a higher share of non‑annual titles. In the US and Western Europe, non‑annual franchise games contribute a smaller slice of console revenue (≈8–22 %) compared to annual franchises, which drive the bulk of earnings.
Engagement patterns reveal a sharp decline in title diversity on PC and Xbox, with the average number of titles played per player falling 27 % on Steam in the US and up to 34 % in Russia and Brazil. PlayStation, by contrast, shows modest growth in title engagement. Genre preferences are shifting away from Battle Royale toward Adventure and Role‑Playing, reflecting a broader industry trend toward narrative‑rich, long‑form gameplay. Nostalgia and free‑to‑play models continue to sustain short‑term spikes, but long‑term retention hinges on continuous content updates and robust live‑service strategies. New IPs must prioritize originality, polished gameplay loops, and community‑first discovery to overcome the legacy brand advantage and achieve lasting commercial success.
The Big Game Engine Report 2025 examines the shifting landscape of game development technology, focusing on the transition from proprietary in-house tools to third-party public engines. The analysis covers over 13,000 games released on Steam, tracking market share trends from 2012 through 2024 with projections reaching 2030. Findings are based on proprietary estimations and tagging methodologies that categorize engines into three tiers: dominant public engines (Unity and Unreal), smaller public engines (Godot, GameMaker, RPG Maker), and custom in-house engines used by major AAA studios.
The central thesis posits that the era of dominant in-house engines is ending as major studios increasingly adopt Unreal Engine 5 to reduce maintenance costs and access a broader talent pool. While custom engines powered over 70% of Steam releases in 2012, they accounted for only 13% of releases in 2024. In terms of commercial performance, custom engines still represent 42% of units sold, but this is the first time they have fallen below the 50% threshold. Unreal Engine has capitalized on this shift, particularly in the AAA space, while Unity remains the leader in sheer volume, powering 51% of all 2024 releases.
The data highlights a clear correlation between game size and engine choice. Unity dominates the "Tiny" and "Small" categories (under 100k units), whereas custom engines and Unreal Engine control the "Large" segment (over 1M units). Emerging trends show Godot as the fastest-growing smaller engine, driving over two-thirds of the growth in its tier since 2020. Looking forward, the industry expects a continued migration toward Unreal Engine 5, with Unity projected to face increasing pressure from open-source alternatives like Godot in the indie sector while struggling to gain further ground in the high-end AAA market.
Executive Summary – “The Importance of Wishlists” (VGI Report, 2025)
1. What the Data Shows | Metric | Key Figure | Insight | |--------|------------|---------| | Games surpassing 100 k wishlists at launch | ~9 % (141/1 500) | Only a small minority achieve the “break‑out” threshold. | | Correlation (wishlists ↔ Month‑1 sales) | r ≈ 0.70 (RSQ ≈ 0.49) | Strong overall link, but it spikes to r ≈ 0.71 for games with > 100 k wishlists. | | Top‑heavy distribution | 1–2 % of titles > 1 M wishlists; > 90 % < 10 k | Success is heavily skewed toward a few blockbuster titles. | | Genre performance | Action/Adventure & RPG/Strategy → highest medians (≈ 180‑190 k) | Casual & MMO titles lag (median ≈ 70‑80 k) and rely more on post‑launch tactics. | | Wishlist momentum | Games that hit 100 k+ before launch have a 71 % chance of strong month‑1 sales vs. 17 % for < 100 k. | Momentum is a “crystal ball” for launch success. | | Steam page creation timing | 40 % of top performers publish 0.5‑1 yr before launch; 35 % publish > 1 yr early. | Early page creation gives sustained visibility and higher wishlist growth. | | Pre‑launch wishlist accumulation | 85 % of wishlists are collected ≥ 4 months before launch. | The bulk of audience commitment happens well before the final countdown. |
2. Why Wishlists Matter
1. Predictive Power – Once a title crosses the 100 k‑wishlist threshold, its first‑month sales become far more predictable (≈ 71 % correlation). 2. Marketing Leverage – High wishlist counts signal strong community interest, making it easier to secure press coverage, influencer partnerships, and paid‑media spend. 3. Resource Allocation – Studios can prioritize titles with early wishlist momentum for larger launch budgets and store‑front promotion. 4. Risk Management – Low‑wishlist titles (≤ 10 k) have a 50 % chance of under‑performing, suggesting a need for contingency plans (e.g., extended beta, community events).
3. How Games Accumulate Wishlists
| Tactic | Effectiveness (based on VGI data) | |--------|-----------------------------------| | Early Steam page (≥ 6 months pre‑launch) | +30 % average wishlist growth vs. late‑launch pages | | Regular content drops (trailers, dev logs, screenshots) | Each major trailer ≈ 10‑15 % spike in wishlist count (case: Kingdom Come Deliverance 2 added ~0.2 M per trailer) | | Early Access / Demo releases | Boosts momentum for “core” genres; median increase ≈ 12 % | | Community engagement (Discord, Reddit AMAs) | Stronger post‑launch
Alinea Analytics provides a comprehensive review of the PC and console gaming market for 2025, offering data-driven insights into player behavior, revenue trends, and regional growth. The analysis highlights a year defined by the continued rise of indie and "Triple-I" titles, which accounted for over 25% of Steam’s revenue. Major success stories like RimWorld’s Odyssey DLC, which earned $10 million to date, and the rapid development of viral hits like RV There Yet? underscore a market where high return on investment is increasingly decoupled from massive studio sizes.
Geographically, the report identifies China as a dominant force, ranking as the top market for Steam and the fifth for PlayStation. This surge is attributed to the momentum of titles like Black Myth: Wukong, with Chinese players making up a significant percentage of the audience for games such as Escape from Duckov and Monster Hunter Wilds. In Europe, the Swedish development scene saw a massive year, capturing significant market share through titles like R.E.P.O. and Split Fiction.
Technical and genre trends show Unreal Engine maintaining its position as the industry standard for AA and AAA development, while Unity remains the backbone for indie successes. Co-op games emerged as a primary revenue driver, representing 11 of the top 20 highest-grossing titles. While adventure and RPGs remain popular, "cute" and "realistic" tags saw the highest year-over-year revenue growth. The data also notes a shift in marketing dynamics: while wishlist campaigns are now standard—requiring nearly 200,000 wishlists to break the top 200 most-anticipated list—conversion rates have declined, placing greater emphasis on post-launch player reception and "shadow drops" for viral success.
The analysis charts the evolution of the souls‑like subgenre from a niche curiosity to a mainstream pillar of the video‑game market, emphasizing the decisive role of APAC developers and Chinese players in shaping its commercial trajectory. By tracking titles released between January 2015 and early 2025, the study demonstrates that while indie studios supplied the bulk of new releases, AAA and AA publishers now dominate revenue, accounting for over 70 % of estimated units sold on Steam.
Sales data reveal a rapid escalation in both volume and concentration. Black Myth: Wukong leads with roughly 20 million units, followed by Elden Ring at 15.6 million, Monster Hunter World at 13 million, Dark Souls III at 9.1 million, and Hades with 8.4 million YTD. The shift in publisher composition is evident: AA releases peaked at 90 % of titles in 2017 but fell to around 30 % by 2023, while AAA output rose to nearly two‑thirds of the market, reflecting a transition from experimental indie projects to large‑scale investments.
Geographically, APAC’s influence surged, reaching roughly 80 % of development share by 2025, with Japan providing a historic foundation and China and Korea expanding both creation and consumption. Chinese gamers now represent close to half of the global souls‑like audience (≈47 %), eclipsing the United States (≈15 %) and Germany (≈5 %). This demographic weight makes success in China a critical determinant for high‑budget releases.
Methodologically, the findings rely on Video Game Insights’ estimations derived from Steam tagging, publisher classification, and sales‑estimation algorithms applied to all souls‑like titles launched from 2015 onward across Steam, PlayStation and Xbox platforms. The overarching conclusion is that the genre’s challenging, skill‑based design continues to attract investment and player engagement, with APAC innovation and the Chinese market ensuring its long‑term viability as a global mainstay.
The 2025 UGC Impact Study, conducted by GameDiscoverCo and commissioned by mod.io, analyzes the commercial and engagement benefits of integrating official user-generated content (UGC) support into video games. The research demonstrates that games offering official modding tools or content-sharing solutions consistently outperform those without such features across PC, console, and VR platforms. By examining a dataset of approximately 1,200 Steam games that generated at least $1 million in their first month, the study finds that titles with UGC support see an 8% revenue advantage after one year, which expands to 31% after five years.
The primary driver for this long-term financial success is significantly higher player retention. On PC, games with UGC support maintain 75% higher concurrent user counts after two years and 115% higher after five years compared to games without these features. Furthermore, the research refutes concerns regarding the cannibalization of official content; games with UGC support actually see 105% higher median revenue per DLC. Case studies, such as Baldur’s Gate 3 and SnowRunner, support these findings, with the latter noting that players using mods were 2.4 times more likely to purchase official DLC.
The scope of the study extends beyond PC to include PlayStation, Xbox, and Meta Quest platforms. On consoles, the impact is even more pronounced in the short term, with UGC-supported titles showing a 16% performance boost on PlayStation and a 24% boost on Xbox after one year. In the VR sector, titles with UGC support experienced 30% more median growth over the past year than those without. The methodology evolved from previous years to include not just Steam Workshop, but also middleware solutions like mod.io and proprietary studio tools, suggesting that the positive correlation between UGC and commercial longevity is a robust, industry-wide trend.
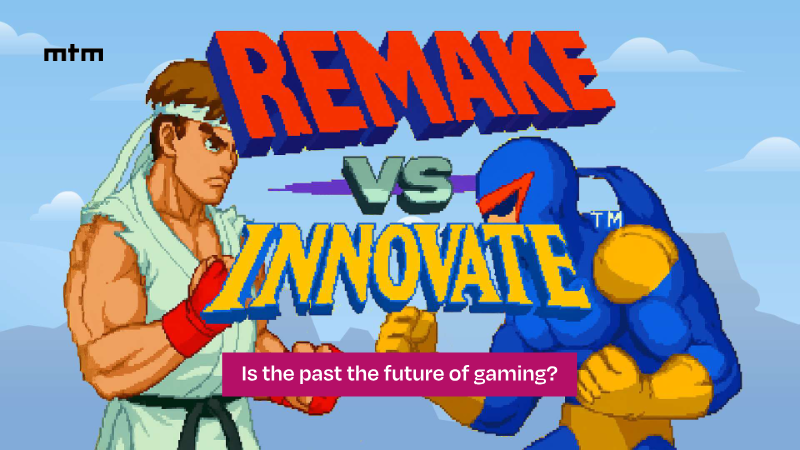
Remakes and remasters have become a cornerstone of the video‑game market, now generating roughly two hundred releases each year and projected to reach about thirty titles in 2025. Their commercial performance consistently exceeds that of the original versions, exemplified by the Resident Evil 4 remake, which sold ten million copies within two years of launch, and the continued success of other high‑profile updates such as the Crash series. This growth reflects a broader industry shift toward leveraging established intellectual property to secure reliable revenue streams.
A survey of 1,500 gamers identifies nostalgia as the dominant motivator for purchasing these updated titles, with more than eighty percent seeking the emotional comfort of revisiting familiar experiences. Seventy‑one percent view remakes as a means to introduce classic games to younger players, while between sixty‑seven and eighty‑five percent appreciate the opportunity to discover titles they missed originally. Players also demand contemporary enhancements, ranking higher‑resolution textures, smoother animation, improved lighting, remappable controls, and bug fixes as essential. Nevertheless, the audience is split: roughly thirty‑five percent each prefer strict fidelity to the original or the freedom to alter narrative and gameplay, highlighting a tension between preservationist and innovation‑leaning attitudes.
Pricing expectations reveal a nuanced market perspective. Nearly half of respondents anticipate remakes to be priced slightly below new releases, while a quarter are comfortable with parity, twenty percent expect a more substantial discount, and a small segment seeks free or bundled options. These preferences shape release strategies, with developers balancing cost, value perception, and the timing of launches to maximize appeal.
While nostalgia‑driven updates can boost sales, an overreliance on remakes risks dampening creative innovation. Gamers express a clear desire for a blend of faithful revisions and fresh original IP, suggesting that sustainable growth will depend on integrating modern improvements with new, inventive experiences across the global gaming landscape.