Global
Documents
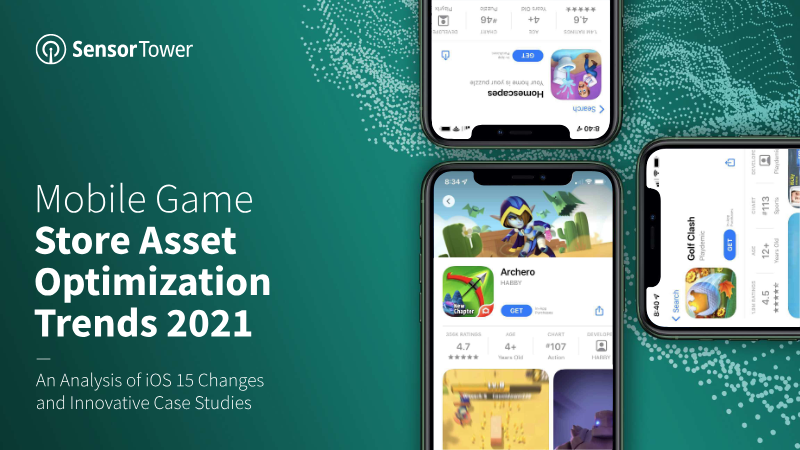
Mobile Game Store Asset Optimization Trends 2021
Strategic store asset optimization is a critical driver for increasing conversion rates and reducing user acquisition costs in the mobile gaming industry. Analysis of top-performing publishers reveals that the most successful entities treat app icons, screenshots, and product pages as dynamic marketing tools rather than static assets. This approach is particularly relevant following the release of iOS 15 in late 2021, which introduced Custom Product Pages and Product Page Optimization. These features allow developers to create up to 35 unique landing pages and conduct native A/B testing for up to 90 days, enabling highly targeted campaigns for specific audiences and influencers.
Data from major titles illustrates several dominant trends in asset management. Seasonal updates are a primary strategy; for instance, Golf Clash implemented 17 icon changes between 2017 and 2021 to reflect holidays like Halloween and St. Patrick’s Day. Other publishers, such as King and Garena, prioritize brand identity by integrating corporate logos across their entire portfolios to leverage existing brand equity. Furthermore, "forever franchises" like Animal Crossing: Pocket Camp use icon updates to signal anniversaries and live operations events, driving re-engagement among lapsed players.
A significant shift in the industry involves the alignment of store assets with high-performing ad creatives. Publishers like Playrix and Nexters successfully utilized "Pull the Pin" advertisements—which often differ from core gameplay—to lower costs per install. To minimize friction and improve conversion, these companies updated their App Store screenshots and icons to match the ad content. While such experimentation was historically more prevalent on Google Play due to its long-standing A/B testing tools, the new iOS 15 capabilities are expected to catalyze similar data-driven optimization strategies across the Apple ecosystem. This analysis utilizes Sensor Tower’s proprietary intelligence platforms to track these trends across global markets and major gaming segments.
- The release of iOS 15 in late 2021 introduced native A/B testing for up to 90 days and the ability to create 35 unique Custom Product Pages, enabling highly targeted audience acquisition.
- Top-performing publishers are aligning App Store screenshots and icons with high-performing ad creatives—such as Playrix and Nexters' 'Pull the Pin' ads—to reduce user acquisition costs and minimize conversion friction.
- Successful mobile game publishers treat store assets as dynamic marketing tools rather than static elements, frequently updating them to reflect seasonal events, anniversaries, and live operations.
- Strategic icon management is a proven re-engagement tactic, exemplified by Golf Clash, which implemented 17 distinct icon updates between 2017 and 2021 to capitalize on holiday-themed content.
- Major publishers like King and Garena leverage brand equity by integrating consistent corporate logos across their entire game portfolios to strengthen brand identity.

Next-Gen Mobile Games: The Arrival of Cross-Platform and Evolution of High-Fidelity Mobile Games
Mobile gaming has emerged as the dominant force in the global games industry, projected to generate $90.7 billion in 2021 and represent over half of all global gaming revenue. This growth is underpinned by a massive player base of 2.8 billion people, which is expected to expand to 3.2 billion by 2023. The industry is currently undergoing a fundamental transformation as it shifts toward high-fidelity experiences characterized by complex mechanics, 3D graphics, and AAA-quality production. While Western markets still lean toward casual titles, mobile-first regions like China are leading this evolution, with high-fidelity games accounting for nearly 70% of the top-grossing iOS titles in that region.
The convergence of mobile hardware and traditional console capabilities is a primary driver of this trend. Advancements in 5G connectivity, cloud computing, and AI-powered procedural storytelling are enabling developers to port flagship PC and console franchises to mobile devices without sacrificing depth. This technological leap has positioned mobile as a first-class platform where cross-platform play and social connectivity are now essential requirements. Furthermore, the rise of dedicated gaming smartphones and premium 5G-ready devices reflects a growing consumer demand for competitive, mid-core, and immersive experiences that were previously restricted to high-end hardware.
Industry leaders anticipate that mobile gaming will achieve technical parity with high-end PCs and consoles within the next five to ten years. As major publishers increasingly prioritize platform-agnostic development, the gap between Western and Eastern market compositions is expected to narrow. The future of the medium lies in its ability to provide sophisticated, snackable, yet deeply immersive content to a mobile-native generation, solidifying the smartphone as the primary gateway for global gaming engagement.
- Mobile gaming is the industry's dominant force, generating $90.7 billion in 2021 and accounting for over half of total global gaming revenue.
- The global mobile player base is projected to grow from 2.8 billion in 2021 to 3.2 billion by 2023.
- High-fidelity games with AAA-quality production now account for nearly 70% of the top-grossing iOS titles in China, signaling a shift away from casual-only dominance.
- Technological advancements in 5G, cloud computing, and AI are enabling developers to port flagship PC and console franchises to mobile without sacrificing mechanical depth.
- Industry experts expect mobile hardware to reach technical parity with high-end PCs and consoles within the next five to ten years.
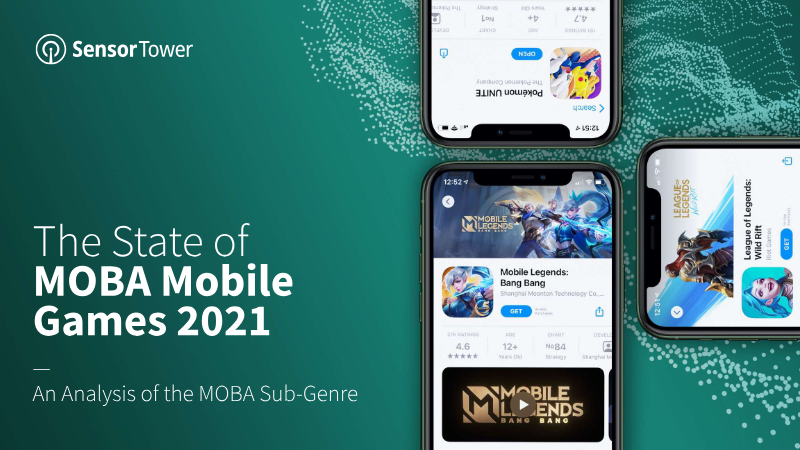
The State of MOBA Mobile Games 2021
This analysis explores the Multiplayer Online Battle Arena (MOBA) sub-genre within the mobile gaming market, focusing on its rapid financial growth and competitive landscape. Leveraging data from Sensor Tower’s Game Intelligence and Store Intelligence platforms, the report examines global trends from 2019 through August 2021. The central thesis identifies MOBAs as a "winner-takes-all" market dominated by a few high-performing titles that command significant player spending despite a general stagnation in overall sub-genre downloads.
The findings reveal that MOBAs are among the fastest-growing segments of the Strategy genre, generating approximately $2 billion in global player spending during the first half of 2021. While Asia remains the dominant force, accounting for 84 percent of total revenue, emerging markets like Brazil, Indonesia, and Russia have become critical hubs for daily active users. Honor of Kings stands as the industry leader, surpassing $10 billion in lifetime revenue, while Mobile Legends and Brawl Stars maintain strong global positions. Notably, the September 2021 launch of Pokémon Unite set a new record for the sub-genre, achieving 15 million downloads in its first two days.
The study also highlights a divergence in monetization and engagement strategies. Titles like Brawl Stars favor simplified mechanics and high long-term retention, whereas others utilize "paid advantage" mechanics—such as stat-boosting skins—to drive higher revenue per download at the potential risk of lower retention. In the United States, intellectual property plays a significant role, with licensed IP games accounting for 43 percent of all MOBA installs. Ultimately, the market is characterized by high concentration among top publishers like Tencent, Supercell, and ByteDance, creating a challenging environment for new entrants without established brand recognition.
- The mobile MOBA market is a 'winner-takes-all' environment dominated by Tencent, Supercell, and ByteDance, making it difficult for new entrants to succeed without established brand recognition.
- Global MOBA player spending reached approximately $2 billion in the first half of 2021, with Asia accounting for 84 percent of total revenue.
- Honor of Kings is the industry leader with over $10 billion in lifetime revenue, while Pokémon Unite set a sub-genre record with 15 million downloads in its first two days following its September 2021 launch.
- While overall sub-genre downloads have stagnated, MOBAs remain one of the fastest-growing segments within the Strategy genre.
- Emerging markets including Brazil, Indonesia, and Russia have become critical hubs for daily active user growth.
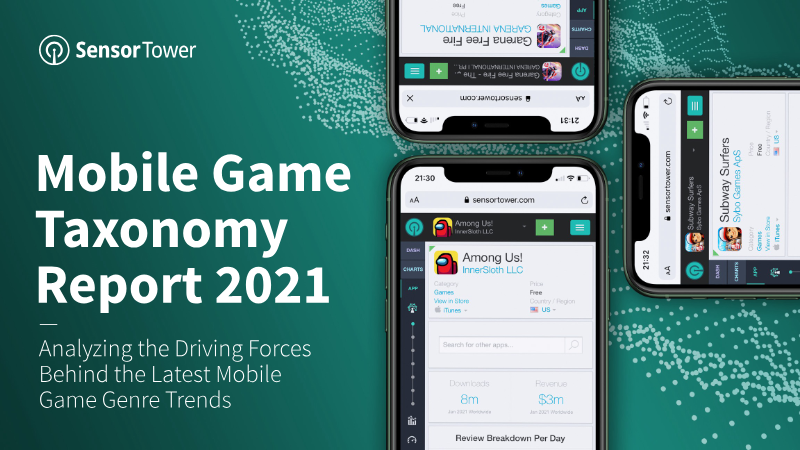
Mobile Game Taxonomy Report 2021
The mobile gaming landscape underwent a transformative shift in 2020, catalyzed by global lockdowns that accelerated adoption across all major categories. Hypercasual games emerged as the dominant force in volume, experiencing a 123% year-over-year increase to reach 6.3 billion downloads and surpassing the Arcade genre. While Simulation games led the market in spending growth with a 56% increase, the RPG and Strategy genres maintained their financial stronghold, generating half of the total global revenue among top-performing titles. This period of growth was further bolstered by the migration of players from physical venues to mobile Casino platforms and the massive commercial success of high-fidelity releases like Genshin Impact.
Visual and thematic trends shifted toward more sophisticated presentations as the market matured. Although 2D Cartoon remained the most prevalent art style, 3D Realistic aesthetics dominated mid-core segments, and Isometric perspectives gained significant traction within the Hypercasual space. Thematic preferences evolved rapidly, with Fashion and Crime themes growing by 109% and 69% respectively. Notably, the viral success of Among Us spurred a resurgence in Space-themed content and influenced the Puzzle genre to adopt more mid-core characteristics.
Innovation in 2020 was defined by cross-genre experimentation and a move toward higher production values in traditionally casual categories. The Fashion genre serves as a primary example of this evolution, transitioning from 2D Side POV styles toward 3D Cartoon aesthetics and First Person perspectives. Developers are increasingly finding success by blending disparate elements, such as integrating Military and Combat Arena themes into Puzzle mechanics. This trend suggests a broader industry movement toward hybrid-casual models that combine accessible gameplay with the deeper engagement and thematic complexity typically found in mid-core titles.
- Hypercasual games became the dominant volume leader in 2020 with 6.3 billion downloads, a 123% year-over-year increase that surpassed the Arcade genre.
- RPG and Strategy titles maintained their financial stronghold, collectively generating 50% of the total global revenue among top-performing mobile games.
- Simulation games experienced the highest spending growth in 2020, recording a 56% increase in consumer expenditure.
- The industry is shifting toward hybrid-casual models that blend accessible gameplay with the thematic complexity and high production values of mid-core titles.
- Thematic demand shifted significantly in 2020, with Fashion themes growing by 109% and Crime themes by 69%.
Mobile App Trends 2021: A Global Benchmark of App Performance
The mobile app industry underwent a transformative period of growth in 2020, characterized by a 50% year-over-year increase in global installs and a total consumer spend of $112 billion. While the fintech sector led in raw install growth at 51%, the gaming industry remained a dominant force with a $165 billion valuation, driven by a 43% surge in hyper-casual downloads. E-commerce demonstrated a distinct trend toward intensified user engagement; despite a modest 6% rise in installs, the vertical experienced a 44% increase in sessions and a 58% jump in in-app transactions, signaling a shift in consumer behavior toward deeper digital integration.
User engagement metrics across the ecosystem reflected this heightened activity, with overall sessions rising by 30%. Fintech and e-commerce sessions saw particularly sharp increases of 85% and 44%, respectively. Within the gaming sector, performance varied significantly by sub-genre. Hyper-casual titles relied heavily on paid acquisition and faced rapid churn, whereas non-hyper-casual games maintained superior retention, reaching median session lengths of 45 minutes by day 30. Cost structures also diverged sharply, as acquisition costs for general gaming peaked at $2.52 per install in the fourth quarter, while hyper-casual costs plummeted to a low of $0.27.
Sustaining growth in this increasingly competitive landscape requires a strategic pivot from volume-based metrics to sophisticated behavioral analytics. Developers must prioritize retention rates and effective cost per install (eCPI) to refine onboarding processes and ensure long-term profitability. Success in the current market depends on a data-driven, UX-centric approach that utilizes automation and real-time measurement to navigate evolving privacy regulations, such as iOS 14. Ultimately, the path to maximizing return on investment lies in personalized marketing campaigns and a granular understanding of vertical-specific user behaviors.
- The gaming industry reached a $165 billion valuation in 2020, bolstered by a 43% surge in hyper-casual game downloads.
- E-commerce experienced a shift toward deeper user integration, evidenced by a 58% increase in in-app transactions despite only a 6% rise in new installs.
- Fintech led all sectors in install growth at 51% and saw an 85% increase in total user sessions.
- Non-hyper-casual games demonstrated superior long-term engagement, achieving median session lengths of 45 minutes by day 30.
- Customer acquisition costs diverged significantly by Q4, peaking at $2.52 per install for general gaming while dropping to $0.27 for hyper-casual titles.
Social Casino Gaming Apps Report
The social casino gaming market experienced significant growth and transformation between August 2020 and August 2021, driven largely by global social distancing measures. While the segment reached a global gross gaming revenue of $6.2 billion in 2020 with a projected increase to $7.5 billion by 2026, the market has become increasingly saturated. High barriers to entry mean that established titles dominate the top rankings, while new entrants struggle to scale. The analysis draws on 83 billion impressions and 12 million installs to provide a comprehensive look at acquisition costs, retention strategies, and player motivations.
Financial data indicates a widening gap between platforms. The average cost-per-install (CPI) on iOS rose to $11.09, making it over twice as expensive as Android, which saw its CPI decrease to $5.00. Despite these costs, the sector maintains healthy performance metrics, with Day 7 return-on-ad-spend (ROAS) averaging 11.12% and Day 30 ROAS reaching 25.18%. Geographically, Latin America offers the lowest acquisition costs at $1.43 per install, though North America remains the primary target for high-value returns.
To combat rising costs and market saturation, developers are increasingly integrating sophisticated "mid-core" features to deepen engagement. Album collectibles are the most prevalent mechanic, appearing in 74% of top games, followed closely by special side-modes and piggy bank monetization systems. Battle passes have seen the most dramatic growth, jumping from 5% to 36% adoption in a single year. These features cater to a unique player demographic that is evenly split by gender but skews older, with nearly half of all users over the age of 45. Successful titles now focus on a "meta-driven" experience, utilizing guild mechanics and narrative elements to move beyond simple slot or bingo loops.
- The social casino market is projected to grow from $6.2 billion in 2020 to $7.5 billion by 2026, though high barriers to entry and market saturation make scaling difficult for new entrants.
- Acquisition costs vary significantly by platform, with iOS CPI reaching $11.09 compared to $5.00 on Android, while Latin America offers the lowest entry point at $1.43 per install.
- Developers are increasingly adopting 'mid-core' features to drive engagement, with battle pass integration growing from 5% to 36% adoption in a single year.
- Album collectibles are the most common engagement mechanic, appearing in 74% of top-performing titles, alongside side-modes and piggy bank monetization systems.
- The sector demonstrates strong financial performance with an average Day 7 ROAS of 11.12% and a Day 30 ROAS of 25.18%.
Casual Gaming Apps Report: The State of Play in 2021
The casual gaming sector experienced significant growth and volatility between March 2020 and February 2021, driven largely by shifting consumer habits during the COVID-19 pandemic. While mobile gaming spend surged to nearly triple that of PC and console platforms, the market became increasingly competitive. Analysis of 246 million installs across 416 apps reveals that while the audience for casual titles is massive, the cost to acquire these users has risen sharply. The average cost-per-install (CPI) for casual games increased by 45.2% year-over-year to $1.96, while return-on-ad-spend (ROAS) saw a corresponding decline, dropping 7.5 percentage points to 29.6% by Day 30.
Market dynamics vary significantly by sub-genre and platform. Lifestyle games emerged as the most expensive to acquire at $2.57 per install but offered the highest engagement, yielding a Day 7 ROAS of 22.5%, which far outperforms Puzzle and Simulation categories. Platform trends indicate a strategic shift toward Android, where CPIs surged by 120% as marketers prepared for privacy changes on iOS. Despite this, iOS remains the more expensive platform, with an average CPI of $4.30 compared to $1.15 on Android.
Geographically, North America remains the most expensive region for user acquisition, while APAC and EMEA offer more cost-effective opportunities. Countries such as France, Germany, and South Korea are highlighted as high-performance markets with relatively low CPIs and strong ROAS. To combat rising costs and diminishing returns, the findings suggest a heavy reliance on creative experimentation, particularly through playable ads, which saw a 113% increase in usage. The data indicates that success in the current landscape requires balancing localized strategies with high-engagement ad formats to convert increasingly distracted global audiences.
- Casual gaming user acquisition costs rose significantly between March 2020 and February 2021, with the average cost-per-install (CPI) increasing 45.2% year-over-year to $1.96.
- Return-on-ad-spend (ROAS) for casual games declined by 7.5 percentage points to 29.6% by Day 30, signaling a tightening market for profitability.
- Android CPIs surged 120% as marketers shifted strategies ahead of iOS privacy changes, though iOS remains more expensive with an average CPI of $4.30 compared to $1.15 on Android.
- Lifestyle games command the highest acquisition costs at $2.57 per install but deliver superior engagement, achieving a Day 7 ROAS of 22.5% that outperforms Puzzle and Simulation categories.
- Playable ads have become a primary mitigation strategy for rising acquisition costs, with usage of this format increasing by 113%.
State of Mobile 2021
The mobile industry experienced a historic acceleration in 2020, effectively compressing two to three years of projected growth into a single twelve-month period. Global app downloads reached 218 billion while consumer spending surged 20% year-over-year to $143 billion. This shift was characterized by a fundamental change in consumer behavior, as global users averaged 4.2 hours of daily mobile engagement, surpassing live television viewership in the United States. Venture capital followed this momentum, with investments in mobile technology rising 27% to $73 billion. Mobile gaming remained the primary economic engine of the ecosystem, contributing 66% of total spend and positioning the sector to exceed $120 billion in 2021.
The global pandemic acted as a catalyst for digital-first adoption across diverse sectors, most notably in finance, streaming, and retail. Time spent in finance apps increased by 45% globally, driven by the democratization of stock trading, while video streaming hours rose by 40%. Retail saw a 30% increase in usage as social commerce emerged as a dominant trend, projected to reach a $2 trillion market value by 2024. TikTok emerged as a standout performer, experiencing a 325% increase in engagement. This heightened activity fueled a robust mobile advertising market, which reached $240 billion in spend, supported by a 95% increase in ad placements within the United States.
Specific categories saw unprecedented spikes in utility, with business app usage growing 275% and health and fitness spending rising 30% to $2 billion. Leading platforms such as Tinder, PUBG Mobile, and TikTok dominated their respective metrics for spend, active users, and downloads. Furthermore, specialized platforms like Azar and SmartNews demonstrated the success of integrating artificial intelligence and real-time data to capture Gen Z and news-seeking audiences. These developments underscore a permanent shift toward a mobile-centric global economy where digital engagement is the primary medium for commerce, communication, and entertainment.
- Mobile gaming remains the primary economic engine of the industry, accounting for 66% of total consumer spending and projected to exceed $120 billion in 2021.
- Global consumer spending on apps rose 20% year-over-year to $143 billion, while daily mobile engagement reached an average of 4.2 hours per user, surpassing live television viewership in the U.S.
- The mobile advertising market reached $240 billion in total spend, bolstered by a 95% increase in ad placements within the United States.
- Venture capital investment in mobile technology grew by 27% to reach $73 billion, reflecting strong investor confidence in the sector's accelerated growth.
- Digital-first adoption spiked across key sectors, with business app usage growing 275%, finance app time increasing 45%, and video streaming hours rising 40%.
The State of App Engagement 2021: An Analysis of Key Global App Usage Trends in 2021
Global app engagement experienced a significant upward trend between 2018 and 2021, catalyzed by the COVID-19 pandemic. Monthly active users (MAU) for the top 500 apps grew at a compound annual growth rate of 12 to 14 percent, with the average top app gaining approximately 10 million MAU annually. While a spike in engagement occurred during 2020 lockdowns, growth rates and time spent largely normalized by the second quarter of 2021, though they remained above pre-pandemic levels.
The analysis covers worldwide usage on iOS and Android across various categories and game genres. Business, Education, and Medical apps emerged as the fastest-growing categories due to shifts in remote work and remote learning. Conversely, Travel and Navigation suffered the most significant declines, though they began a slow recovery as restrictions lifted. In the gaming sector, Hypercasual titles dominated MAU and weekly active user metrics, while the Shooter genre led in daily active users.
Engagement depth varies significantly by category and platform. Social Networking apps see the highest frequency of use, averaging nearly 10 sessions per day on Android, whereas Entertainment apps lead in daily time spent at approximately 30 minutes. Within gaming, mid-core genres like Strategy and RPG command the highest engagement, with users averaging about one hour of play per day. A strong correlation exists between time spent and revenue per download, particularly in mid-core and Casino genres.
Retention trends reveal a divergence between games and non-games. While non-game retention improved during the study period, overall game retention—specifically day 30 metrics—was dragged down by the proliferation of Hypercasual titles, which prioritize high user acquisition over long-term loyalty. Tabletop games remain an outlier in the gaming category, maintaining the highest long-term retention and daily time spent among casual genres. Data for this analysis was sourced from Sensor Tower’s Usage and Store Intelligence platforms, benchmarking the top 100 to 500 apps per category.
- Monthly active users for the top 500 apps grew at a compound annual growth rate of 12 to 14 percent between 2018 and 2021, with the average top app adding 10 million users annually.
- While pandemic-driven engagement spikes normalized by Q2 2021, overall usage metrics across iOS and Android remain higher than pre-pandemic levels.
- Mid-core gaming genres like Strategy and RPG command the highest engagement, with users averaging one hour of play per day and showing a strong correlation between time spent and revenue per download.
- Hypercasual titles dominate in total monthly and weekly active users, but they negatively impact overall day-30 game retention metrics by prioritizing acquisition over long-term loyalty.
- Social networking apps lead in session frequency with nearly 10 sessions per day on Android, while entertainment apps lead in daily time spent at approximately 30 minutes.
Global Games Market Report 2021: The VR & Metaverse Edition
The global games market is projected to generate $175.8 billion in 2021, representing a marginal 1.1% year-on-year decline. This temporary contraction is primarily driven by pandemic-related supply chain disruptions, hardware shortages, and significant delays in AAA game releases, which have disproportionately impacted the console and PC segments. Despite these challenges, mobile gaming continues to expand, accounting for $90.7$ billion or 51% of total market revenue. The Asia-Pacific region remains the dominant force in the industry, contributing over half of all global revenue and supporting 55% of the world’s three billion players.
The long-term outlook for the industry remains robust, with total revenues expected to surpass $218 billion by 2024. This growth is fueled by the permanent acceleration of the metaverse trend, which has transitioned video games from mere entertainment products into essential social hubs. This shift has revitalized the virtual reality sector, particularly following the commercial success of the Oculus Quest 2, and has spurred a wave of consolidation through high-profile mergers and acquisitions. While privacy changes such as the removal of Apple’s IDFA present new hurdles for mobile marketing, the segment’s 4.4% growth indicates continued resilience.
Strategic decision-making in this evolving landscape relies on granular performance metrics and consumer insights across dozens of global markets. By tracking key performance indicators such as monthly active users and retention rates for thousands of titles, stakeholders can navigate the complexities of game development and transaction advisory. Ultimately, the integration of social connectivity, immersive hardware, and mobile accessibility ensures that the gaming industry will continue its upward trajectory beyond the immediate disruptions of the early 2020s.
- The global games market is projected to reach $175.8 billion in 2021, a 1.1% year-on-year decline caused by hardware shortages and AAA game delays.
- Mobile gaming remains the industry's largest segment, generating $90.7 billion and accounting for 51% of total market revenue despite privacy-related marketing hurdles.
- The industry is forecast to reach $218 billion in total revenue by 2024, driven by the long-term growth of the metaverse and social gaming hubs.
- The Asia-Pacific region is the primary market driver, contributing over 50% of global revenue and hosting 55% of the world’s three billion players.
- The virtual reality sector has seen a revitalization in commercial interest, significantly bolstered by the success of the Oculus Quest 2.
Gamer Generations Report: How Different Generations Engage with Games 2021
Gaming has evolved into a primary form of entertainment that transcends age groups, though engagement patterns vary significantly by generation. Younger cohorts, specifically Gen Z and Millennials, now prioritize gaming over traditional media like television or social media, spending approximately 25% of their leisure time on the medium. While 81% of Gen Z identifies as gamers, the hobby maintains a strong foothold among older populations, with 42% of Baby Boomers participating. This data suggests that gaming has become a focal point for global leisure, offering brands extensive opportunities to reach diverse audiences across 33 surveyed markets.
The depth of engagement is highly correlated with age. Younger generations exhibit multi-dimensional behaviors, including viewing game-related content, participating in online communities, and utilizing games as social hubs. For Gen Z and Millennials, streamers and content creators serve as major cultural influences, with over two-thirds of these groups both playing and watching gaming video content. In contrast, older generations like Gen X and Baby Boomers engage more casually, primarily using mobile platforms to fill time or unwind. Their motivations are largely practical, often seeking out reviews or "tips and tricks" rather than social or competitive experiences.
The industry is currently shifting toward the metaverse, characterized by virtual spaces that host non-gaming activities such as concerts and social gatherings. Approximately 70% of Gen Z gamers expect to spend time in game worlds without actively playing the main game, signaling a move toward digital persistence and self-expression. While younger players favor sandbox and battle royale genres that empower creativity, all generations express interest in metaverse features like free advertiser-sponsored content and avatar customization. This research, based on a sample of over 72,000 respondents, concludes that gaming is no longer just a pastime but a foundational component of modern social identity and digital interaction.
- Gaming has become a primary entertainment medium, with Gen Z and Millennials dedicating approximately 25% of their total leisure time to it.
- Engagement depth is age-dependent: 81% of Gen Z identify as gamers, compared to 42% of Baby Boomers, with younger cohorts treating games as social hubs rather than just casual pastimes.
- The metaverse is gaining traction, as 70% of Gen Z gamers report an intent to use game worlds for non-gaming activities like socializing and attending events.
- Over two-thirds of Gen Z and Millennials both play games and consume gaming video content, positioning streamers and creators as primary cultural influencers for these demographics.
- While younger players prioritize creative sandbox and battle royale genres, older generations primarily utilize mobile platforms for casual, functional engagement like seeking tips or unwinding.
Intro to the Metaverse 2021
The metaverse represents a fundamental evolution of the gaming industry, transitioning from Games-as-a-Service to Games-as-a-Platform. In this new paradigm, virtual worlds function as persistent social hubs where identity, creativity, and commerce converge. This shift is driven by the rise of user-generated content, large-scale simulations, and decentralized economies that blur the boundaries between digital and physical realities. High-profile virtual events, such as major in-game concerts, demonstrate the massive engagement potential of these platforms, often attracting tens of millions of unique participants and generating significant cross-media growth for brands and artists.
Consumer appetite for these social game-worlds is substantial across global markets, with 70% of players expecting the metaverse to increase their total playtime and a significant majority of non-gamers expressing interest in joining. While Western development emphasizes decentralized identity and blockchain integration, the Chinese market is evolving toward a mobile-first, "omni-channel" experience led by major domestic tech giants. These regional differences highlight a broader trend toward "direct-to-avatar" supply chains and the legitimization of secondary markets, where digital assets and virtual real estate can command valuations in the hundreds of thousands of dollars.
The integration of blockchain technology and Non-Fungible Tokens (NFTs) serves as a critical catalyst for this ecosystem by enabling true digital ownership and "Play-to-Earn" models. These innovations transform player activities into viable digital jobs and provide developers with new revenue streams through secondary market royalties. However, realizing the full potential of the metaverse requires significant technological infrastructure, including cloud-native development to support mass concurrency and open standards for interoperability. While challenges regarding global moderation, environmental impact, and regulation persist, the metaverse is poised to become a decentralized, mobile-accessible ecosystem that complements physical reality.
- The gaming industry is transitioning from Games-as-a-Service to Games-as-a-Platform, where virtual worlds function as persistent social hubs for identity, creativity, and commerce.
- Consumer demand is high, with 70% of players expecting the metaverse to increase their total playtime and a significant portion of non-gamers expressing interest in participation.
- Blockchain technology and NFTs are enabling digital ownership and 'Play-to-Earn' models, allowing players to treat in-game activities as digital jobs while providing developers with secondary market royalties.
- Digital assets and virtual real estate are becoming legitimate investments, with some valuations reaching hundreds of thousands of dollars.
- Regional development strategies are diverging, with Western markets prioritizing decentralized identity and blockchain, while the Chinese market focuses on mobile-first, omni-channel experiences.