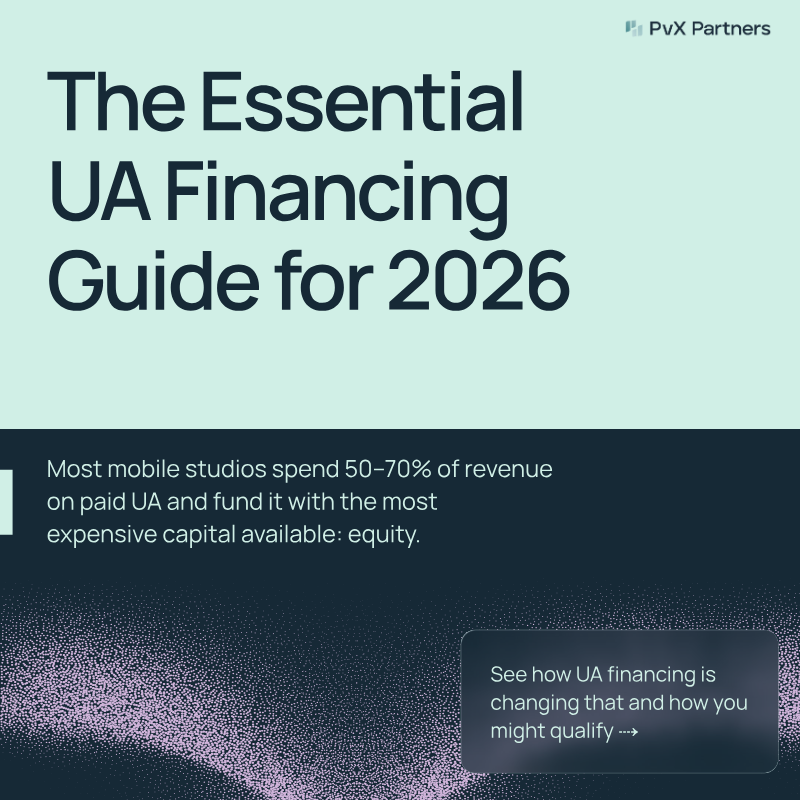
Updated Jun 1, 2026 by HPvX Partners
Report
Published by HPvX Partners
Cohort User Acquisition Financing Mobile gaming market has returned to growth Weathering a challenging 2022-2023, the mobile sector proves its resilience through innovation Mobile gaming rebounds from adversity... ... as Mobile gaming rebounds from adversity… … as industry players adapt to new environment 2020A -2025E CAGR Str TOTAL: 5.0% | IAP: 2.1% | IAA: 16.2% • ...
Mobile gaming market has returned to growth Weathering a challenging 2022-2023, the mobile sector proves its resilience through innovation Mobile gaming rebounds from adversity... ... as Mobile gaming rebounds from adversity… … as industry players adapt to new environment 2020A-2025E CAGR 2020A -2025E CAGR Str TOTAL: 5.0% | IAP: 2.1% | IAA: 16.2% • Strong IAA growth driven by growing popularity of casual puzzle 160.0 137B 143B 80.0 genre and implementation of hybrid monetization and mechanics 140.0 129B 129B $130B 75.0 • AI-powered AdTech engines improving user acquisition campaigns 120.0 $112B performance (notably AppLovin’s AXON) 100.0 18.8 26.5 33.9 34.5 36.8 39.8 70.0 • Rewarded Ad platforms opening new user acquisition channels and 65.0 driving user loyalty 57.7 56.9 56.5 60.0 • Multiplatform adaptability as studios launch titles on PC/web 55.5 platforms to bypass mobile app stores fees 60.0 pla 52.3 55.0 • IP licensing collaborations with major IP holders leveraging their 40.0 52.3 IP 50.3 IP licensing collaborations with major IP holders leveraging their 50.3 popularity to bring new audience/fanbase into games popularity to bring new audience/fanbase into games po| 93.0 102.9 95.3 95.1 100.3 103.1 +4 0.0 93.0 95.3 95.1 100.3 103.1 45.0 Projected mobile gaming % CAGR 2020A 2021A 2022A 2023A 2024A 2025E market growth 2020A 2022A 2024A 2025E – 2027E In-App Purchases (B) In-App Ads (B) Downloads (B) market growth In-App Purchases (B) In-App Ads (B) -Downloads (B) n 2
0 102.9 95.3 95.1 100.3 103.1 +4 0.0 93.0 95.3 95.1 100.3 103.1 45.0 Projected mobile gaming % CAGR 2020A 2021A 2022A 2023A 2024A 2025E market growth 2020A 2022A 2024A 2025E – 2027E In-App Purchases (B) In-App Ads (B) Downloads (B) market growth In-App Purchases (B) In-App Ads (B) -Downloads (B) n 2025E -2027F Source: NewZoo, Omdia, SensorTower, Business of Apps
Yet, mobile founders operate in a scarce VC capital environment Despite industry growth and notable VC-backed exits, mobile studios struggle to raise capital Mobile gaming has seen many sizable exits.. ...but VCs remain cautious about doubling down on the sector Mobile gaming has seen many sizable exits… ...but VCs remain cautious about doubling down on the sector VC CAPITAL DEPLOYED IN MOBILE GAMING STUDIOS ($M) IPOs¹ M&As² VC CAPITAL DEPLOYED IN MOBILE GAMING STUDIOS ($M) $900 26 23 21 21 25 King BEE dream $800 O 20 20 14 18 17 15 16 16 20 7.1B 10.2B ~5.0B 700 754 589 12 11 9 8 9 12 15 $508 10 zynga X peak 400 354 -5 7.0B SCOPELY GAMES 279 4.9B 1.8B 300200100 153 41 31 167 101 89 27 43 32 45 102 75 61 ( 5)( 10)( 15) 2ROVIO SMALL Superplay $0 Q3-21 Q1-23 Q4-23 Q3-24 Q1-25 ( 20) Q1-21 Q1-22 Q3-22 Q3-23 Q2-24 $1.1B GIANT Q2-21 Q4-21 Q2-22 Q4-22 Q2-23 Q1-24 Q4-24 Q2-25 7.1B 700m $700m 700m 700m Deal Value ($m) # of Deals Deal Value ($m) —# of Deals How should mobile studios adjust to this capital scarcity? bile studios adjust to this capital scarcity? Source: InvestGame; press releases How should mobile studios a 3 Note: (1) market cap at initial IPO offering price; (2) announced or estimated upfront enterprise value of the company
Mobile companies require massive UA investments to scale High capital-intensive nature of mobile gaming business is a true barrier to growth Mature mobile gaming companies reinvest ~l/3 of revenue in UA Only a few studios raise enough capital Mature mobile gaming companies reinvest ~1/3 of revenue in UA Only a few studios raise enough capital nies Publicly listed mobile gaming companies Large private companies ~10% Publicly listed mobile gaming companies Large private companies of all mobile startups raise $30m+ ANNUAL ADVERTISING / USER ACQUISITION SPEND IN 2024CY # OF STUDIOS BY TOTAL CAPITAL RAISED⁴ 2020-25YTD 201m 210m 191m 564m 39m 38m 144m¹ 522m² 209m³ 100m+ 11 dream X Voodoo 50% 48% 34% 50% 45% SCOPELY NIANTIC SPYKE 40% 37% median UA spend 40% 35% $30-100m 12 Serond Superplay 30% share in gross revenue 34% DinneR 22% $10-30m 25 agave grand BIG GER 20% 16% 13% 20% $5-10m 35SUGERS TOP FOM $5-10m 10% 10% $5-10n 35 APP games GAMES <$5m 142 ^GDEU MI StilfrontPlaytikaHuUUGE <$5m JUICY BUTTONS AVAGE 142 playstudios Easybrain Apps daMisrueIo₆₀ APPLOVIN PLARIUM Can strong newcomers truly be competitive with limited access to capital? Can strong newcomers truly be competitive with limited ace Source: earnings releases; InvestGame with limited access to capital? 4 Note: (1) disclosed in M&A announcement press release; (2) includes only stand-alone Apps division (CY2024); (3) estimated
Smaller players require an even higher share of reinvestment PvX Partners analysis of 3,000+ cohort metrics reveals the inconvenient truth of scaling mobile apps Net ROAS benchmarks for casual games by percentile Mar Net ROAS benchmarks for casual games by percentile Marketing Investment Marketing Investment NET RETURN ON MARKETING SPEND AFTER DEDUCTING PLATFORM FEES NET RETURN ON MARKETING SPEND AFTER DEDUCTING PLATFORM FEES 200% 207% ~70% 34% 80ᵗʰ of net revenues are vs. of gross revenue spent on user for large-scale 150% acquisition¹ publishers 139% At ~200% Net ROAS, the 80th percentile of 100% 60ᵗʰ • profitable gaming studios can expect to 78% 96% spend ~50% of net revenues on marketing 40ᵗʰ • At 139% Net ROAS and below, most studios can expect to spend 70%+ of net revenues on 49%50% 57% marketing 35% 20ᵗʰ marketing 21% Smaller mobile studios are even more 21%0% dependent on marketing funds to scale M1 M6 M12 revenues and cover operating expenses M7 M6 M12 revenues and cover operating expenses Given the high UA investment requirement, traditional VC funding is simply not enough Given the high UA investment requirement, traditional VC funding Source: PvX Partners I VC funding is simply not enough 5 Note: (1) vast majority spend 70% of net revenue, equivalent to ~50% of gross revenue (adjusted for 30% platforms fees)
Despite M&A recovery, growth capital remains constrained While Seed rounds remain healthy, follow-on rounds are rare despite strategics seeking scaled assets Mob Control M&A deals and IPOs in mobile gaming Mobile gaming VC-led rounds over 2020-2025 YTD 1 Mobile gaming VC-led rounds over 2020-2025 YTD 13 12 IPOs ~8% of studios 10 13 12 with $1B+ market cap raised follow-on rounds after $12.0 7 8 6 at listing date 10 31 25 Seed fundraising 27 40 10.0 13.6 - 4 1 2 5 5 1 200 16 13 18 23 20 19 21 25 11 20 - 1 000 11 7 18 12 6 7 10 - 8.0 7.6 ( 5) $1,261 5 5 5 6.0 6.8 5.7 6.3 ( 10) 800 540 630 ( 20) $507 2.9 400 289 $306 289 306 1.8 ( 25) 28 198 190 ( 80) 2.0 7.8 1.2 200 198 190 147 $135 1.2 0.7 ( 30) $75 ( 100) - 0.1 0.7 $75 0.0 H1-20 H2-20 H1-21 H2-21 H1-22 H2-22 H1-23 H2-23 O.1 ( 35) - ( 120) H1-24 H2-24 H1-25 H1-20 H2-20 H1-21 H2-21 H1-22 H2-22 H1-23 H2-23 H1-24 H2-24 H1-25 H1-20 H2-20 H1-21 H2-21 H1-22 H2-22 H1-23 H2-23 H1-24 H2-24 H1-25 Cumulative Upfront EV in M&As (B) 2 # of M&As and IPOs 5 H1-2 Seed Deal Value (m) Series A & B+ Deal Value ($m) Cumulative Upfront EV in M&As ($B)2 — # of M&As and IPOs # of Series A & B+ # of Seed Source: InvestGame # of Series A & B+ •# of Seed Note: (1) mobile gaming M&A transactions with upfront EV above $60m; (2) incl. AppLovin deal closed on 1ˢᵗ July 2025
The interim filing presents the fourth‑quarter 2025 financial results for a midcore‑casual gaming group, emphasizing a record‑setting revenue run and the successful execution of a transformation agenda that includes the integration of the Plarium acquisition and the rollout of a new district structure in early 2026. Revenue reached SEK 3,123 million, reflecting 108 % organic growth year‑on‑year and a 25 % increase on a constant‑currency basis, while adjusted EBITDA rose to SEK 717 million, delivering a 23 % margin that matches the full‑year figure. Unlevered free cash flow amounted to SEK 878 million, with a cash‑conversion rate of 66 % and a leverage ratio of five times EBITDA, underscoring robust liquidity and disciplined capital management. User‑acquisition spending accelerated, representing 38 % of quarterly revenue—up from 37 % in the prior quarter—and grew 76 % on a reported basis, driven by heightened investment in original studios, new casual titles, and the racing franchise. The direct‑to‑consumer channel expanded by 600 basis points to 32 % of total revenue, reflecting a strategic shift toward higher‑margin in‑app purchases. Across the fiscal year, the company posted a 9 % organic revenue increase, with word‑games, racing, and RAID franchises delivering the strongest quarter‑end performance. Operating cash flow for the quarter stood at SEK 840 million, while adjusted net income was SEK 1,390 million, translating to an adjusted EPS of SEK 11.33. The financial outcomes exceed guidance and position the firm to meet its medium‑term outlook, with a pre‑IPO study for PlaySimple concluded and the midcore transformation progressing as planned.
The Q4 2025 investor presentation details a period of record financial performance for the company, characterized by significant revenue growth and successful strategic integration. The primary thesis centers on the company’s transformative year, highlighted by the successful consolidation of Plarium and a shift toward a midcore gaming focus. For the fourth quarter of 2025, the company achieved net sales of SEK 3,123 million, representing an 8% organic growth rate and a 108% increase in constant currency year-over-year. Adjusted EBITDA reached SEK 717 million, maintaining a 23% margin, while unlevered free cash flow totaled SEK 878 million with a 66% conversion rate. The scope of the report covers the global gaming operations of the company throughout the 2025 fiscal year, with specific emphasis on the fourth quarter. Key operational findings indicate that user acquisition (UA) spending rose to 38% of revenue in Q4, a 98% year-over-year increase in constant currency, largely driven by the integration of Plarium and the scaling of casual and racing franchises. Revenue streams showed a notable shift, with direct-to-consumer contributions rising 600 basis points to 32% of the total. Franchise performance was bolstered by strong results in the racing and word game segments, which saw year-over-year growth of 43% and 28%, respectively. Methodologically, the financial data is presented on a reported basis, with constant currency adjustments applied to isolate organic growth trends. The report incorporates full-year 2025 figures and highlights the impact of the Plarium acquisition, which was integrated into the group starting in February 2025. Looking ahead, the company concludes the period with a stable leverage ratio and a new organizational structure, positioning itself for continued midcore expansion and the potential public offering of its PlaySimple division.
Most mobile studios spend 50–70% ofrevenue expensive capital available: equity. GlobalUA spend hit$78B in2025, User Acquisition Financing is non-dilutive growth capitalthat funds your marketing Repayment in lock-step with userrevenues Your cash balance growswhile UA scales Downside is shared if cohorts underperform 1 Share your cohort data (Appsflyer, Adjust, GCP, <u>2</u> Cohorts areunderwritten and a facility issized 3 Draw down up to 80% of your UAspends for each <u>4</u> R...
2023 - 2025 (Key Insights and Data) QUONADIS ● Users in Gaming on different platforms CANDISS ● The Attention Economy: Gaming vs. Other Leisure Spending oy ss GANG Ae IED ● Mobile Gaming Marketability ● Downloads and Revenue Concentration in Mobile Gaming ● Mobile Gaming vs Non-Gaming ● Mobile Gaming Growth (Android vs.