Brazil
8 documents·5 publishers
Documents
Report33 pages
State of the LATAM Games Industry 2026
Latin America has solidified its position as a formidable force in the global gaming landscape, transitioning from a peripheral source of cost-effective labor to a sophisticated hub of creative innovation and live service expertise. Driven by massive, mobile-first player populations in Brazil and Mexico, the region is increasingly defined by high levels of community engagement and a thriving esports culture. While economic challenges such as currency volatility and limited infrastructure persist, the industry is successfully pivoting toward sustainable, long-term business models that prioritize authentic, socially integrated experiences over traditional, short-term monetization strategies.
The regional ecosystem is characterized by a strategic shift toward self-publishing and advanced Live Ops, supported by a deep pool of engineering talent that is increasingly utilizing artificial intelligence to enhance production efficiency. Although major hubs like Brazil and Mexico anchor the market, smaller nations such as Argentina and Ecuador are gaining international visibility through indie innovation and strategic global partnerships. This evolution reflects a broader maturation of the industry, where developers are moving beyond simple localization to address the specific technological and cultural nuances of individual domestic markets.
Success within this territory requires a departure from standardized global frameworks in favor of localized strategies that account for unique payment preferences and regional economic constraints. Despite systemic hurdles regarding access to specialized venture capital and user acquisition, the region offers significant growth potential for developers who commit to long-term engagement. By fostering trust and prioritizing accessibility, the Latin American gaming sector is effectively countering the stagnation currently impacting global mobile markets, establishing itself as a vital, influential player in the international creative economy.
- Brazil and Mexico serve as the region's primary anchors, with Brazil driving engagement across all platforms and Mexico acting as a commercial gateway for global publishers.
- Mexico's gaming industry generated $1.27 billion in revenue in 2024, with mobile and tablet devices accounting for 72% of all gaming activity.
- Brazil hosts a robust ecosystem of over 1,000 developers, while indie game creation in Mexico grew by 30% year-over-year in 2023.
- Successful regional studios like Chile-based TinyBytes have achieved significant scale, with over 100 million downloads and $40 million in lifetime gross revenue from titles like Massive Warfare.
- Growth in the LATAM market is frequently driven by localized payment methods, such as PIX in Brazil and OXXO in Mexico, which are essential for reducing friction in price-sensitive, mobile-first economies.
+3
GamesBeatMay 2026
Report171 pages
Brazilian Gaming Industry Report 2023
The Brazilian gaming industry represents a rapidly maturing ecosystem that defied global trends in 2022, growing by 3% to reach 103 million players while the international market experienced its first contraction. With 1,042 active studios as of 2023—a 177% increase over five years—the sector is primarily composed of micro and small enterprises concentrated in the Southeast and South regions. Despite this expansion, local studio revenue accounts for only 10% of domestic consumption, highlighting a significant gap between local production and the country’s status as the world’s fifth-largest online gaming population.
Development trends show a shift toward multi-platform strategies, with computers and mobile devices serving as the primary targets for the 1,009 games produced in 2022. While 93% of studios develop proprietary intellectual property, there is a burgeoning reliance on international markets; 65% of studios active abroad derive more than half of their revenue from exports. Furthermore, the industry has seen a 62% surge in outsourcing services, particularly in 3D art and animation, signaling a transition toward high-value service provision for the global entertainment sector.
The workforce expanded to over 13,000 professionals in 2022, characterized by a 70% remote work rate and an increasing focus on administrative roles that suggest greater corporate maturity. However, the industry faces persistent structural and social challenges. The lack of a specific national economic classification complicates data collection, while diversity remains a critical area for improvement. Women represent only 24.3% of the workforce, and minority groups remain underrepresented. While external initiatives and diversity councils aim to foster inclusivity, 82% of companies still lack formal internal inclusion policies, indicating that the sector’s social evolution has yet to match its rapid economic and technical acceleration.
- Brazil’s gaming market grew 3% in 2022 to 103 million players, even as the global market contracted, yet local studios capture only 10% of domestic consumption.
- The number of active gaming studios in Brazil reached 1,042 in 2023, representing a 177% increase over the previous five years.
- The industry is increasingly export-oriented, with 65% of studios operating abroad generating more than half of their revenue from international markets.
- Outsourcing services, particularly in 3D art and animation, surged by 62% in 2022, marking a shift toward providing high-value services to the global entertainment sector.
- The workforce grew to over 13,000 professionals in 2022, with a 70% remote work rate and a growing emphasis on administrative roles indicating increased corporate maturity.
+1
AbragamesMar 2024

Report166 pages
Pesquisa Nacional da Indústria de Games 2023
The 2023 national survey of Brazil’s game‑development ecosystem maps the sector as it stood in 2022, revealing a vibrant but highly fragmented industry dominated by micro‑ and small studios. With 1,042 active studios and a representative sample of 309 developers, 214 freelancers and 80 support organisations, the market expanded despite a 5.1 % contraction in the global games market, delivering a 3 % domestic growth that lifted the industry to US $182.9 bn in 2022 and projecting US $206.4 bn by 2025. Brazil ranks fifth worldwide in online population, hosting roughly 103 million gamers; revenue generation is led by mobile (49 %), followed by PC (26 %) and consoles (25 %), while gender parity approaches equality with women accounting for 46.2 % of players.
Export orientation is emerging, as 76 % of developers target the domestic market but substantial shares also aim at the United States (58 %), Latin America (57 %) and Western Europe (55 %). Prospects for the next three years show Canada and Latin America each featuring in 47 % of sales roadmaps, with China appearing in 44 % of plans, indicating a gradual diversification of export destinations. The sector is supported by 17 regional industry associations and coordinated nationally by Abragames, Brazil Games and ApexBrasil, which provide market representation, business‑matching missions and participation in overseas fairs.
Artificial intelligence dominates technology priorities, cited by more than half of respondents as a short‑ and long‑term focus, while XR/VR/AR follows closely, driven by 5G and new engines such as Unreal Engine 5. Interest in blockchain and
- Brazil’s game industry grew 3% in 2022 despite a 5.1% global market contraction, reaching a valuation of US$182.9 billion with projections to hit US$206.4 billion by 2025.
- The Brazilian market is highly fragmented, consisting of 1,042 active studios that are primarily micro or small in size.
- Mobile gaming leads revenue generation at 49%, followed by PC at 26% and consoles at 25%, supported by a massive domestic player base of approximately 103 million people.
- Developers are increasingly export-oriented, with 58% targeting the U.S., 57% targeting Latin America, and 55% targeting Western Europe, while future roadmaps show growing interest in China (44%).
- Artificial intelligence is the primary technology priority for over 50% of developers, followed by XR/VR/AR applications enabled by 5G and Unreal Engine 5.
+1
AbragamesJan 2023
Report24 pages
Brazilian Game Industry 2023
Fact Sheet 2023 – Brazil Game Industry – Executive Summary
Below is a concise synthesis of the most relevant data, trends and insights from the 2023 Fact Sheet (compiled July 2023) on the Brazilian games sector. All figures refer to the 2022‑2023 survey period unless otherwise noted.
1. Macro‑economic context | Indicator | 2022 | 2023 (survey) | |-----------|------|---------------| | Growth of the sector | +3 % (contrasting with a 4,3 % global decline) | Continued modest growth; Brazil remains one of the few markets expanding year‑on‑year. | | International revenue share | 70 % of studios earn > 50 % of their turnover abroad | 58 % of studios now sell internationally; 10 % have permanent reps or PR offices overseas. | | Key export markets | United States (58 %), Latin America (57 %), Western Europe (54 %) | Same hierarchy, with a noticeable rise in Western‑European share (from 49 % to 54 %). |
2. Industry structure & geography | Metric | Value | |--------|-------| | Active development studios (2022) | ≈ 1 042 (↑ ~ 2 % YoY) | | Studios > 10 yr old | 17 % | | Studios < 2 yr old | 19 % | | Formalised studios | 85 % (63 % of the non‑formalised plan to formalise within 2 yr) | | Regional distribution | Southeast 58 % (dominant hub), South 20 % (‑1 % YoY), Northeast 15 % (+1 % YoY), Center‑West 6 %, North 2 % (‑1 % YoY) | | Unlocated studios | 222 (data gaps) |
Implication: The sector is highly concentrated in the Southeast, but growth is emerging in the Northeast and other regions, driven by remote‑work adoption and expanding local education programs.
3. Internationalisation & market exposure Export activity: 58 % of surveyed studios reported sales abroad in 2022. Foreign representation: 10 % maintain a dedicated overseas representative or PR office. International business exposure (2022 vs 2023): Visitor/Listener at foreign events – 33 % → 39 % Exhibitor/Presenter – 17 % → 14 % Commercial missions – 10 % → 13 % International round‑tables – 30 % → 33 %
Key takeaway: Participation in B2B events abroad is the most effective lever for increasing foreign sales and partnerships.
4. Technology stack (engines) |
- The Brazilian game industry grew by 3% in 2022, bucking the global trend of a 4.3% market decline.
- International revenue is a primary driver for the sector, with 58% of studios selling abroad and 70% of those studios generating more than half of their turnover from foreign markets.
- The industry consists of approximately 1,042 active development studios, with 85% of these entities formally registered.
- The Southeast region remains the dominant hub, hosting 58% of all studios, though emerging growth is visible in the Northeast, which saw a 1% year-over-year increase.
- Export activity is heavily concentrated in the United States (58%), Latin America (57%), and Western Europe, with the latter showing the most significant growth in market share from 49% to 54%.
AbragamesJan 2023
Report23 pages
Pesquisa da Indústria Brasileira de Games 2022
The 2022 Brazilian Games Industry Survey demonstrates that Brazil’s gaming sector has entered a phase of rapid expansion and increasing global relevance. Between 2018 and 2022 the number of domestic development studios more than doubled, rising from 375 to 1,009, while domestic digital‑game sales reached over US $2.3 billion in 2021, accounting for roughly three‑quarters of the market’s total revenue. This growth reflects a maturing ecosystem that now includes a full spectrum of domestic and foreign participants, from independent creators to multinational publishers.
The analysis highlights a dual‑track outlook in which private investment is expected to intensify, driving higher levels of international publishing, scaling of emerging opportunities, and greater promotion of Brazilian events abroad. Concurrently, public agencies such as Abragames, Brazil Games and ApexBrasil are projected to expand quantitative support through export missions, business‑matching initiatives and promotional campaigns, reinforcing the sector’s export potential. A broad portfolio of recent Brazilian titles illustrates the country’s expanding talent pool and creative versatility, positioning Brazil as a competitive player on the world stage.
Overall, the findings underscore a robust, export‑oriented trajectory for Brazil’s gaming industry, driven by a surge in studio formation, strong domestic sales, and coordinated public‑private efforts aimed at amplifying international visibility and market access. The survey’s scope encompasses the national market from 2018 through 2022, covering studio demographics, revenue figures, and the institutional framework supporting the sector’s growth.
- The number of domestic game development studios in Brazil more than doubled between 2018 and 2022, growing from 375 to 1,009.
- Domestic digital game sales in Brazil reached over US $2.3 billion in 2021, representing approximately 75% of the total market revenue.
- The Brazilian gaming sector is shifting toward an export-oriented model supported by coordinated efforts from public agencies including Abragames, Brazil Games, and ApexBrasil.
- Public-private initiatives are prioritizing international market access through export missions, business-matching programs, and promotional campaigns.
- Private investment is expected to increase, focusing on scaling emerging opportunities and expanding the international publishing of Brazilian titles.
+1
AbragamesJan 2022
Report149 pages
Brazil Games Industry Report 2022
Brazil has established itself as the preeminent games market in Latin America and the 12th largest globally, generating approximately USD 2.3 billion in 2021. The ecosystem is defined by rapid professionalization and internationalization, evidenced by a 102% increase in active studios since 2018. With over 1,000 companies and a workforce exceeding 12,000 professionals, the industry has transitioned from a historical period of informality to a sophisticated hub for original intellectual property and high-quality external development services. While the Southeast and South regions remain the primary geographic hubs, the sector’s reach is global, with over half of local companies serving international markets, particularly in the United States and Europe.
The industry demonstrates increasing maturity through longer studio lifespans and a shift toward diverse platforms. While mobile and PC development remain dominant, console production grew significantly to 17% of the market by 2021. Beyond entertainment, Brazilian studios maintain a strong presence in educational and corporate gamification. Despite this growth, structural challenges persist, including a lack of formal inclusion policies for underrepresented groups and a "wage war" for senior talent driven by the rise of remote work for foreign firms. Furthermore, the workforce is navigating a transition where 93% of companies now focus on proprietary IP, moving away from a pure service-provider model.
Economic and regulatory hurdles continue to shape the landscape. Federal funding has reached historic lows, forcing a reliance on founder capital and state-level initiatives. Developers face significant "legal insecurity" due to the absence of a specific regulatory category for games and a tax system that treats development hardware as luxury entertainment rather than capital goods. Nevertheless, the resilience of the sector is underscored by a 336% revenue increase in USD since 2015 and the emergence of "unicorns" like Wildlife. The industry remains a vital component of the global value chain, increasingly recognized for its technical proficiency in engines like Unity and its expanding role in emerging technologies such as blockchain and the metaverse.
- Brazil is the 12th largest games market globally and the leader in Latin America, generating approximately USD 2.3 billion in 2021.
- The industry has experienced rapid expansion, with a 102% increase in active studios since 2018 and a 336% revenue increase in USD since 2015.
- The sector is shifting toward original intellectual property, with 93% of companies now focusing on proprietary IP rather than a pure service-provider model.
- The ecosystem comprises over 1,000 companies and 12,000 professionals, with more than half of these businesses exporting services to international markets, primarily in the U.S. and Europe.
- Console production has grown to represent 17% of the market, diversifying a landscape previously dominated by mobile and PC development.
+1
AbragamesJan 2022
Report62 pages
State of Mobile: Brazil 2022
Brazil solidified its position as a global leader in mobile engagement throughout 2021, with users averaging 5.4 hours daily on their devices. This record-breaking activity drove 10.3 billion app downloads and a 22% year-over-year increase in consumer spending, which reached $1.13 billion. While social, communication, and video streaming apps captured 70% of total mobile minutes, the gaming sector emerged as the primary engine for monetization, accounting for more than half of all consumer expenditures. Hypercasual titles led in volume, while 4X Strategy games dominated revenue generation.
The market underwent a profound digital transformation across the finance and retail sectors. Finance app downloads surged by 91% over a two-year period, fueled by a large underbanked population gravitating toward neobanks like Nubank and PicPay. Similarly, shopping app engagement rose 45%, though domestic players faced increasing competition as international publishers secured a 52% share of the local market. This shift toward digital-first services extended to the "rapid delivery" and food sectors, where sessions reached 4.5 billion, and the business category, where users increasingly utilized apps to secure alternative income through gig economy platforms.
Post-pandemic recovery and lifestyle shifts further diversified the mobile landscape. Travel and sports apps saw significant rebounds in downloads and time spent, while the dating sector reached $47 million in consumer spend, marking a 62% increase since 2018. Health and fitness apps also maintained momentum with a 30% growth in downloads compared to pre-pandemic levels. Emerging trends, such as the 45% surge in TikTok usage and the rise of avatar-based social metaverses, indicate a maturing market where short-form video and interactive digital environments are becoming central to the Brazilian mobile experience.
- Brazilian mobile users averaged 5.4 hours of daily device usage in 2021, driving 10.3 billion app downloads and $1.13 billion in consumer spending.
- Gaming is the primary monetization engine in Brazil, accounting for over 50% of total consumer spend, with hypercasual titles leading in volume and 4X Strategy games dominating revenue.
- Finance app downloads surged 91% over two years, driven by a large underbanked population adopting neobanks such as Nubank and PicPay.
- Shopping app engagement grew 45%, though international publishers now control 52% of the local market share.
- The dating sector reached $47 million in consumer spend in 2021, representing a 62% increase since 2018.
+1
data.aiJan 2022
Report18 pages
Key Insights into Brazilian Gamers
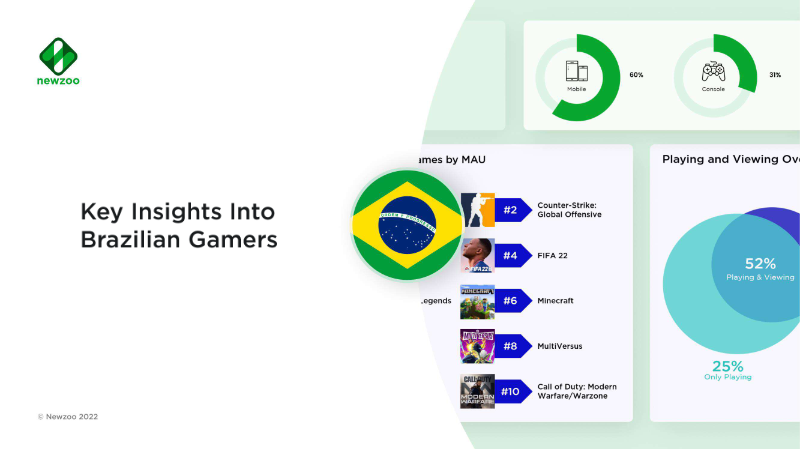
Brazil represents a significant force in the global gaming industry, ranking as the 10th largest market worldwide by revenue and 5th by total player count as of 2022. The region is characterized by high levels of engagement, with 80% of the online population identified as game enthusiasts. This engagement extends beyond play, as 60% of the audience both plays and watches gaming video content, while only 25% play without viewing.
The demographic profile of Brazilian gamers is diverse, though it skews toward younger males. Approximately 51% of players are male and 48% are female, with the 21–35 age bracket forming the largest segment at 43%. Mobile gaming is the dominant platform, utilized by 60% of the gaming population, followed by console and PC at 31% and 30% respectively. Despite the prevalence of mobile, average weekly play times are consistent across platforms, ranging from roughly four and a half to five hours.
Monetization trends indicate a healthy spending culture, with 43% of players classified as payers. The primary drivers for spending include unlocking exclusive playable content and personalizing in-game characters. Popular titles in the region include competitive and social games such as League of Legends, Fortnite, and Roblox.
The findings are based on a survey of 2,063 active internet users aged 10–65 in residential developed areas of Brazil. The methodology utilizes a "Residential Developed Approach," ensuring the data is representative of the connected population within these specific geographic zones. The research was conducted by Newzoo as part of their 2022 Global Games Market Report and Consumer Insights series.
- Brazil is the 10th largest gaming market globally by revenue and 5th by total player count as of 2022.
- Engagement is high, with 80% of the online population identified as game enthusiasts and 60% of players also consuming gaming video content.
- Mobile is the dominant platform, used by 60% of the gaming population, followed by consoles at 31% and PC at 30%.
- The player base is nearly evenly split by gender, with 51% male and 48% female, and the 21–35 age bracket representing the largest segment at 43%.
- 43% of Brazilian gamers are payers, with spending primarily driven by the desire to unlock exclusive content and personalize in-game characters.
NewzooJan 2022