Report1 pages
Wojciech Ozimek: Profile and Expertise
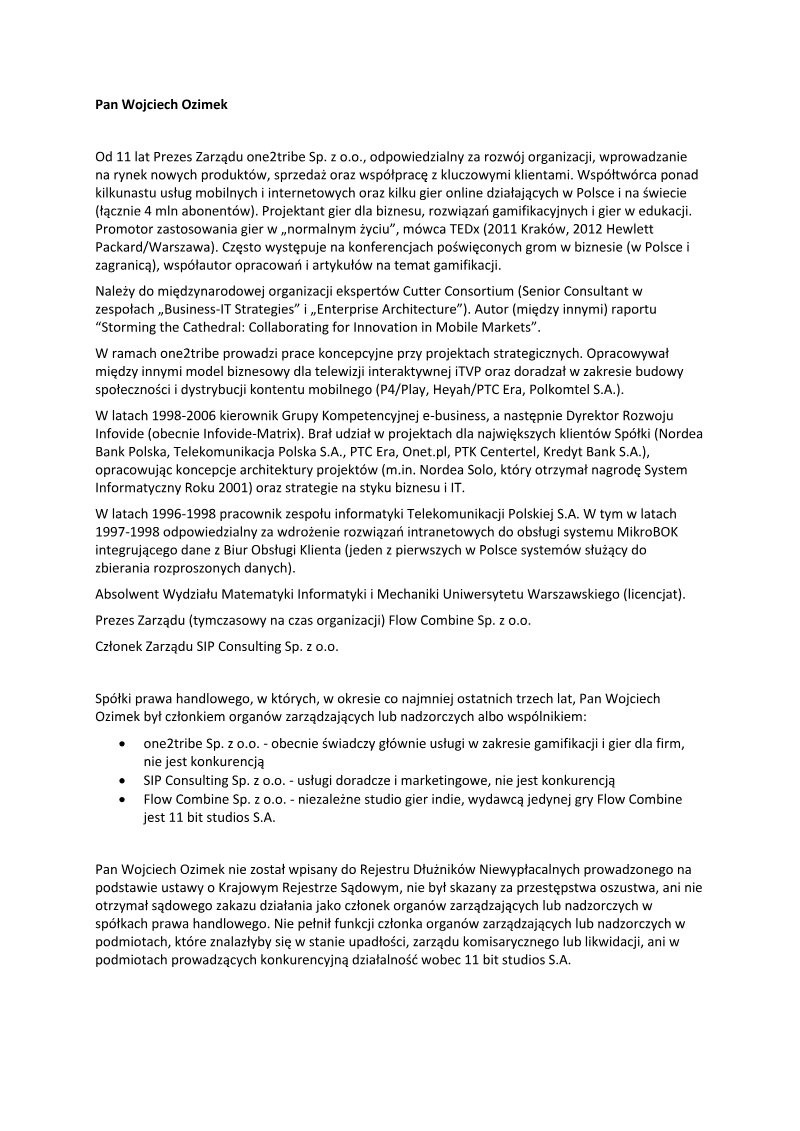
Wojciech Ozimek has led one2tribe Sp. z o.o. for eleven years as CEO, overseeing organizational growth, product launches, sales and key client relationships. Under his direction the company has co‑created more than a dozen mobile and internet services, as well as several online games that collectively attract four million subscribers worldwide. Ozimek’s expertise lies in designing business‑oriented games, gamification solutions and educational titles, positioning him as a proponent of integrating gaming into everyday life. He has spoken at TEDx Kraków (2011) and Hewlett Packard/Warsaw (2012), frequently presenting at business‑gaming conferences in Poland and abroad, and co‑authored articles on gamification.
Ozimek is a senior consultant with the international Cutter Consortium, contributing to “Business‑IT Strategies” and “Enterprise Architecture” teams. He authored the report “Storming the Cathedral: Collaborating for Innovation in Mobile Markets.” Within one2tribe he has led concept development for strategic projects, including a business model for interactive TV (iTVP) and advisory work on mobile content distribution for P4/Play, Heyah/PTC Era, and Polkomtel S.A. Prior to one2tribe, he managed the e‑business competency group and later served as Director of Development at Infovide (now Infovide‑Matrix), delivering architecture concepts for major clients such as Nordea Bank Polska, Telekomunikacja Polska S.A., PTC Era, Onet.pl, PTK Centertel and Kredyt Bank S.A. His notable project Nordea Solo earned the 2001 System Informatyczny Roku award.
Ozimek’s earlier career included a role in the IT team at Telekomunikacja Polska S.A., where he implemented intranet solutions for the MikroBOK system, one of Poland’s first distributed data collection platforms. He holds a bachelor’s degree in Mathematics, Computer Science and Mechanics from the University of Warsaw.
In recent years he has served on the boards of Flow Combine Sp. z o.o., SIP Consulting Sp. z o.o., and temporarily on the board of Flow Combine, a studio that published its sole title through 11 Bit Studios S.A. No records of insolvency, fraud convictions or court‑ordered prohibitions exist for Ozimek, and he has not held executive roles in companies undergoing bankruptcy or competing with 11 Bit Studios.
- Wojciech Ozimek has served as CEO of one2tribe for 11 years, overseeing the development of online games and services that have reached four million subscribers globally.
- His professional focus centers on gamification and business-oriented game design, supported by his role as a senior consultant for the Cutter Consortium’s Business-IT Strategies and Enterprise Architecture teams.
- Prior to one2tribe, Ozimek held leadership roles at Infovide, where he directed development and architecture for major clients including Nordea Bank Polska, Telekomunikacja Polska S.A., and Onet.pl.
- He led strategic advisory projects for telecommunications firms such as P4/Play, Heyah/PTC Era, and Polkomtel S.A., and developed business models for interactive TV (iTVP).
- His technical background includes a bachelor’s degree in Mathematics, Computer Science, and Mechanics from the University of Warsaw and early experience implementing distributed data collection platforms like MikroBOK.
+1
11 bit studios
Report2 pages
Q1 2021/22 Sales: 33.7 M€
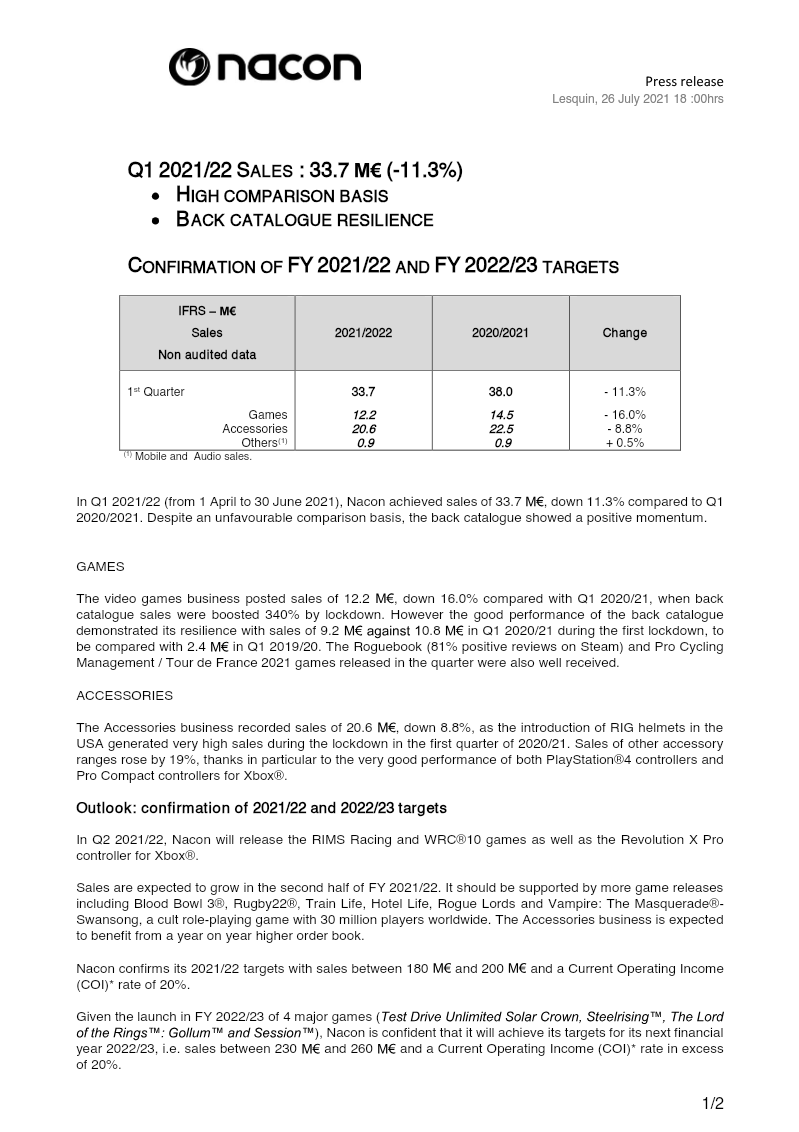
Nacon reported first‑quarter sales of €33.7 million for the period 1 April to 30 June 2021, a decline of 11.3 % versus the same quarter in 2020‑21. The drop reflects an unfavorable comparison basis, yet back‑catalogue performance remained resilient with €9.2 million in sales compared to €10.8 million during the initial lockdown, and a substantial 340 % lift in back‑catalogue revenue that quarter. Game sales fell 16 % to €12.2 million, while accessories declined 8.8 % to €20.6 million; the accessories segment benefited from a 19 % rise in non‑RIG helmet ranges, notably PlayStation 4 and Xbox® controllers. Mobile and audio sales remained flat at €0.9 million.
The company confirmed its 2021‑22 and 2022‑23 targets, projecting total annual sales of €180–200 million with a current operating income (COI) margin of 20 %. For FY 2022‑23, Nacon aims for €230–260 million in sales and a COI margin above 20 %, supported by four major game launches (Test Drive Unlimited Solar Crown, Steelrising™, The Lord of the Rings™: Gollum™, and Session™). Second‑half growth is expected from additional titles such as Blood Bowl 3®, Rugby22®, Train Life, Hotel Life, Rogue Lords, and Vampire: The Masquerade®‑Swansong. Nacon’s integrated structure—comprising 11 development studios, publishing of AA titles, and premium hardware design—underpins its strategy to leverage synergies across a global distribution network covering 100 countries. The company, listed on Euronext Paris, employs over 600 staff and operates through 16 subsidiaries.
- Nacon reported Q1 2021/22 sales of €33.7 million, representing an 11.3% decline compared to the same period in the previous fiscal year.
- The company maintained its financial guidance, targeting €180–200 million in sales for FY 2021-22 and €230–260 million for FY 2022-23, both with a current operating income margin of at least 20%.
- Segment performance saw game sales fall 16% to €12.2 million and accessories decline 8.8% to €20.6 million, though non-RIG helmet ranges and console controllers grew by 19%.
- Back-catalogue sales reached €9.2 million, showing resilience despite a difficult comparison against the previous year's lockdown-driven 340% revenue surge.
- Future growth is anchored by four major upcoming releases: Test Drive Unlimited Solar Crown, Steelrising, The Lord of the Rings: Gollum, and Session.
+3
Nacon
Report4 pages
Factbook: Third Quarter of Fiscal Year Ending March 31, 2026
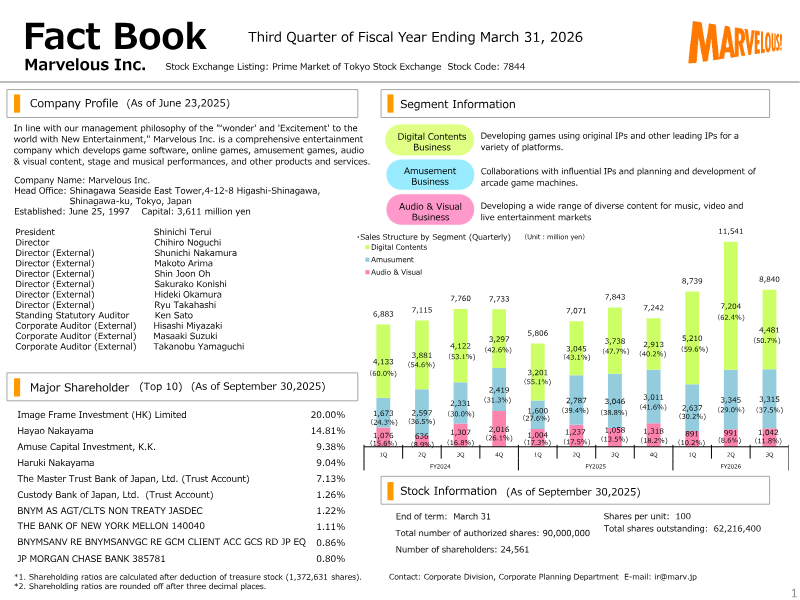
Marvelous Inc., listed on Tokyo’s Prime Market, released its third‑quarter financial results for the fiscal year ending March 31 2026. The company’s core business spans digital content, amusement, audio‑visual production and live entertainment, with a focus on original IPs and collaborations. Revenue rose to ¥29.1 billion in Q3, up 4.5% from the prior quarter and 10.6% year‑on‑year, driven primarily by digital content sales of ¥7.2 billion and amusement revenue of ¥3.0 billion. Gross operating profit reached ¥10.4 billion, a 12% increase over Q2 and a 9% rise versus the same period last year, reflecting improved cost control in production and marketing.
Operating profit fell to ¥1.8 billion, a 12% decline from Q2, largely due to higher selling‑general‑administrative expenses of ¥8.6 billion compared with ¥7.9 billion in Q2. Net income attributable to shareholders was ¥1.5 billion, down 18% from Q2, with a net profit margin of 5.3%. The company’s cash‑flow position remained solid, with operating cash flow of ¥2.8 billion and a cash‑equivalent balance of ¥16.4 billion at quarter end.
Geographically, the report covers Japan and overseas markets where Marvelous operates. The data derive from consolidated financial statements prepared under Japanese GAAP, covering all subsidiaries and affiliates. Key metrics such as return on equity (13.7%) and asset turnover (0.82) indicate healthy profitability, while dividend payout remained at 52% of net income. Overall, the quarter shows revenue growth but margin pressure from higher operating costs, prompting management to focus on cost efficiency and portfolio diversification.
- Marvelous Inc. reported Q3 revenue of ¥29.1 billion, representing a 10.6% year-on-year increase driven by digital content sales of ¥7.2 billion and amusement revenue of ¥3.0 billion.
- Operating profit declined 12% quarter-on-quarter to ¥1.8 billion, primarily due to an increase in selling, general, and administrative expenses from ¥7.9 billion in Q2 to ¥8.6 billion.
- Gross operating profit rose 9% year-on-year to ¥10.4 billion, reflecting improved cost control in production and marketing despite the overall pressure on net margins.
- Net income attributable to shareholders fell 18% from the previous quarter to ¥1.5 billion, resulting in a net profit margin of 5.3%.
- The company maintains a solid financial position with ¥16.4 billion in cash equivalents, an operating cash flow of ¥2.8 billion, and a return on equity of 13.7%.
+3
Marvelous
Report64 pages
Annual Report 2005
Printed in Japan This annual report is printed on recycled paper. 2004 2005 2004 2005 2004 2005 2004 2005 2004 2005 2004 2005 Total Games (Offline) Games (Online) Mobile Phone Content Publication Others Financial Highlights ________________________________________ 1 Disclaimer Regarding Forward-Looking Statements To Our Shareholders ____________________________________ 2 Statements in this annual report with respect to the current plans, estimates, stra...
- Square Enix's net income significantly increased to ¥14,520 million in FY2005, up from ¥4,355 million in FY2004, and ¥2,296 million in FY2003.
- Total consolidated net sales for Square Enix reached ¥73,865 million in FY2005, an increase from ¥63,202 million in FY2004 and ¥21,877 million in FY2003.
- The 'Games (Offline)' segment was the largest contributor to net sales in FY2005 at ¥41,944 million, followed by 'Games (Online)' at ¥13,853 million and 'Publication' at ¥10,859 million.
- Notes and accounts receivable decreased by ¥4,375 million to ¥7,670 million in FY2005, primarily because no "million-seller" titles were released during the fiscal year.
- Intangible assets decreased by ¥1,454 million to ¥6,096 million in FY2005, mainly due to ¥1,236 million in goodwill depreciation from the UIEvolution Inc. purchase in the previous fiscal year.
+3
Square Enix

Report68 pages
Annual Report 2006
SQUARE ENIX CO., LTD, TH SQUARCCNIX www.square-enix.com/ ANNUAL REPORT 2006 Net Sales Ratio Net Sales (Billions of yen) Games (Offline) 36.9% 2005 Net Sales Ratio Net Sales (Billions of yen) Games (Online) 12.6% 2005 Net Sales Ratio Net Sales (Billions of yen) Mobile Phone Content 4.1% 2005 Net Sales Ratio Net Sales (Billions of yen) Net Sales Ratio Net Sales (Billions of yen) Net Sales Ratio Net Sales (Billions of yen) Contents ...
- Square Enix acquired 93.7% of TAITO CORPORATION in September 2005 via a takeover bid, subsequently merging it with SQEX, Inc. to make Taito a wholly owned subsidiary.
- The company's content production account decreased by ¥8,197 million to ¥7,312 million as of March 31, 2006, primarily due to expensing production costs for major titles like "FINAL FANTASY XII" and "KINGDOM HEARTS II" upon their domestic release.
- Deferred tax assets significantly increased as of March 31, 2006, with current deferred tax assets rising by ¥4,437 million to ¥7,877 million and non-current deferred tax assets increasing by ¥4,754 million to ¥6,523 million, partly due to tax differences from the Taito acquisition.
- Square Enix is expanding its business beyond growing existing communities by developing new ones and actively seeking to approach outside communities, providing value-added services to third parties like EZ Game Street! and On Demand TV, and forming joint ventures such as with Xavel, Inc.
- The company reported net income of ¥14,932 million for the year ended March 31, 2006, a decrease from ¥17,076 million in the previous year, despite an increase in income before income taxes to ¥25,556 million from ¥8,990 million.
+3
Square Enix
Report80 pages
Annual Report 2015
FUN AND OUR MISSION “Dreams, Fun and Inspiration” are the Engine of Happiness. Through our entertainment products and services, BANDAI NAMCO will continue to provide “Dreams, Fun and Inspiration” to people around the world, based on our boundless creativity and enthusiasm. As an entertainment leader across the ages, exploring new areas and heights in entertainment.
- Bandai Namco's vision is to be the "Leading Innovator in Global Entertainment" by exploring new areas and heights in entertainment, aiming to expand its business in Asia and achieve growth for the next 10-20 years.
- The company achieved solid results in both operational and quantitative areas under its previous Mid-term Plan, driven by the IP axis strategy, and plans to continue this strategy.
- Bandai Namco is entering a period where digital networks will be integrated into real life, leading to the creation of the Network Entertainment SBU to develop content and businesses for both digital and real networks.
- The Visual and Music Production SBU focuses on entertaining people globally through IP production, with successful examples like "Love Live! School Idol project" and "Mobile Suit Gundam UC (Unicorn) episode 7: Over the Rainbow" contributing to performance.
- The company aims for ¥60.0 billion in sales in Asia (including exports) by FY2018.3, expanding popular IPs like "Yo-kai Watch DX" into established brands in the region.
+3
Bandai Namco
Report100 pages
Integrated Report 2018
I N T E G R AT E D R E P O R T 2 0 1 8 develops entertainment-related toys, network content, home video games, amusement machines, amusement facilities, and visual and music content. Under the Mid-term Plan, which was launched in April 2018, the Group aims to achieve “CHANGE” to progress to the next stage, with a Mid-term Vision of CHANGE for the NEXT: Empower, Gain Momentum, and Accelerate Evolution. “Dreams, Fun and Inspiration”are the Engine of Happiness.
- BANDAI NAMCO Group aims for ¥750 billion in net sales and ¥75 billion in operating profit by March 31, 2021, with an operating profit margin and ROE of 10% or more.
- The Group's business is segmented into Toys and Hobby, Network Entertainment, and Visual and Music Production, with Network Entertainment encompassing network content, home video games, arcade machines, and amusement facilities.
- In FY2018.3, amusement facilities generated ¥64.2 billion in sales from 1,870 facilities (293 directly managed, 1,563 revenue-sharing), while amusement machines generated ¥28.2 billion.
- BANDAI NAMCO Group was ranked among the top global app market publishers in 2017 based on revenue for iOS and Google Play, with Tencent being the top publisher.
- The Group emphasizes work-life balance through systems like extended childcare leave, flextime, shorter working hours, and support for family caregiving, exceeding legal requirements.
+3
Bandai Namco
Report32 pages
Bandai Namco Group Fact Book 2020
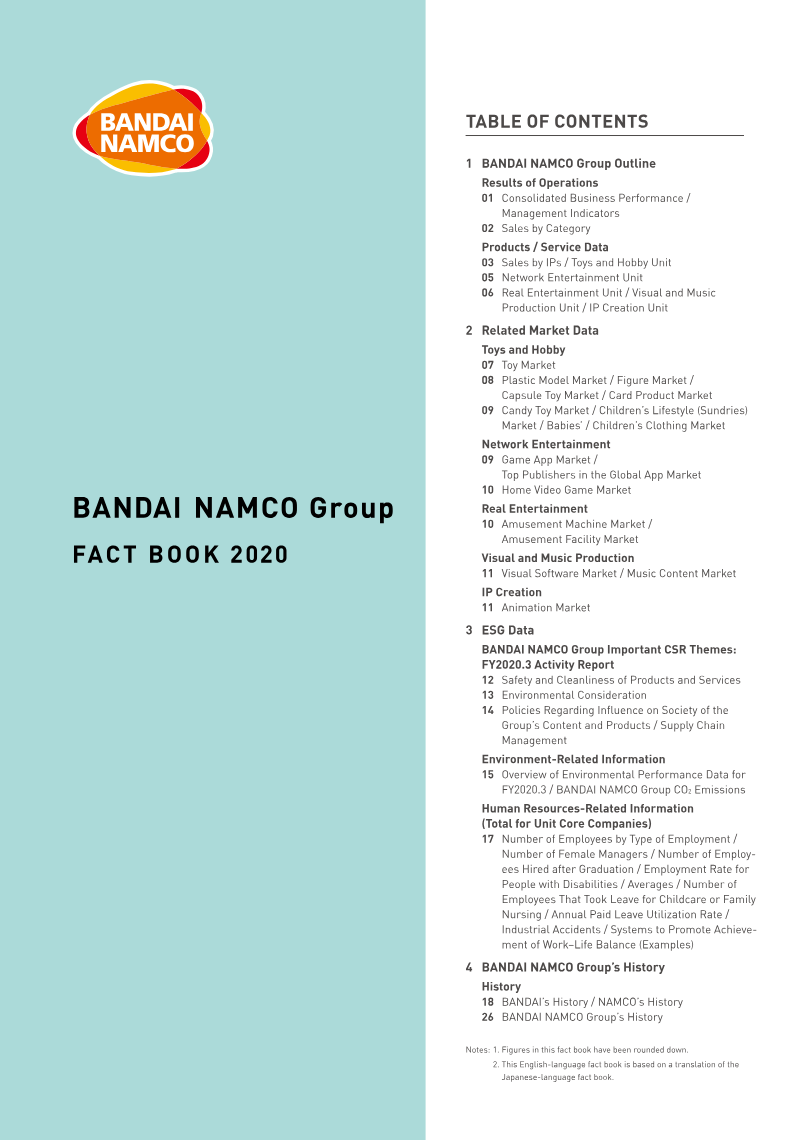
01 Consolidated Business Performance / 03 Sales by IPs / Toys and Hobby Unit 05 Network Entertainment Unit 06 Real Entertainment Unit / Visual and Music Production Unit / IP Creation Unit 08 Plastic Model Market / Figure Market / Capsule Toy Market / Card Product Market 09 Candy Toy Market / Children’s Lifestyle (Sundries) Market / Babies’ / Children’s Clothing Market Top Publishers in the Global App Market BANDAI NAMCO Group 10 Home Video Game Market 10 Amusement Machine Market /...
- Bandai Namco Group's Toys and Hobby Unit has achieved significant cumulative shipment volumes for key product lines as of March 2020: Gundam plastic models (696.73 million units), Ultraman soft figures (98.77 million units), Super Sentai series robots (30.45 million units), and Digital Monsters (14.15 million units).
- The Network Entertainment Unit's sales for network content decreased from ¥211.1 billion in FY2019.3 to ¥200.9 billion in FY2020.3, while home video game sales also slightly declined from ¥102.1 billion to ¥99.0 billion in the same period.
- As of March 2020, Bandai Namco Rights Marketing Inc. reported a cumulative total of 492,924,783 fee-based viewings for on-demand animation delivery since October 2002, with 4,508 productions (71,739 episodes) available.
- Bandai Namco Group was formed in September 2005 through the management integration of BANDAI and NAMCO, establishing NAMCO BANDAI Holdings Inc.
- The Japanese figure market reached ¥30.5 billion in FY2019, while the digital card market, where Bandai holds a significant share (60.8% in FY2019), was ¥24.7 billion in FY2019.
+3
Bandai Namco
Report16 pages
Bandai Namco Group Fact Book 2021
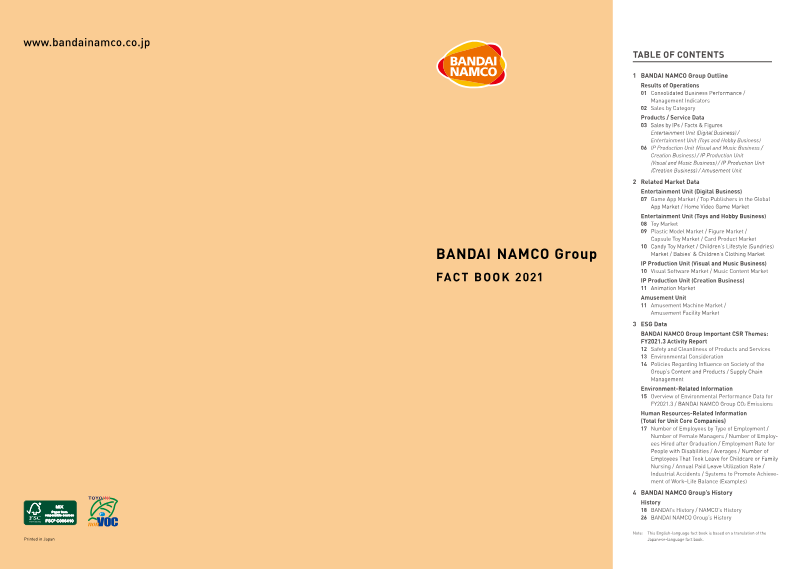
1 BANDAI NAMCO Group Outline 01 Consolidated Business Performance / 03 Sales by IPs / Facts & Figures Entertainment Unit (Digital Business) / Entertainment Unit (Toys and Hobby Business) 06 IP Production Unit (Visual and Music Business / Creation Business) / IP Production Unit (Visual and Music Business) / IP Production Unit (Creation Business) / Amusement Unit Entertainment Unit (Digital Business) 07 Game App Market / Top Publishers in the Global App Market / Home Video Game Market ...
- Bandai Namco Group's top-performing IP by sales (worldwide) in FY2021.3 was DRAGON BALL series at ¥127.4 billion, followed by Mobile Suit Gundam series at ¥95.0 billion and ONE PIECE at ¥38.0 billion.
- Network content sales (digital business) grew from ¥200.9 billion in FY2020.3 to ¥207.7 billion in FY2021.3, while home video game sales increased from ¥99.0 billion to ¥118.1 billion in the same period.
- Amusement unit sales declined significantly from FY2020.3 to FY2021.3, with amusement machines dropping from ¥27.1 billion to ¥16.7 billion and amusement facilities from ¥64.7 billion to ¥47.1 billion.
- Bandai Namco Group was ranked 6th globally among app market publishers in 2020, behind Nintendo, Playrix Ireland, Koei Tecmo, Activision Blizzard, and Zynga.
- The company has a strong history of product longevity, with cumulative shipments including 2.65 billion candy toys (since 1995), 101.87 million Ultraman soft figures (since 1983), and 30.89 million Super Sentai series robots (since 1979).
+3
Bandai Namco
Report16 pages
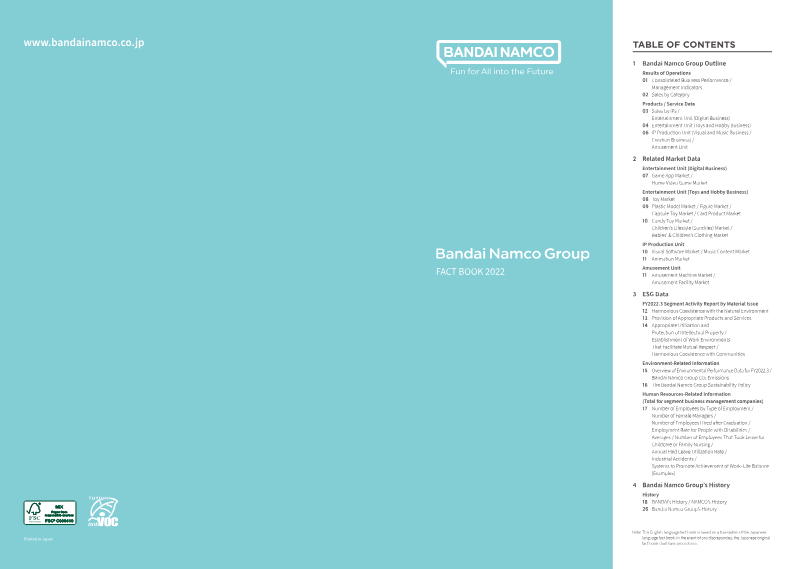
Bandai Namco Group Fact Book 2022
www.bandainamco.co.jp TABLE OF CONTENTS 1 Bandai Namco Group Outline 01 Consolidated Business Performance / Entertainment Unit (Digital Business) 04 Entertainment Unit (Toys and Hobby Business) 06 IP Production Unit (Visual and Music Business / Entertainment Unit (Digital Business) Entertainment Unit (Toys and Hobby Business) 09 Plastic Model Market / Figure Market / Capsule Toy Market / Card Product Market Children’s Lifestyle (Sundries) M...
- Bandai Namco Group's top-performing IPs by sales in FY2022.3 were DRAGON BALL series (¥127.6 billion), Mobile Suit Gundam series (¥101.7 billion), and ONE PIECE (¥44.1 billion).
- The Digital Business segment saw a decrease in network content sales from ¥207.7 billion in FY2021.3 to ¥185.5 billion in FY2022.3, but home video game sales increased significantly from ¥118.1 billion to ¥174.4 billion in the same period.
- As of March 2022, Bandai Namco Entertainment Inc. had 34 game app titles each on Google Play and the App Store, and 5 social media titles in Japan.
- The Toys and Hobby Business unit has achieved substantial cumulative shipment volumes for key products, including 2,699.59 million candy toys (since 1995) and 104.93 million Ultraman soft figures (since 1983).
- The Amusement Unit's sales increased from ¥63.8 billion in FY2021.3 to ¥82.3 billion in FY2022.3, with amusement facilities contributing the majority of sales (¥61.5 billion in FY2022.3).
+3
Bandai Namco
Report16 pages
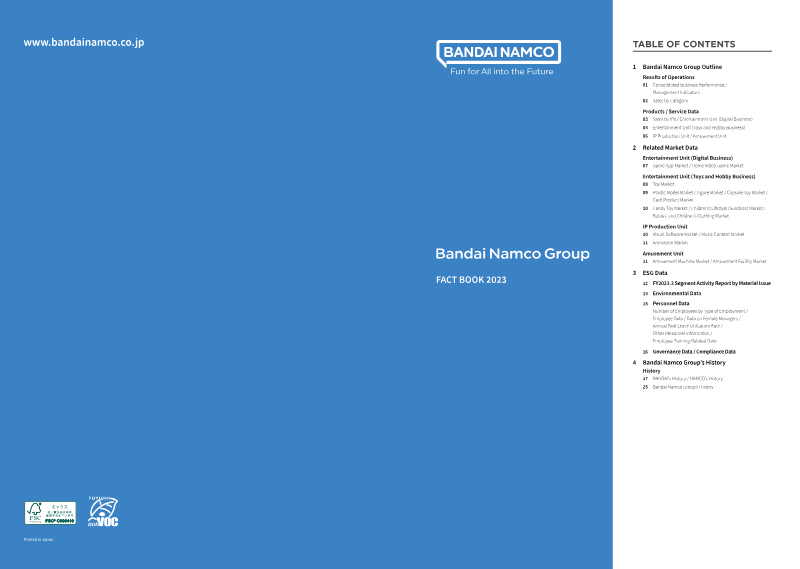
Bandai Namco Group Fact Book 2023
www.bandainamco.co.jp TABLE OF CONTENTS 01 Consolidated Business Performance / 03 Sales by IPs / Entertainment Unit (Digital Business) 04 Entertainment Unit (Toys and Hobby Business) 06 IP Production Unit / Amusement Unit Entertainment Unit (Digital Business) 07 Game App Market / Home Video Game Market Entertainment Unit (Toys and Hobby Business) 09 Plastic Model Market / Figure Market / Capsule Toy Market / 10 Candy Toy Market / Children’s Lifestyle (Sundries) Mar...
- Bandai Namco Group's history includes the independent founding of Bandaiya in 1950 (later BANDAI) and Nakamura Manufacturing Ltd. in 1955 (later NAMCO), with significant milestones like PAC-MAN's introduction in 1980 and Tamagotchi's launch in 1996.
- The Gundam series is a major IP for Bandai Namco, with cumulative plastic model shipments reaching 761.11 million units by March 2023, including 577.05 million Real series and 1.27 million SD series units.
- Bandai Namco's Toys and Hobby Business saw significant sales from the Gundam series (¥60.5 billion in FY2023.3, up from ¥44.2 billion in FY2022.3) and KAMEN RIDER series (¥23.0 billion in FY2023.3, up from ¥22.8 billion in FY2022.3).
- The company's home video game titles have achieved substantial cumulative shipments, including the TEKKEN series (55.00 million units by March 2023) and the Super Robot Wars series (20.24 million units by March 2023).
- Bandai Namco is actively engaged in ESG initiatives, including sustainability activities utilizing IP to reduce environmental burdens (e.g., clothing donations for upcycling, plastic recycling PR with the Ministry of the Environment) and regional contribution activities like the Gundam Educational Program.
+3
Bandai Namco
Report10 pages
Q4 2025 Investor Presentation
The Q4 2025 investor presentation details a period of record financial performance for the company, characterized by significant revenue growth and successful strategic integration. The primary thesis centers on the company’s transformative year, highlighted by the successful consolidation of Plarium and a shift toward a midcore gaming focus. For the fourth quarter of 2025, the company achieved net sales of SEK 3,123 million, representing an 8% organic growth rate and a 108% increase in constant currency year-over-year. Adjusted EBITDA reached SEK 717 million, maintaining a 23% margin, while unlevered free cash flow totaled SEK 878 million with a 66% conversion rate.
The scope of the report covers the global gaming operations of the company throughout the 2025 fiscal year, with specific emphasis on the fourth quarter. Key operational findings indicate that user acquisition (UA) spending rose to 38% of revenue in Q4, a 98% year-over-year increase in constant currency, largely driven by the integration of Plarium and the scaling of casual and racing franchises. Revenue streams showed a notable shift, with direct-to-consumer contributions rising 600 basis points to 32% of the total. Franchise performance was bolstered by strong results in the racing and word game segments, which saw year-over-year growth of 43% and 28%, respectively.
Methodologically, the financial data is presented on a reported basis, with constant currency adjustments applied to isolate organic growth trends. The report incorporates full-year 2025 figures and highlights the impact of the Plarium acquisition, which was integrated into the group starting in February 2025. Looking ahead, the company concludes the period with a stable leverage ratio and a new organizational structure, positioning itself for continued midcore expansion and the potential public offering of its PlaySimple division.
- The company achieved Q4 2025 net sales of SEK 3,123 million, marking 8% organic growth and a 108% year-over-year increase in constant currency.
- Adjusted EBITDA for Q4 2025 reached SEK 717 million with a 23% margin, supported by an unlevered free cash flow of SEK 878 million.
- User acquisition spending surged to 38% of revenue in Q4, representing a 98% year-over-year increase driven by the integration of Plarium and scaling of casual and racing franchises.
- Direct-to-consumer revenue contributions grew by 600 basis points to reach 32% of total Q4 revenue.
- Key franchise segments showed strong momentum, with racing games growing 43% and word games growing 28% year-over-year.
+5
Modern Times Group

Report17 pages
Adjust Guide to Deep Linking
This technical guide outlines the strategic importance and functional mechanics of deep linking within the mobile app ecosystem. The primary thesis is that deep links are essential tools for streamlining the user experience, reducing friction, and driving higher conversion rates compared to standard mobile web interfaces. By directing users to specific in-app content rather than generic homepages, marketers can significantly improve retention and re-engagement through targeted campaigns across email, social media, and SMS.
The scope of the analysis covers the technical distinctions between three primary types of links: default, deferred, and contextual. Default deep links function only when an app is already installed, while deferred deep links—facilitated by specialized SDK integrations—route non-users to the appropriate app store before delivering them to the intended internal page upon installation. The guide also examines platform-specific solutions like Apple’s Universal Links, noting their ability to prevent error messages while highlighting limitations regarding attribution data and support within major apps like Facebook.
Key data points emphasize the commercial impact of native app environments, noting that consumers purchase at three times the rate of the mobile web. Furthermore, with 70% of emails opened on mobile devices, the integration of deep links into owned media channels is presented as a critical driver of revenue. The conclusion suggests that as digital interactions expand into voice, television, and automotive platforms, deep linking and cross-device tracking will remain the foundational technology for maintaining a cohesive and measurable mobile marketing strategy.
- Mobile app users purchase at three times the rate of those using mobile web interfaces, making deep linking a primary driver of conversion.
- Integrating deep links into owned media channels is critical for revenue, particularly as 70% of all emails are currently opened on mobile devices.
- Deferred deep links are essential for acquisition, as they route new users through the app store installation process before landing them on the specific content they originally clicked.
- Default deep links are limited to users who already have the app installed, whereas deferred deep links utilize SDK integrations to bridge the gap for non-users.
- Apple’s Universal Links prevent common error messages but face limitations regarding attribution data and compatibility with major platforms like Facebook.
+1
Adjust
Report94 pages
Mobile Market Landscape 2026
The mobile ecosystem is undergoing a fundamental structural transformation as the industry shifts from a volume-based growth model to one defined by monetization efficiency and technological integration. By 2026, the market has reached a state of saturation where total app releases have surged by 25% year-over-year, yet only 10% of new titles successfully secure meaningful user attention. A pivotal milestone occurred in late 2025 when non-gaming applications surpassed gaming in total revenue for the first time, largely propelled by the explosive 273% revenue growth in generative AI and the strategic expansion of utility-based tools.
Within the gaming sector, traditional genres such as Casino and RPG have faced stagnation, forcing publishers to adopt hybridization strategies that blend deeper monetization mechanics into previously hypercasual titles. This pivot has yielded significant results, with hypercasual revenue increasing by approximately 80% as developers move toward puzzle and simulation subgenres. Meanwhile, midcore gaming revenue has plateaued at $33–34 billion, prompting a reliance on intensified LiveOps and direct-to-consumer strategies. Across the broader app landscape, the integration of generative AI into creative assets has become standard, with over half of top-grossing games utilizing these tools to scale production, despite ongoing concerns regarding creative monotony.
Geographically, growth patterns are diverging as emerging markets like Indonesia continue to drive massive download volumes, while mature Western markets focus on maximizing revenue per user. The utility and social segments are similarly prioritizing premium subscription models to combat plateauing download numbers. While tools such as antivirus and cloud storage are seeing a resurgence in demand, the industry faces a broader challenge in maintaining long-term retention. Ultimately, the market is transitioning away from hypergrowth toward a sustainable, mature phase characterized by subscription-driven monetization and the strategic application of AI to optimize both user experience and operational efficiency.
- Non-gaming applications surpassed gaming in total revenue for the first time in late 2025, driven by a 273% revenue surge in generative AI and utility-based tools.
- The mobile market has reached saturation, with a 25% year-over-year increase in app releases while only 10% of new titles successfully capture meaningful user attention.
- Hypercasual gaming revenue grew by approximately 80% as developers pivoted toward hybridization, blending deeper monetization mechanics into puzzle and simulation subgenres.
- Midcore gaming revenue has plateaued at $33–34 billion, forcing publishers to rely on intensified LiveOps and direct-to-consumer strategies to maintain performance.
- Over 50% of top-grossing games now utilize generative AI to scale production of creative assets, despite industry concerns regarding potential creative monotony.
+3
AppMagicFeb 2026
Report18 pages
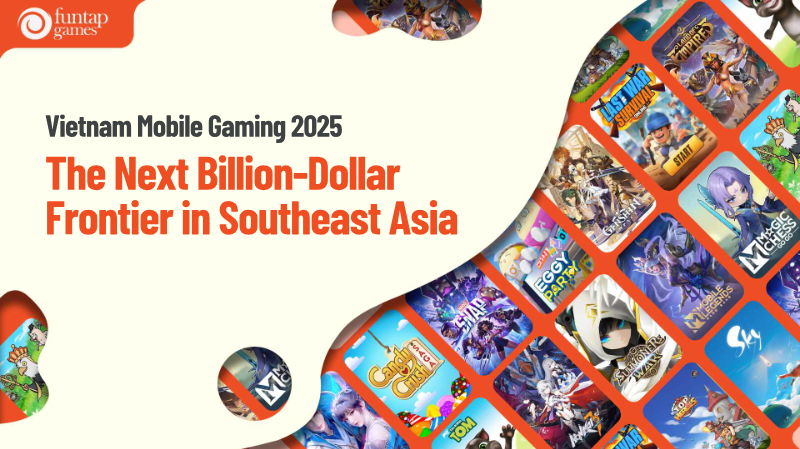
Vietnam Mobile Gaming 2025: The Next Billion-Dollar Frontier in Southeast Asia
The report argues that Vietnam’s mobile gaming sector will reach a billion‑dollar valuation by 2025, driven by an expanding user base and high spending per download. In 2023, 1.1 billion mobile users and 900 million mid‑core players generated gross revenue of approximately US$1.3 billion, with a compound annual growth rate of 9.8 % across all platforms. The analysis attributes this surge to rapid mobile penetration, widespread 5G coverage (average speed 75.7 Mbps), and a growing banking‑linked payment ecosystem that facilitates in‑app purchases.
A key finding is the regulatory shift that began in 2025, when Apple introduced a mandatory license field and the Vietnamese government revoked 1,081 unlicensed titles. This crackdown reduced total downloads by 13.7 % but created a more favorable environment for compliant mid‑core games, which now dominate the market. The report’s methodology involved surveying 250 representative titles with significant download volumes, measuring D1 and D7 retention, playtime, and revenue. Data were cross‑validated with internal tools and third‑party analytics to correct discrepancies common in the local market.
Geographically, the study focuses on Vietnam but benchmarks against other Southeast Asian markets. It notes that while daily playtime is rising across the region, Vietnam’s revenue per download exceeds that of the Philippines by at least 28 %. The report concludes that early licensing and a focus on social, competitive, and narrative‑rich mid‑core experiences—particularly 4X strategy, MOBA, squad RPG, MMORPG, and battle royale genres—will be critical for publishers seeking sustainable growth in the Vietnamese market.
- Vietnam's mobile gaming market is projected to reach a billion-dollar valuation by 2025, supported by a 9.8% compound annual growth rate.
- A 2025 regulatory crackdown resulted in the removal of 1,081 unlicensed titles, leading to a 13.7% decline in total downloads but fostering a more stable environment for compliant mid-core games.
- Vietnam demonstrates strong monetization potential, with revenue per download exceeding that of the Philippines by at least 28%.
- Market growth is underpinned by robust infrastructure, including widespread 5G coverage with average speeds of 75.7 Mbps and an expanding banking-linked payment ecosystem.
- In 2023, the market supported 1.1 billion mobile users and 900 million mid-core players, generating approximately US$1.3 billion in gross revenue.
+4
InvestGameFeb 2026
Report7 pages
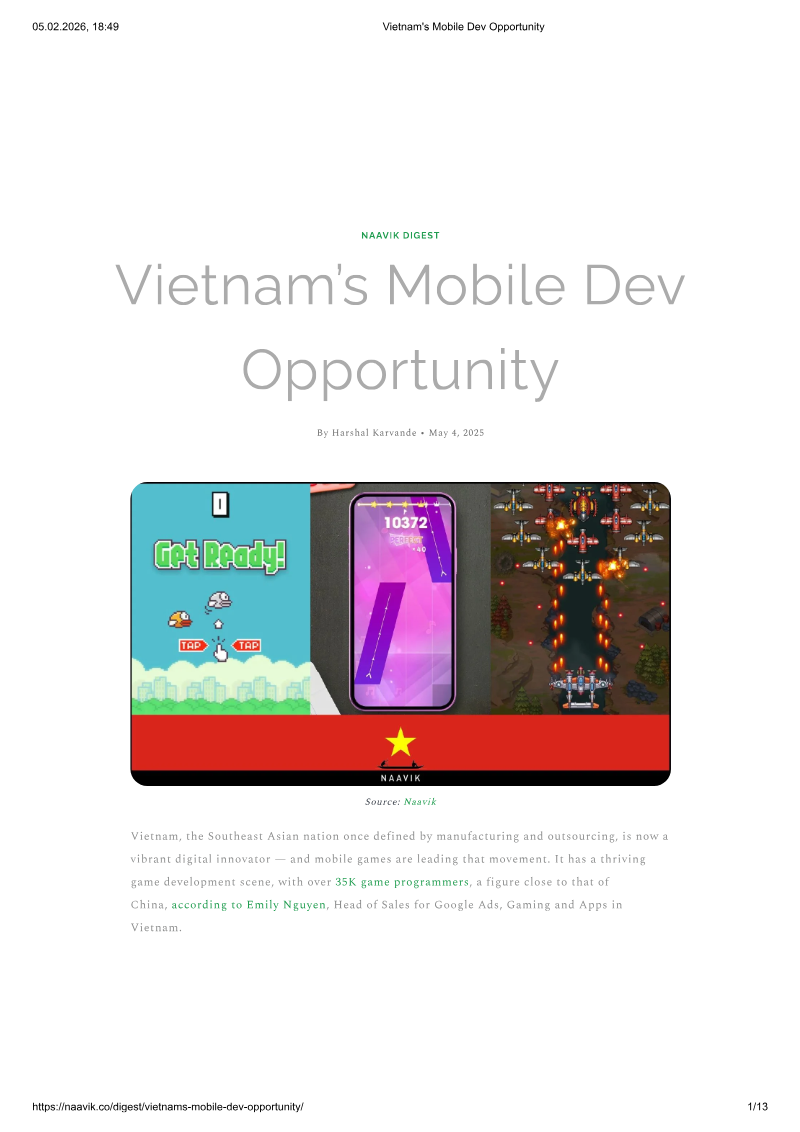
Vietnam's Mobile Dev Opportunity
Vietnam’s mobile game sector has evolved from a consumer‑centric market into a burgeoning production hub, driven by a skilled talent pool forged through outsourcing, stringent regulatory frameworks that forced local publishing entities to emerge, and the explosive rise of mobile gaming. The country now hosts over 35 000 game programmers—comparable to China’s workforce—and more than 300 active mobile publishers headquartered in Vietnam. In 2024, five Vietnamese studios ranked among the world’s top 25 publishers by downloads, contributing nearly 2.4 billion downloads and $133 million in revenue—a 67 % increase in downloads and an 82 % rise in earnings since 2020. Key titles such as Car Race, Wood Nuts & Bolts Puzzle, and Hair Salon: Beauty Salon Game illustrate the domestic IP pipeline, while globally recognized titles like Sky Garden: Farming Paradise, Magic Tiles 3, and Axie Infinity showcase the country’s capacity for high‑impact releases.
The transformation accelerated after 2013 when Vietnamese solo developer Nguyen Ha Dong’s Flappy Bird achieved worldwide chart dominance, proving that local talent could produce globally successful mobile games with limited resources. This success spurred a wave of small studios and startups, many of which transitioned from outsourcing or publishing roles to independent IP creation. Vietnam’s high smartphone penetration (84 %) and a youthful, digitally native demographic further underpin market growth.
Regulatory challenges remain: stricter limits on gaming time for minors, mandatory Ministry of Information and Communications approvals, and content censorship can constrain creative expression and international appeal. Future success will hinge on navigating the shift from hypercasual to more complex casual and social mobile games while adapting to evolving regulatory constraints. Despite these hurdles, Vietnam’s established talent base, rapid growth trajectory, and increasing foreign investment position it as a rising contender for global mobile game leadership over the next decade.
- Vietnam has emerged as a major global mobile development hub with over 35,000 game programmers and more than 300 active local publishers.
- In 2024, five Vietnamese studios ranked among the world’s top 25 publishers, generating 2.4 billion downloads and $133 million in revenue.
- Since 2020, the sector has experienced significant growth, marked by a 67% increase in downloads and an 82% rise in earnings.
- The industry’s transition from outsourcing to independent IP creation was catalyzed by the 2013 global success of Flappy Bird, which proved that local talent could achieve international chart dominance.
- Domestic market strength is supported by a digitally native population and an 84% smartphone penetration rate.
+2
NaavikFeb 2026
Report82 pages
Vietnam Gaming Outlook 2026: Building Sustainable Growth
Vietnam’s mobile gaming landscape is rapidly evolving from a download‑centric, ad‑driven model to a hybrid ecosystem that prioritizes in‑app purchases (IAP) and subscription revenue. In 2024, the country led global Google Play downloads with 6.1 billion installs yet generated only about $430 million, underscoring the profitability ceiling of pure advertising. Rising acquisition costs, privacy‑driven signal loss, and a plateauing average revenue per user (ARPU) have forced studios to adopt IAP‑first, hybrid casual titles that deliver deeper engagement and predictable cash flows. Global IAP and subscription revenue reached $150 billion in 2025, up 13%, while Vietnam’s IAP growth surged 65 %, positioning hybrids as the default blueprint for sustainable growth by 2026.
The transition hinges on data‑centric monetization strategies. AI‑driven programmatic advertising and hybrid supply‑side platforms help studios navigate privacy constraints, while sophisticated IAP systems require clean player‑behavior analytics and structured measurement frameworks. Localized pricing—using purchasing power parity tiers, local currency endings, and one‑tap tokenised payments—can lift conversion by over 20 % and reduce checkout abandonment by up to 30 %. Integrating multi‑currency settlement through a single provider such as Airwallex adds 2–5 % to net margin without altering game design.
A phased rollout model enables Vietnamese studios to pilot in core markets, expand regionally through configuration rather than new vendor projects, and scale into high‑value markets like the US for top‑line growth and FX savings. Premium ad formats on TikTok, when matched to specific spending barriers, can boost transaction values by 20–30 % and shift campaigns from cost‑per‑install to return‑on‑ad‑spend metrics. Case studies, such as Falcon Game Studio’s pivot to a hybrid model with 60–70 % day‑one retention and a 3–5 % global payer rate, illustrate the tangible benefits of this approach.
Overall, Vietnam’s mobile gaming sector is poised to compete globally by leveraging robust payment partners, privacy‑first acquisition tactics, and a disciplined IAP strategy that unlocks higher lifetime value and sustainable studio growth through 2026.
- Vietnam’s mobile gaming sector is shifting from an ad-driven model to hybrid-casual titles prioritizing in-app purchases (IAP) and subscriptions, following a 65% surge in local IAP growth in 2025.
- While Vietnam led global Google Play downloads with 6.1 billion installs in 2024, the market generated only $430 million, highlighting the profitability ceiling of pure advertising models.
- Localized pricing strategies, including purchasing power parity tiers and one-tap tokenized payments, can increase conversion rates by over 20% and reduce checkout abandonment by up to 30%.
- Integrating multi-currency settlement through providers like Airwallex can improve net margins by 2–5% without requiring changes to game design.
- Falcon Game Studio’s transition to a hybrid model demonstrates the viability of this strategy, achieving 60–70% day-one retention and a 3–5% global payer rate.
+3
InvestGameFeb 2026
Report13 pages
Aream & Co. Gaming CEO Survey 2025
The survey, conducted by Aream & Co., gauges executive optimism regarding consumer spending on gaming in 2025 across multiple channels and functional areas. Overall, 49 % of respondents view spending as “more optimistic,” another 49 % see it as unchanged, and only 2 % are less optimistic. When broken down by platform, mobile spending is perceived as more optimistic (49 %) while PC and console views are split between “more” (15–33 %) and “about the same.” In‑app purchases are viewed as more optimistic (80 %) versus in‑app advertising (41 %).
Key challenges identified include content saturation and over‑supply, with 33 % citing these as concerns; marketing environment issues affect 49 %, and macro conditions are a worry for 17 %. Despite these, 54 % anticipate more new games in 2025, and 37 % expect higher average budgets. Marketing spend is expected to rise for 48 %, while engineering and game development are seen as more optimistic (71 % and 42 %).
The survey also highlights a strong appetite for mergers and acquisitions, with 71 % expecting more M&A activity. Advanced integration across multiple functions is viewed as more optimistic (49 %) but limited implementation remains a concern.
The data derive from a global sample of gaming CEOs, reflecting perspectives across mobile, PC, console, and various functional departments. The findings suggest a cautiously optimistic outlook for 2025, tempered by supply‑side pressures and marketing challenges.
- Industry sentiment for 2025 is largely stable or positive, with 98% of CEOs reporting that consumer spending will be either unchanged (49%) or more optimistic (49%).
- M&A activity is expected to accelerate, with 71% of executives anticipating an increase in deal-making throughout 2025.
- In-app purchases are the primary revenue driver, with 80% of respondents optimistic about growth compared to only 41% for in-app advertising.
- Investment in development remains a priority, as 71% of CEOs are optimistic about engineering budgets and 42% about game development, with 37% expecting higher average project budgets.
- Marketing remains a critical pain point, with 49% of executives citing the current marketing environment as a major challenge despite 48% planning to increase their marketing spend.
+4
Aream & CoFeb 2026

Report9 pages
Mobile App User Trends: MENA Ramadan 2026
The analysis focuses on mobile application usage patterns observed during the Ramadan period of 2026 across the Middle East and North Africa (MENA) region. The primary objective is to quantify shifts in user engagement, subscription behavior, and platform preference relative to the preceding year and a broader baseline average. Key metrics examined include overall app usage, subscription growth, in‑app purchases, and social media interaction.
Findings indicate a pronounced rise in overall app engagement during Ramadan 2026, with total usage increasing by approximately 111 % compared to the same period in 2025. Subscription activity shows a 42 % uptick, while in‑app purchase volume climbs by 91 %. Social media engagement metrics—measured through likes, shares, and comments—exhibit a 63 % increase. When benchmarked against the average growth rate for the same timeframe (2025‑2026), these figures represent a significant acceleration, suggesting heightened consumer activity during the holy month.
The data set covers all MENA markets and aggregates daily usage logs from a representative sample of mobile devices. The methodology involved longitudinal tracking of app sessions, transaction records, and social media interactions over the 30‑day Ramadan period. Comparative analysis was performed against both the previous year’s Ramadan metrics and a rolling 12‑month average to isolate seasonal effects.
In conclusion, the Ramadan period of 2026 drove substantial growth across multiple facets of mobile app consumption in MENA, with overall usage and monetization metrics surpassing historical trends. These insights underscore the strategic importance of tailoring app offerings, promotional campaigns, and user experience enhancements to align with cultural and religious calendars in the region.
- Overall mobile app engagement in the MENA region during Ramadan 2026 increased by 111% compared to the same period in 2025.
- In-app purchase volume saw a significant surge, rising by 91% during the 30-day Ramadan period.
- Social media interaction, measured by likes, shares, and comments, grew by 63% compared to the previous year.
- Subscription activity experienced a 42% uptick during the 2026 Ramadan period.
- Growth metrics across usage and monetization significantly outperformed both the previous year's Ramadan data and the rolling 12-month baseline average.
+2
InvestGameJan 2026
Report128 pages
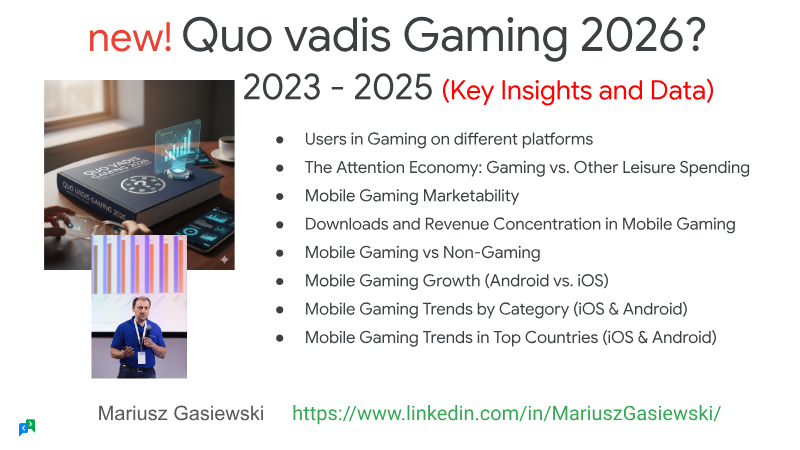
Key Insights and Data: 2023–2025
Mobile gaming drives the global industry’s growth through 2025, accounting for more than half of worldwide revenue and over eighty percent of players. Global gaming income is projected to reach $197 billion in 2025, a 7.5 % year‑over‑year rise largely powered by mobile and PC segments, while console expansion remains modest. The sector’s resilience is most pronounced in emerging markets where Android and iOS user volumes surge, yet revenue concentration persists in Western regions—particularly the United States and the United Kingdom—where iOS dominates acquisition spend.
Competitive dynamics sharpen as the top ten to fifty titles on Google Play and Apple’s App Store capture an increasing share of revenue, creating a winner‑take‑all environment. Hyper‑casual and match‑3 games concentrate U.S. spend, whereas Android strategy titles spread more evenly across Japan, Korea, and Taiwan. Sub‑genres such as chess, ludo, hidden object RPGs, and slots thrive in China, India, Brazil, and Southeast Asia, collectively commanding 15–20 % of global spend. Across most categories, day‑one retention has slipped from roughly 80 % to about 60 %, underscoring a broader challenge of sustaining early engagement.
Download patterns reveal Android’s volume advantage—about 70 % of global downloads—with the United States, India, Brazil, and Indonesia leading. iOS, though smaller in volume (30 %), delivers higher per‑download revenue, especially in China and the U.S. iOS penetration is rising in emerging markets such as Brazil and Vietnam, while Android’s share in India climbs from 18.8 % to 21.3 %. Genre‑level analysis shows modest growth (10–30 %) across most mobile categories, with occasional outliers and declines in specific niches. Overall, the landscape is characterized by rapid mobile expansion, concentrated monetization power, and shifting geographic priorities that shape strategic opportunities for developers and marketers.
- Global gaming revenue is projected to reach $197 billion in 2025, representing a 7.5% year-over-year increase driven primarily by mobile and PC segments.
- Mobile gaming remains the dominant force in the industry, accounting for over 50% of global revenue and more than 80% of the total player base.
- The mobile market is increasingly a winner-take-all environment, with the top 10 to 50 titles on Google Play and the Apple App Store capturing a growing share of total revenue.
- Android maintains a 70% share of global downloads, while iOS accounts for 30% but continues to generate significantly higher revenue per download in key markets like the U.S. and China.
- Sustaining early player engagement is becoming more difficult, as day-one retention rates have declined from approximately 80% to 60% across most categories.
+3
InvestGameJan 2026