ReportInvestGame
Festive Season 2025: App Marketing Trends and Strategies for India
20 Jan 202632 pages~24 min full read
India’s festive season—from Onam in August through Diwali and Christmas in December—drives more than 30 % of the country’s annual digital advertising spend, making it a pivotal period for app marketers. In 2024, mobile games alone attracted over 3.2 billion downloads and generated $151 million in‑app purchase revenue, while non‑gaming verticals such as shopping, food delivery and OTT experienced sharp install spikes during key festivals. The data reveal a 53 % rise in mobile ad spend from Q1‑Q2 to Q3‑Q4, with installs up 36 % and re‑engagements soaring 69 % during the peak festive window, underscoring the season’s high‑value user acquisition and monetisation potential.
User‑acquisition efficiency improved markedly, with CPI falling by approximately 12 % while CPA remained stable. Video and playable ads delivered the highest ROAS—up to 4.2× in fintech and 3.8× in e‑commerce—and programmatic/OEM placements on Xiaomi and Samsung yielded significant conversion lifts, particularly in Tier‑2 and Tier‑3 cities. Creatives that refreshed weekly, incorporated localized language, and employed urgency cues such as countdowns outperformed static ads, highlighting the need for agile, culturally relevant creative and a diversified media mix that extends beyond Meta and Google into programmatic and OEM channels.
Marketers are increasingly leveraging data‑driven platforms—Singular, MobuppsX, Sensor Tower, Pathmatics and others—to optimise acquisition, retention and media spend. By integrating MAFO, iRTB, advanced fraud prevention and audience‑retention analytics, brands can reduce wasted spend, improve advertising ROI and accelerate growth across web, social and mobile channels. A unified data‑house approach enables faster campaign optimisation, measurable engagement gains and stronger competitive positioning during India’s lucrative festive period.

InvestGame · 2026
InvestGame · 2026

InvestGame · 2026

InvestGame · 2026

InvestGame · 2026

InvestGame · 2026

InvestGame · 2026
InvestGame · 2026

InvestGame · 2025

InvestGame · 2025

InvestGame · 2025
InvestGame · 2025

Sensor Tower · 2025
Tenjin · 2023
Tenjin · 2022
AdQuantum · 2022
SocialPeta · 2021

Almedia · 2026
Gamesight · 2026
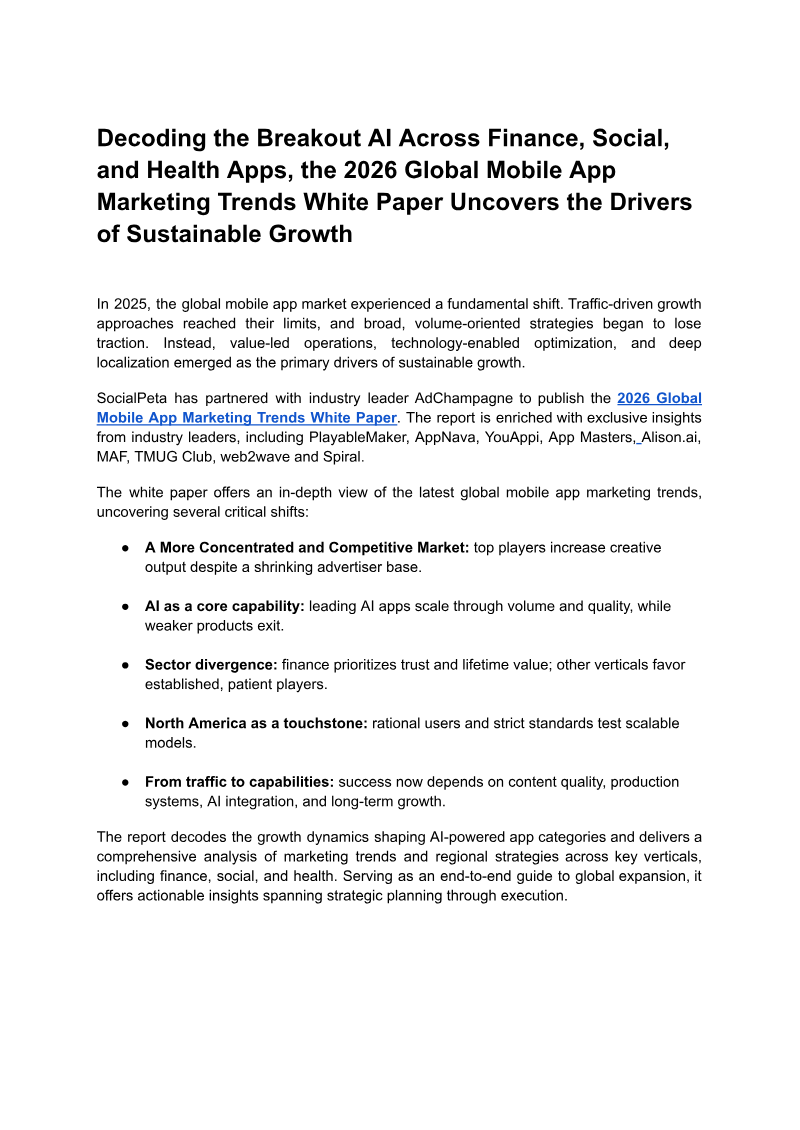
SocialPeta · 2026

SocialPeta · 2026

SocialPeta · 2026
Sensor Tower · 2026
SocialPeta · 2025