Skip to main content
Game Industry
Library
Library
Search
Ask AI
News
Connect your AI
Browse
The Catch Up
Topics
Collections
Writers
Help
Subscribe
Game Industry
Library
Library
Search
Ask AI
Saved
GameAnalytics | Game Industry Library
Writers
GameAnalytics
Back to Writers
GameAnalytics
Research
16 documents
Documents
Reports
Presentations
Whitepapers
Articles
Financial
Legal
Other
Recently added
Newest first
Oldest first
Title A–Z
Title Z–A
Whitepaper
10 pages
Your Data Tracking Plan: A Step-by-Step Guide for GameAnalytics
Establish a structured tracking plan by aligning business objectives and player behavior questions with seven predefined event categories: Session, Business, Resource, Progression, Error, Ads, and Impression.
Limit custom events to a maximum of 50 unique identifiers to maintain data integrity and prevent system clutter.
Adopt a consistent Category > Sub-Action naming framework to ensure clarity and prevent redundant or misleading data collection.
Game Development
Quality Assurance
Game Design
+1
GameAnalytics
Report
8 pages
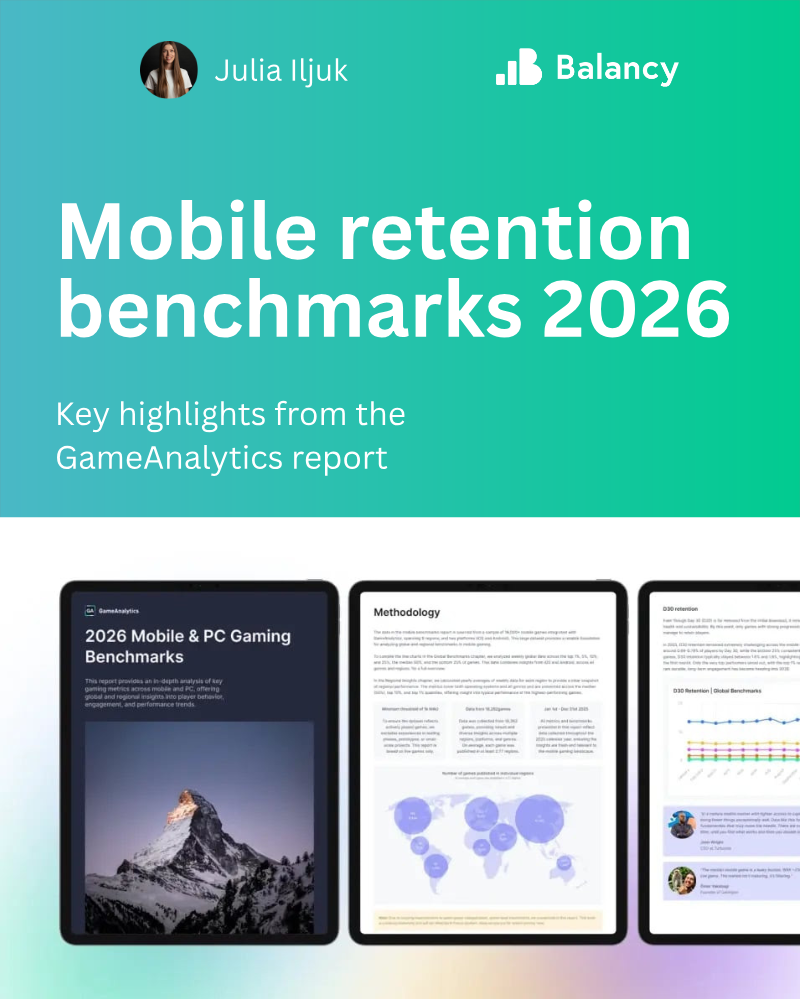
Mobile & PC Gaming Benchmarks 2026
Industry-wide retention benchmarks have shifted downward to a 35/15/5 standard for Day 1, Day 7, and Day 30, replacing the historical 40/20/10 model.
Median retention rates in 2026 are currently 22% for Day 1, 4% for Day 7, and 0.7% for Day 30, highlighting a significant struggle to maintain long-term player interest.
A widening performance gap exists between average titles and the top 10% of games, with top-tier titles maintaining a 40% Day 1 retention threshold compared to the 22% median.
Mobile
Retention
PC
+2
GameAnalytics
Jan 2026
Report
19 pages
Hyper-Casual 9 Games Benchmark Report: Q3 2022
iOS maintains a significant retention advantage over Android across all performance tiers, with top-tier iOS games achieving 51% day-1 and 22% day-7 retention compared to 42% and 16% on Android.
The cost-per-install (CPI) gap between Android and iOS has narrowed to 10 cents, down from a four-year average of 15 cents, indicating intensified competition on the Android platform.
Median hyper-casual titles show a clear performance disparity between platforms, with iOS recording 25% day-1 and 6% day-7 retention versus 19% and 3% on Android.
Monetization
Market Analysis
Tenjin
Jan 2025
Report
23 pages
2025 Mobile Gaming Benchmarks
75 percent of mobile games failed to achieve a 3 percent retention rate by day 28 in 2024, highlighting a widespread struggle to maintain long-term player loyalty.
Retention is the primary driver for both user acquisition ROI and sustainable monetization, making it the most critical metric for long-term viability.
Multiplayer titles command the longest average session durations of 8 to 9 minutes but struggle significantly with long-term user retention.
Market Analysis
Player Behavior
Retention
+2
GameAnalytics
Jan 2025
Report
23 pages
Mobile Gaming Benchmarks 2025
Retention is the primary driver of long-term engagement, revenue, and user acquisition ROI across the 11,600 titles analyzed.
Average session lengths have decreased, with top-tier games averaging 8–9 minutes and median-tier games averaging 5–6 minutes.
Midcore titles lead in engagement frequency, generating six to seven sessions per day.
Market Analysis
Retention
Mobile
+1
GameAnalytics
Jan 2025
Report
8 pages
Tower Defense Games - Industry Snapshot
Top-tier Tower Defense games achieve a 3.83% conversion rate and an ARPDAU of $1.66, significantly outperforming Idlers, Platformers, and Board Games.
The genre sustains a highly committed player base with an Average Revenue Per Paying User (ARPPU) of $83 and an average daily playtime of 130 minutes.
China is the most lucrative market for the genre, reaching a conversion rate of 8.7%, while France leads in engagement with 210 minutes of daily playtime.
Market Analysis
Player Behavior
Tower Defense
+2
GameAnalytics
Jan 2025
Report
21 pages
2023 Roblox Report: Behind the Data
Retention is a universal challenge on Roblox, with Day 1 retention averaging 12% to 15% and falling to approximately 1% by Day 90.
Monetization is highly concentrated, as only 4.2% of players spend Robux, with over half of those spenders contributing less than $1 annually.
Top-tier games in the 95th percentile generate approximately $77 per playing player annually, significantly outperforming the broader platform average.
Player Behavior
Monetization
Global
+1
GameAnalytics
Mar 2024
Report
24 pages
Mobile Gaming Benchmarks for Q1 2024
Global median retention rates for Q1 2024 are 22.91% for day-1, 4.20% for day-7, and 0.85% for day-28.
Classic genre titles, including board, card, casino, trivia, and word games, consistently outperform casual and mid-core titles in retention metrics across all tracked regions.
The global median session length is 4.45 minutes, though casino and card games significantly exceed this, reaching up to 25 minutes in European markets.
Retention
Live Ops
Mobile
+1
GameAnalytics
Jan 2024
Report
24 pages
Mobile Gaming Benchmarks: Q1 2024
Global median retention rates for Q1 2024 were 22.91% for Day 1, 4.20% for Day 7, and 0.85% for Day 28.
Classic games, including board, card, casino, and trivia titles, consistently outperformed all other genres across most regions and metrics.
The global median session length is 4.45 minutes, with most genres averaging between 4 and 5 sessions per day.
Market Analysis
Retention
Live Ops
+2
GameAnalytics
Jan 2024
Report
17 pages
Hyper-Casual Games Benchmark Report: Q4 2022
Hyper-casual median CPI reached an all-time high of $0.42 in Q4 2022, with iOS experiencing a significant $0.17 increase compared to the previous quarter.
iOS consistently outperformed Android in retention, with top-tier (top 2%) games achieving 45% Day 1 retention on iOS compared to 38% on Android.
The United States recorded the highest iOS median CPI among top ad-spending countries at $0.80, while Brazil fell out of the top ten ranking.
Market Analysis
Monetization
User Acquisition
+3
Tenjin
Dec 2022
Report
8 pages
Tower Defense Games 2020 Industry Snapshot
Tower defense titles achieved an average revenue per paying user (ARPPU) of $83 in 2020, significantly outperforming board games and idler genres.
The sub-genre maintained an average revenue per daily active user (ARPDAU) of $1.66 and a daily conversion rate of 3.83% across 900 million unique monthly players.
China leads in monetization efficiency with an 8.7% conversion rate, which is nearly double the 4.6% conversion rate observed in the United States.
Market Analysis
Player Behavior
GameAnalytics
Jan 2021
Report
8 pages
Tower Defense Games: Deconstructing the Superstars (2020 Industry Snapshot)
Tower defense games demonstrate high monetization efficiency with an ARPPU of $83, an ARPDAU of $1.66, and a daily conversion rate of 3.83%.
China is the most lucrative market for the genre, achieving an 8.7% conversion rate, which is nearly double that of the United States.
Regional engagement metrics vary significantly, with Italy leading in Day 7 retention at 39% and France recording the highest average daily playtime at 210 minutes.
Market Analysis
Tower Defense
Mobile
+1
GameAnalytics
Jan 2020
Previous
1
2
Next