Global
Documents
Mobile Gaming Benchmarks for Q1 2024
The benchmark study presents a comprehensive snapshot of mobile gaming performance during Q1 2024, focusing on key engagement metrics—retention, session length, and session count—across North America, Europe, the Middle East, and Asia. Data derive from over 10 000 games tracked by GameAnalytics, with each title typically released in at least three regions, yielding a combined monthly active user base of approximately 1.67 billion.
Retention figures reveal that the global median day‑1 retention stands at 22.91 %, day‑7 at 4.20 %, and day‑28 at 0.85 %. Classic games (board, card, casino, trivia, word) dominate retention performance, especially in the Middle East where they lead all regions. Casual and mid‑core titles lag behind, with puzzle games maintaining stable but lower retention across all markets.
Session length analysis shows a global median of 4.45 minutes, with casino and card games achieving the longest sessions in North America (≈20 min) and Europe (card games exceeding 25 min). In the Middle East, casino titles surpass 15 minutes, while Asia’s top casino games reach nearly 23 minutes. Session count averages range from 3–5 daily sessions per game, with puzzle and word games in the Middle East achieving the highest counts (≈10 sessions/day).
Methodologically, metrics are reported in quantiles—top 25 %, median, and bottom 25 %—to illustrate performance across the spectrum of developers. The report underscores that high retention, longer session lengths, and frequent session counts correlate with stronger player engagement, offering actionable insights for studios aiming to benchmark against industry leaders.
- Global median retention rates for Q1 2024 are 22.91% for day-1, 4.20% for day-7, and 0.85% for day-28.
- Classic genre titles, including board, card, casino, trivia, and word games, consistently outperform casual and mid-core titles in retention metrics across all tracked regions.
- The global median session length is 4.45 minutes, though casino and card games significantly exceed this, reaching up to 25 minutes in European markets.
- Daily session frequency typically ranges from 3 to 5 sessions, with puzzle and word games in the Middle East achieving a peak performance of approximately 10 sessions per day.
- The Middle East region shows a distinct preference for classic games, which lead retention performance in that market compared to other global regions.

State of Game Technology Report 2024
The report demonstrates that game technology is increasingly permeating non‑traditional sectors, with half of surveyed teams employing real‑time 3D engines beyond game development. This cross‑industry diffusion is accompanied by persistent funding constraints and collaboration bottlenecks, notably slow file transfers, remote coordination difficulties, and asset feedback challenges. The data reveal a trend toward consolidating toolsets to enhance productivity amid economic uncertainty and the rise of remote work.
Engine usage remains dominated by Unreal Engine (63 %) while Unity follows at 47 %; Godot is gaining traction mainly among indie developers. Version control practices show Perforce Helix Core leading (51 %) with widespread adoption of Git‑based solutions, though Google Drive remains a common secondary storage option.
Asset management practices differ markedly between AAA and indie studios. Custom‑built solutions are common in both, yet 23 % of AAA teams and 17 % of indie studios rely on them, diverting resources from core development. Indie teams more frequently use Perforce (55 %) compared to AAA studios (3 %). Generative AI adoption is high, with 65 % of respondents using an organizational AI tool; ChatGPT leads at 47 %, especially among indie/mid‑size studios (50 % versus 26 % in AAA). Other AI tools such as Midjourney, DALL‑E, and GitHub Copilot also see notable usage.
Cloud infrastructure is embraced by nearly half of respondents (49 %), with AWS leading at 30 % and Azure at 18 %; hybrid cloud adoption remains minimal (6 %).
Talent acquisition trends underscore a premium on specialized experience (≈95–100 %) and continuous learning ability (≈71–82 %), while presentation skills and portfolio strength, though important, receive comparatively lower emphasis. These findings highlight a shift toward adaptable, skill‑rich talent pools across highly technical industries.
- Real-time 3D engines are expanding beyond gaming, with 50% of surveyed teams now applying this technology to non-traditional sectors.
- Generative AI adoption is widespread, with 65% of organizations utilizing AI tools, led by ChatGPT at 47% usage, particularly among indie and mid-size studios.
- Unreal Engine remains the market leader at 63% usage, followed by Unity at 47%, while Perforce Helix Core dominates version control at 51%.
- Cloud infrastructure adoption has reached 49%, with AWS holding a 30% market share compared to 18% for Azure.
- Asset management remains inefficient, as 23% of AAA studios and 17% of indie teams divert core development resources to maintain custom-built solutions.
Annual Report 2024
Thunderful Group’s 2024 Annual Report documents a decisive pivot toward a pure gaming focus, achieved through divestment of non‑gaming assets and a 20 % workforce reduction. The restructuring tightened the balance sheet, halving interest‑bearing net debt and leaving a modest cash position of SEK 29.6 million, yet it also produced a sharp decline in operating performance: net revenue fell 23.8 % to SEK 292.8 million and adjusted EBITA swung to a loss of SEK 383.9 million, largely due to cost‑cutting and the transition to higher‑margin publishing and co‑development activities.
The global gaming market grew modestly in 2024, reaching USD 187.7 billion with a 5 % rise in the player base to 1.5 billion, projected to reach 1.67 billion by 2027. Thunderful’s strategy targets a 3.1 % CAGR in the PC segment, high‑quality titles priced USD 10–30, and external project investments capped at EUR 2 million. The company has reorganised into Publishing and Co‑development & Services segments to optimise resource allocation, lower fixed costs through third‑party publishing, and balance riskier internal IP development with predictable service revenue.
Governance remains robust: a board‑led risk framework, annual review of a Zero‑tolerance Code of Conduct, and an anonymous whistleblowing function reinforce ethical standards. Executive remuneration is tightly linked to long‑term value, with fixed salaries capped at 30 % variable pay and share‑based incentives that could dilute equity by up to 4.65 % if fully exercised. Despite a net loss of SEK 887.5 million in 2024, the Group’s operating profit rose 57 % to SEK 292.8 million, signalling a turnaround post‑restructuring.
Financially, the Group’s liquidity is constrained; total assets fell from SEK 3.15 billion to SEK 772.9 million, and net cash turned negative. Impairments of over SEK 444 million on goodwill and other intangibles, coupled with significant restructuring costs, underpin the negative operating margin of –46.9 %. The company’s exposure to foreign‑exchange, interest‑rate and liquidity risks remains moderate but requires ongoing monitoring. Overall, the report presents a company in transition, balancing aggressive cost discipline and strategic realignment against a challenging financial backdrop.
- Thunderful Group reported a net loss of SEK 887.5 million in 2024, driven by SEK 444 million in asset impairments and significant restructuring costs that resulted in an operating margin of -46.9%.
- The company executed a major strategic pivot toward a pure gaming focus, involving a 20% workforce reduction and the divestment of non-gaming assets to halve interest-bearing net debt.
- Net revenue declined 23.8% to SEK 292.8 million, while adjusted EBITA fell to a loss of SEK 383.9 million as the firm transitioned toward higher-margin publishing and co-development models.
- Thunderful has reorganized into two core segments—Publishing and Co-development & Services—to balance high-risk internal IP development with predictable service revenue and lower fixed costs.
- The company’s financial position remains constrained, with total assets dropping from SEK 3.15 billion to SEK 772.9 million and a modest cash position of SEK 29.6 million.

Gaming Report 2024: Meet the Moment – How Gamers Are Changing the Game
The report demonstrates that the global video‑game market reached $196 billion in 2023 and is expected to grow at roughly 6 % per year through 2028. Growth is driven by a youthful demographic—80 % of players aged 2‑18—who devote nearly one third of their entertainment time to gaming. These gamers increasingly engage in immersive, cross‑platform ecosystems that combine social interaction, co‑creation and real‑world extensions of game IP. Their spending per hour can be up to five times higher when they participate in multiple activities, underscoring the commercial value of integrated experiences.
Key findings reveal that 70 % of players use multiple devices and 90 % desire a single consolidated marketplace, with half willing to pay for it. Publishers are therefore urged to develop device‑agnostic platforms, strengthen direct relationships with players and employ data‑driven marketing. In the mobile sector, an 80 % failure rate after three years contrasts sharply with a 10–25 % failure rate in software and retail, highlighting the need for highly targeted paid performance marketing, rigorous A/B testing and tight alignment across development, finance and marketing teams. Long‑term acquisition and retention strategies, coupled with generative AI for ad creation and optimization, are identified as critical success factors.
Operating models at leading studios are shifting toward standardised core tools, autonomous entrepreneurial teams with clear milestones and strategic embedding of generative AI. Talent attraction now demands a comprehensive package that includes purpose, competitive pay, work‑life balance, learning paths and ESG commitments to remain competitive with the broader tech industry. The report’s thesis is that understanding diverse gamer segments, delivering interoperable cross‑platform experiences and investing in data‑driven, AI‑enhanced operations are essential for capturing the rapidly expanding, monetarily active gaming audience.
- The global video game market reached $196 billion in 2023 and is projected to grow at an annual rate of approximately 6% through 2028.
- Engagement in immersive, cross-platform ecosystems is highly lucrative, as players spend up to five times more per hour when participating in multiple activities rather than gaming alone.
- Mobile game titles face an 80% failure rate after three years, necessitating rigorous A/B testing, targeted performance marketing, and tight alignment between development and finance teams.
- Consumer demand for platform interoperability is high, with 90% of players desiring a single consolidated marketplace and 50% willing to pay for such a service.
- Youth aged 2–18 represent 80% of the player base and dedicate nearly one-third of their total entertainment time to gaming.

How Consumers Engage with Games Today: Newzoo’s Global Gamer Study 2024
Gaming dominates contemporary culture, with eight in ten global consumers actively playing or engaging in related activities. The study identifies a highly engaged, high‑spending cohort—particularly Gen Alpha and Gen Z players—who devote an average of 5.2 hours per week to gaming, outpacing social media use. These younger generations also participate in content viewing and community interaction, favoring adventure‑type titles that deliver trend‑driven experiences.
Gen Z’s motivations center on expansive open worlds (66–73%) and deep storytelling (65–68%), with optional tasks, high‑speed action, competitive duels (71%) and cooperative goals (68%) also prominent. Their average daily playtime on PC/console is 2.1 hours, and 22 % spend $25 or more monthly, demonstrating a willingness to pay upfront. In contrast, mobile players prefer free‑to‑play models and lower spend levels.
A significant segment of PC/console gamers—about one third—are “new game seekers.” They spend 7–8 hours weekly, often across two or three platforms, and are predominantly Gen Z (42%) and Baby Boomers. These players allocate over $25 monthly on average, favor adventure, fighting, shooter, racing and battle‑royale titles with high graphics fidelity and survival themes. They consume gaming media at a rate exceeding 90 % and show strong loyalty to franchise titles such as Call of Duty, FIFA, and Roblox.
The findings underscore that Gen Alpha and Gen Z represent a sizable, spend‑capable audience for expansive, socially driven experiences. Simultaneously, the new‑game‑seeker cohort highlights opportunities for high‑quality, cross‑genre titles that appeal to both younger and older demographics across PC, console, and mobile platforms.
- Gen Z and Gen Alpha players spend an average of 5.2 hours per week gaming, surpassing their time spent on social media.
- Approximately 22% of Gen Z players spend $25 or more monthly on games, showing a strong preference for upfront payments compared to the free-to-play model favored by mobile gamers.
- One-third of PC/console gamers are 'new game seekers' who spend 7–8 hours weekly across multiple platforms and consistently invest over $25 monthly.
- Gen Z motivations are driven by open-world environments (66–73%), deep storytelling (65–68%), competitive duels (71%), and cooperative goals (68%).
- New game seekers are predominantly Gen Z (42%) and Baby Boomers who show high loyalty to major franchises like Call of Duty, FIFA, and Roblox.

Inside Gaming: It's Personal!
The report examines how video games increasingly serve as a platform for personal identity and self‑expression, noting that nearly two thirds of gamers feel they can be more authentic while playing. It argues that this trend fuels a 30 % rise in time spent gaming among those who view games as a space for true self‑presentation, compared with previous years. The analysis draws on a global survey of 5,000 entertainment and gaming consumers and proprietary first‑party data from Fandom for 2024. Findings highlight that in‑game customization is the most powerful driver of self‑expression, with 76 % of players citing character personalization as a key tool; gamertags and usernames follow at 48 %, while communication features, signatures, emblems, emotions, and gestures each attract between 30‑35 % of respondents. The study also identifies a disconnect: many gamers believe they can be authentic online yet perceive their in‑person gamer persona as distinct from their real‑life personality. Brands are encouraged to bridge this gap by creating opportunities that translate virtual identity into physical expression—such as cosplay collaborations, cosmetic product lines, or skill‑building experiences that mirror in‑game achievements. The report covers a global audience across all major gaming segments, focusing on the 2024 period and emphasizing actionable insights for marketers seeking to align brand experiences with gamers’ desire for authenticity.
- Nearly two-thirds of gamers report feeling more authentic while playing than in their daily lives, a sentiment that has driven a 30% increase in time spent gaming among those who view these platforms as spaces for self-presentation.
- In-game character customization is the primary driver of self-expression for 76% of players, significantly outpacing other features like usernames (48%) and communication tools or emotes (30–35%).
- Fandom’s 2024 data indicates a psychological disconnect where gamers maintain distinct online personas that they perceive as separate from their real-life identities.
- Marketers can capitalize on the desire for authenticity by creating physical-world extensions of virtual identities, such as cosplay collaborations, branded cosmetic lines, or skill-building programs that mirror in-game achievements.
- These insights are based on a 2024 global survey of 5,000 entertainment and gaming consumers, combined with proprietary first-party data from Fandom.
Digital Market Index: Q1 2024
Global consumer spending on mobile applications reached a record $45 billion in the first quarter of 2024, reflecting a 9.5% year‑over‑year increase that was largely driven by the iOS ecosystem, which grew 11.5% versus a 5.3% rise on Google Play. Despite this surge in spend, total app downloads fell 3.5%, marking the third consecutive quarterly decline since Q1 2021; nevertheless, iOS maintained its highest quarterly download volume since 2020. Entertainment and productivity categories led the spend growth, each expanding over 30% YoY, while gaming spending rebounded on iOS but remained flat on Google Play.
Hyper‑casual games continued to dominate the download landscape, with racing and action titles generating the largest volumes. Conversely, casual sub‑genres such as arcade and simulation experienced double‑digit declines. TikTok remained the top spender globally, generating more than $1.2 billion in revenue and outpacing YouTube by a wide margin, while emerging short‑form drama apps—ReelShort, DramaBox, and ShortMax—entered the top ten for both revenue and download growth. In mobile gaming, “Monopoly GO” set a new quarterly spend record of $770 million, surpassing the previous $765 million benchmark and standing alone as a title to exceed $600 million in a single quarter.
Retail‑media advertising in the United States was led by Walmart and Target, which together delivered over 18 billion impressions in Q1 2024. Specialized retailers such as Chewy and Home Depot captured significant niche shares, with personal care emerging as the top category overall—driven by Ulta and Sephora. Walmart dominated food, beverages, and consumer packaged goods, while Target excelled in shopping, household supplies, and baby & toddler segments. Co‑branded partnerships—including Chewy × Purina, Walmart × Unilever, and Target × Apple—generated hundreds of millions of impressions, underscoring the strategic value of retailer‑brand collaborations in expanding digital ad reach.
- Global mobile app spending reached a record $45 billion in Q1 2024, a 9.5% year-over-year increase driven primarily by an 11.5% growth in the iOS ecosystem.
- Total app downloads declined by 3.5%, marking the third consecutive quarterly drop, even as iOS achieved its highest download volume since 2020.
- Monopoly GO set a new mobile gaming record with $770 million in quarterly spend, becoming the only title to surpass $600 million in a single quarter.
- Entertainment and productivity apps led category growth with over 30% year-over-year increases, while TikTok maintained its position as the top-earning app with $1.2 billion in revenue.
- Short-form drama apps including ReelShort, DramaBox, and ShortMax emerged as top performers in both revenue and download growth during Q1 2024.
Perforce 2024 State of Game Technology Report
The report demonstrates that real‑time 3D engines and advanced asset pipelines are now integral to more than half of organizations beyond traditional game development, spanning media, automotive, education and healthcare. The primary drivers are the demand for high‑quality visual tools that can be reused across projects and the need to streamline workflows amid increasingly complex, remote‑enabled teams. Funding constraints, collaboration bottlenecks—particularly large‑file transfer—and limited staffing emerge as the top challenges.
Collaboration pain points persist, with 31 % of studios citing slow large‑file transfer and 38 % reporting remote coordination issues. Unreal Engine dominates usage at 63 %, while Unity follows at 47 %. Perforce Helix Core leads version‑control adoption (51 %) across industries, with GitHub and GitLab trailing. These figures underscore the necessity of robust pipelines that support rapid asset sharing, remote teamwork and efficient version control.
Asset management practices vary by studio size: AAA studios largely build custom tools (≈ 19 %) to handle extensive IP libraries, diverting resources from core development; indie and mid‑size studios rely more on market solutions, with 32 % using Perforce Helix Core and only 17 % developing in‑house tools. Generative AI is widely adopted, with over 65 % of respondents using an AI tool—ChatGPT being the most common (47 %). Indie studios adopt AI more aggressively than AAA studios, and usage patterns differ by industry. Cloud development is also prevalent: 49 % run cloud servers, led by AWS (30 %) and Azure (18 %), while hybrid or on‑premises setups are rare.
Hiring priorities across gaming, media, education, engineering and automotive sectors emphasize specialized experience (91–100 %) and strong portfolios (75–94 %). General cross‑functional skills such as rapid learning and presentation abilities are valued but to a lesser extent (54–82 %). The data indicate that firms prioritize deep technical expertise and demonstrable work, reflecting a continued focus on specialized knowledge across all sectors.
- Real-time 3D engines have expanded beyond gaming, with over 50% of organizations in media, automotive, education, and healthcare now integrating these technologies into their workflows.
- Unreal Engine leads the market with 63% usage, followed by Unity at 47%, while Perforce Helix Core remains the primary version-control solution for 51% of firms.
- Generative AI adoption is widespread, with over 65% of respondents utilizing AI tools, led by ChatGPT at 47%, with indie studios showing higher adoption rates than AAA counterparts.
- Collaboration remains a significant bottleneck, as 31% of studios struggle with slow large-file transfers and 38% report ongoing issues with remote team coordination.
- Cloud infrastructure is the industry standard for development, with 49% of organizations utilizing cloud servers, primarily through AWS (30%) and Azure (18%).
Gaming Industry Report: Q4 2023
The global gaming industry reached a market valuation of $184 billion in 2023, representing a modest year-over-year growth of 0.6%. Despite this stability, the sector experienced a significant contraction in investment activity, with venture funding falling 33% quarter-over-quarter in Q4 to $308 million. This decline reflects a broader normalization of capital flows to pre-pandemic levels, as the industry shifts away from the high-growth, speculative environment of 2021 and 2022.
Key industry trends in late 2023 were defined by regulatory and operational restructuring. A landmark legal verdict against Google established that its app store practices constituted an illegal monopoly, forcing potential shifts in how developers distribute content and process payments. Simultaneously, major players like ByteDance began retreating from gaming divisions, while the industry at large grappled with approximately 10,500 layoffs. These workforce reductions were driven by a heightened focus on operational efficiency, the prioritization of high-retention projects, and the consolidation of assets following major mergers and acquisitions.
Geographically, North America remains the primary hub for venture capital, though the industry maintains a global footprint with significant activity in Asia and Europe. While venture funding and M&A deal volumes have stabilized, public gaming stocks demonstrated resilience, with leading exchange-traded funds outperforming broader market indices by year-end. Looking forward, the industry is projected to maintain a compound annual growth rate of 3.5% through 2029, supported by the continued integration of user-generated content platforms and advancements in developer tools that emphasize productivity and cost-effective scaling.
- The global gaming industry reached a $184 billion valuation in 2023, reflecting a modest year-over-year growth of 0.6%.
- Venture funding for the gaming sector dropped 33% quarter-over-quarter in Q4 2023 to $308 million, signaling a return to pre-pandemic capital levels.
- Approximately 10,500 industry layoffs occurred in 2023 as companies prioritized operational efficiency, asset consolidation, and high-retention projects.
- A landmark legal verdict against Google ruled its app store practices an illegal monopoly, potentially forcing significant changes to content distribution and payment processing.
- The industry is projected to maintain a 3.5% compound annual growth rate through 2029, driven by user-generated content and productivity-focused developer tools.
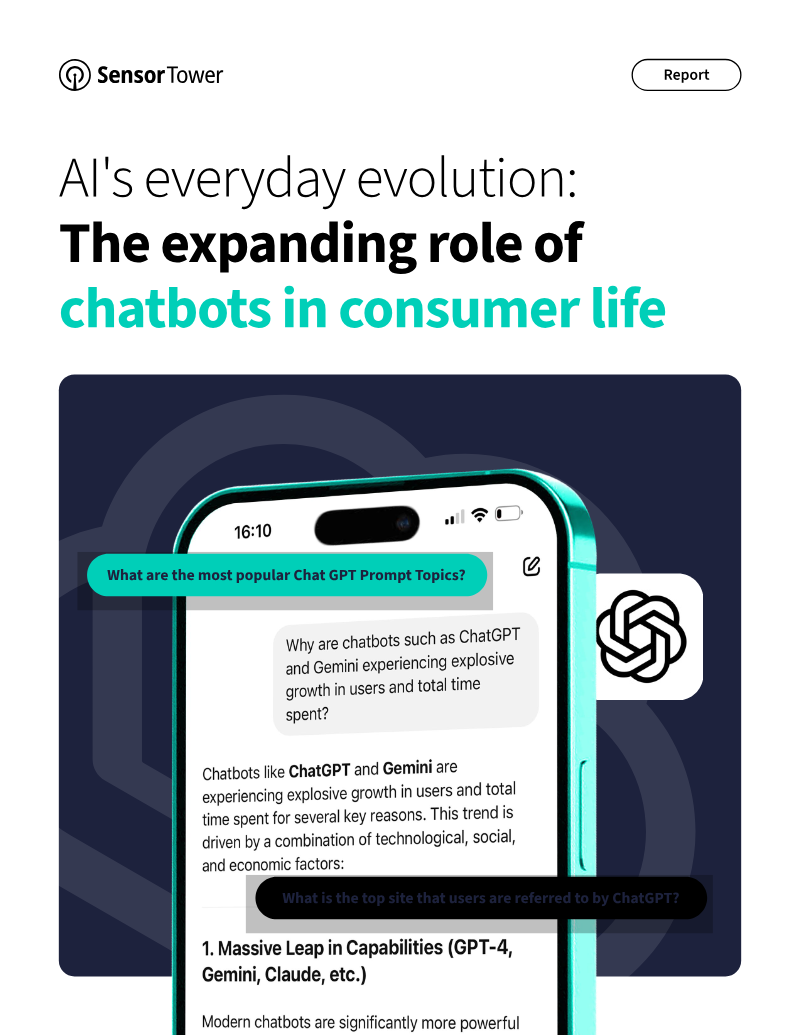
AI's Everyday Evolution: The Expanding Role of Chatbots in Consumer Life
The rapid expansion of artificial intelligence chatbots is fundamentally altering consumer behavior, signaling a shift away from the long-standing dominance of traditional search engines. By early 2025, OpenAI’s ChatGPT reached 500 million global monthly active users, achieving this milestone faster than any app in the last decade. This growth is accompanied by a significant increase in engagement; in April 2025, ChatGPT saw a 60% rise in session frequency and a 270% jump in web visits, while traditional search engines experienced a 3% decline in user engagement metrics.
The demographic profile of AI users is evolving from technical early adopters to mainstream consumers. This transition is reflected in the shifting nature of user prompts. While software development queries accounted for 44% of prompts in early 2024, they fell to 29% by 2025. Conversely, categories such as economics, finance, and taxes saw a substantial increase, rising 9 percentage points year-over-year. This suggests that consumers are increasingly relying on AI for complex personal tasks, including investment planning and tax preparation.
Data indicates that chatbots are becoming powerful engines for web traffic and commerce. The top referral destinations from ChatGPT include YouTube, Wikipedia, and the National Library of Medicine, with Amazon ranking fourth. This positioning highlights the growing role of AI in driving purchase intent and informational discovery. While early adopters of AI have already reduced their time spent on Google apps by approximately 6%, more recent converts have yet to show a material change in search habits, suggesting that the erosion of traditional search dominance may accelerate as user habits solidify over time.
- ChatGPT reached 500 million global monthly active users by early 2025, marking the fastest growth for any application in the last decade.
- In April 2025, ChatGPT experienced a 60% increase in session frequency and a 270% jump in web visits, while traditional search engine engagement declined by 3%.
- The utility of AI is shifting from technical tasks to complex personal management, with software development prompts dropping from 44% to 29% of the total share between early 2024 and 2025.
- Consumer reliance on AI for finance, economics, and tax preparation grew by 9 percentage points year-over-year, signaling a move toward mainstream adoption for high-stakes personal tasks.
- Chatbots are emerging as significant drivers of web traffic and commerce, with YouTube, Wikipedia, the National Library of Medicine, and Amazon serving as the top referral destinations.

Sensor Tower Global Mobile Gaming Industry Outlook 2024
Global mobile gaming experienced a minor 2% year-on-year decline in in-app purchase revenue in 2023, totaling $76.7 billion. Despite this slight contraction, the market remains 22% larger than pre-pandemic levels in 2019. Projections indicate a recovery to $78 billion in 2024, with a long-term growth trajectory expected to surpass $100 billion by 2028 at an average annual growth rate of 6.8%. These findings are based on Sensor Tower App Performance Insights, covering the App Store and Google Play across major global markets including the United States, China, Japan, and South Korea.
The industry is currently defined by a shift in consumer spending from mid-core and hardcore titles toward casual and hybrid-casual models. Casual game revenue grew 8% to $28.6 billion in 2023, now accounting for 38% of the global market. Hybrid-casual games showed the most aggressive growth, increasing 30% to exceed $2.1 billion. In contrast, traditional high-revenue genres like RPGs and Strategy games both saw 10% revenue declines as the pandemic-era stay-at-home boost faded. Despite these drops, RPGs and Strategy remain the largest individual segments, generating $20 billion and $14.8 billion respectively.
Geographically, the United States remains the largest market at $22.2 billion, followed by the Chinese iOS market at $15.1 billion. While the Japanese and South Korean markets saw declines of 13% and 7% respectively, specific titles defied broader trends. MONOPOLY GO! and Royal Match emerged as major drivers in the casual sector, with the former generating $1.2 billion and the latter surpassing Candy Crush Saga in monthly revenue. In the mid-core space, new entrants like Honkai: Star Rail and Whiteout Survival achieved significant growth, particularly in APAC markets, by utilizing innovative themes and integrated gameplay mechanics.
- Global mobile gaming revenue reached $76.7 billion in 2023, a 2% year-on-year decline, but is projected to recover to $78 billion in 2024 and exceed $100 billion by 2028.
- Consumer spending is shifting toward casual and hybrid-casual models, with casual revenue growing 8% to $28.6 billion and hybrid-casual revenue surging 30% to over $2.1 billion.
- Traditional high-revenue segments, specifically RPGs and Strategy games, experienced a 10% decline in 2023, though they remain the largest categories at $20 billion and $14.8 billion respectively.
- The United States remains the top global market with $22.2 billion in revenue, followed by the Chinese iOS market at $15.1 billion.
- Casual titles like MONOPOLY GO!, which generated $1.2 billion, and Royal Match, which surpassed Candy Crush Saga in monthly revenue, are currently driving market growth.

Global Games Market Report
The global games market is entering a period of stabilization and renewed growth, with 2023 revenues projected to reach $184.0 billion. This recovery follows a post-pandemic correction and is supported by a massive player base of 3.31 billion people worldwide. While the industry faces macroeconomic pressures and shifting privacy regulations, long-term forecasts remain positive, with total revenues expected to climb to $205.4 billion by 2026. This trajectory is fueled by the maturation of the current console generation, the expansion of the middle class in emerging markets, and the increasing influence of transmedia strategies that drive engagement across multiple entertainment formats.
Market dynamics are shifting significantly across different platforms and regions. Mobile gaming remains the largest revenue segment at $89.7 billion, yet it is currently experiencing a 1.4% decline as privacy policies complicate user acquisition and monetization, particularly within the RPG genre. In contrast, the PC and console segments are the primary growth engines for 2023, benefiting from a steady supply of hardware and a robust slate of high-profile releases. Geographically, the Asia-Pacific region maintains its dominance, accounting for 46% of global revenue, even as regulatory hurdles in China slow its immediate growth. Meanwhile, significant capital infusions, such as Saudi Arabia’s $38 billion investment through Savvy Games Group, are reshaping the competitive landscape.
Technological and structural transformations are further defining the industry's future. Generative AI is emerging as a pivotal tool for managing the rising costs of AAA development, though its adoption is tempered by concerns over copyright and workforce impact. Revenue models have transitioned almost entirely to digital formats, with physical sales becoming negligible in the PC market and live-service models dominating console engagement. As the industry evolves, the rise of cloud gaming and handheld "complementary devices" like the Steam Deck are expanding how and where players interact with content, ensuring the market remains resilient despite shifting regulatory and economic conditions.
- The global games market is projected to reach $184.0 billion in 2023, with a forecast to grow to $205.4 billion by 2026 supported by a 3.31 billion-person player base.
- Mobile gaming remains the largest revenue segment at $89.7 billion, though it is currently experiencing a 1.4% decline due to privacy-related challenges in user acquisition and monetization.
- PC and console gaming are the primary industry growth engines for 2023, driven by improved hardware supply and a strong pipeline of high-profile software releases.
- The Asia-Pacific region continues to dominate the global market with 46% of total revenue, despite regulatory headwinds currently impacting growth in China.
- Large-scale capital investments, such as the $38 billion commitment from Saudi Arabia’s Savvy Games Group, are actively reshaping the competitive landscape.