Video Game
Game
Documents about Video Game
GameStop Quarterly Report: Q2 2014
GameStop Corp.'s Form 10-Q for the quarterly period ended May 3, 2014 (13 weeks, fiscal 2014 first quarter) presents unaudited condensed consolidated financial statements and management's discussion of results.
- Consolidated net sales rose 7.0% to $1,996.3 million, with the company attributing the increase primarily to comparable store sales growth of 5.8% in the Video Game Brands segments.
- New video game hardware sales increased 81.1% to $438.0 million, which the filing ties to Xbox One and PlayStation 4 launches in November 2013.
- New video game software sales decreased 20.4% to $559.9 million, which the filing attributes to fewer new titles released in the quarter.
Capcom Financial Highlights and Basic Policies: First Half of Fiscal Year Ending March 31, 2010
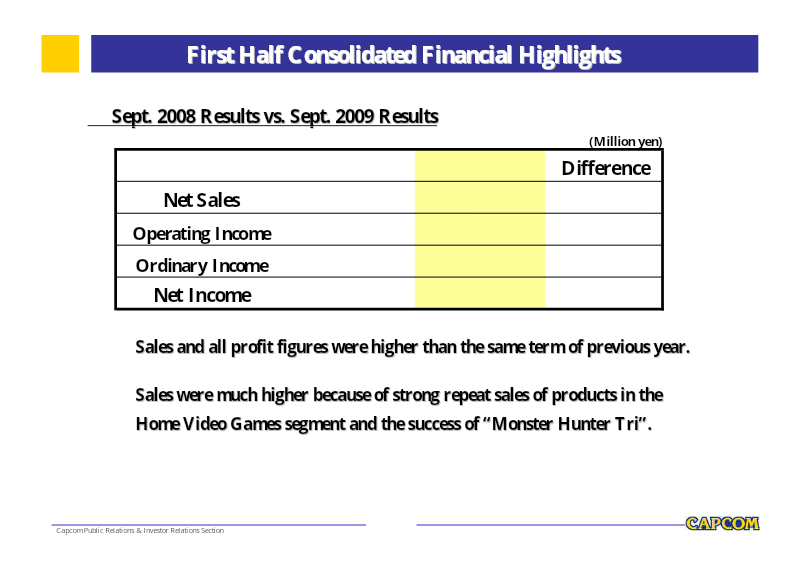
The Capcom financial report for the first half of the fiscal year ending March 31, 2010, details a period of strong growth driven primarily by the company’s Home Video Game segment.
- Capcom achieved net sales of 38,892 million yen for the first half of fiscal year 2010, a significant increase from the 31,236 million yen reported in the same period of the previous year.
- Operating income rose to 5,574 million yen, up from 3,357 million yen, driven by the success of the Monster Hunter series and company-wide cost-cutting initiatives.
- A resolved transfer pricing dispute with Japanese and U.S. tax authorities will provide a 2 billion yen earnings boost in the third quarter via tax refunds.


Capcom Consolidated Financial Results: Q1 Ending June 30, 2006
Capcom’s consolidated financial results for the first quarter ending June 30, 2006, reflect a period of strategic transition within the global video game industry.
- Capcom achieved significant profit growth in Q1 2006 despite a 7.5% decline in net sales to 10,571 million yen, with operating income rising 48.0% to 1,320 million yen and net income increasing 32.9% to 808 million yen.
- Profitability improvements were primarily driven by a reduction in the cost of goods sold and development expenses, offsetting the impact of a slowdown in the home console market.
- The Arcade Operations and Arcade Game Sales segments were key growth drivers, with net sales increasing by 14.4% and 55.2% respectively, bolstered by the success of the Gundam series.


Summary of Consolidated Financial Results for the 1st Quarter: Fiscal Year Ending March 31, 2006
Capcom’s consolidated financial results for the first quarter of the fiscal year ending March 31, 2006, reflect a period of transition within the global video game industry.
- Capcom achieved a net profit of 608 million yen for the quarter ending June 30, 2005, marking a 19.5% increase despite a 4.1% decline in total net sales to 11,431 million yen.
- The newly formed Contents Expansion Business, covering mobile content and pachislo machine displays, drove significant growth with sales increasing by 830.4% and operating income rising by 736.3%.
- The Home Video Game segment struggled due to a lack of flagship titles and industry-wide hardware transition, resulting in a 34.4% decline in segment sales.


Capcom Consolidated Financial Results: 3rd Quarter FY2005
Capcom’s consolidated financial results for the third quarter of the fiscal year ending March 31, 2005, reflect a period of growth driven by a recovering domestic video game market and strong performance across multiple business segments.
- Capcom reported net sales of 42,499 million yen for the third quarter of FY2005, an 8.6% increase year-over-year, alongside a 23.8% rise in operating income to 3,854 million yen.
- The 'Other Businesses' segment, primarily driven by LCD devices for Pachislo machines, saw the highest growth with a 67.4% increase in sales and a 58.3% increase in operating income.
- Arcade Game Sales grew by 29.0% in net sales and 10.8% in operating income, supported by strong performance in medal games and synergy with home console titles.


Capcom Annual Report 1998
Capcom's 1998 annual report covers the fiscal year ended March 31, 1998, for Capcom Co., Ltd. and its consolidated subsidiaries, a Japanese video game company operating in arcade games, home video games, and amusement facilities.
- Consolidated net sales rose 39.7% to ¥58,201 million, mainly due to increased sales in the Home Video Game Division following the launch of Resident Evil 2 and other software.
- The company posted a net loss of ¥4,760 million, reversing the prior year's net income of ¥502 million, after special losses totaling ¥13 billion.
- Operating income increased 94.7% to ¥10,423 million from ¥5,353 million.


Capcom Financial Highlights and Basic Policies: First Half of Fiscal Year Ending March 31, 2009
The financial results for the first half of the fiscal year ending March 31, 2009, demonstrate that Capcom achieved growth in net sales and all earnings categories compared to the same period in the previous year.
- Capcom achieved growth across all earnings categories for the first half of FY2009, with net sales reaching 31.2 billion yen and operating income rising to 3.3 billion yen.
- While total sales missed internal projections due to a sharp decline in the Pachinko and Pachislo business, all income categories exceeded planned targets thanks to strong repeat sales in the Home Video Game segment.
- Ordinary income was bolstered by 900 million yen in non-operating gains, specifically 400 million yen in interest income and 500 million yen in foreign exchange gains.