Tencent Holdings Limited delivered a robust fiscal year in 2010, reporting consolidated revenue of RMB 19.65 billion—an increase of nearly 58% over 2009—and net profit attributable to equity holders of RMB 8.05 billion, up 56% year‑on‑year. Growth was driven primarily by the online gaming segment, which generated RMB 15.48 billion in revenue (up 62%) and by a rapidly expanding user base, with instant‑messaging accounts reaching 647.6 million and Qzone users at 492 million. Mobile services, value‑added telecom offerings, and advertising also contributed to the revenue mix, while operating margins improved to 50% of earnings.
Liquidity and capital structure remained strong. Total financial resources rose to RMB 22.1 billion, with cash and equivalents at RMB 10.4 billion and net financial resources of RMB 17.8 billion after short‑term borrowings. Capital expenditures doubled to RMB 2.01 billion, reflecting investment in infrastructure and new platforms. Share‑based compensation was significant; the company granted 4.85 million award shares in 2010, with no director awards, and maintained a share‑option pool of roughly 43 million shares. Governance structures were reinforced through independent remuneration, audit, and investment committees, and the board maintained a majority of non‑executive directors.
Financial risk exposure was dominated by foreign‑exchange and interest‑rate sensitivities, with a 5 % currency swing estimated to affect profit by RMB 83 million. The gearing ratio increased from 30% to 39%, driven largely by bank borrowings, while fair‑value assets—primarily equity securities—remained level 2 instruments. Overall, Tencent’s 2010 performance underscored its ability to scale user engagement and diversify revenue streams while maintaining solid liquidity, disciplined capital allocation, and robust governance practices.
Tencent · 2024
Tencent · 2024

Tencent · 2022
Tencent · 2021
Tencent
Tencent
Tencent
Tencent
Tencent
Tencent
Tencent
Tencent
GREE
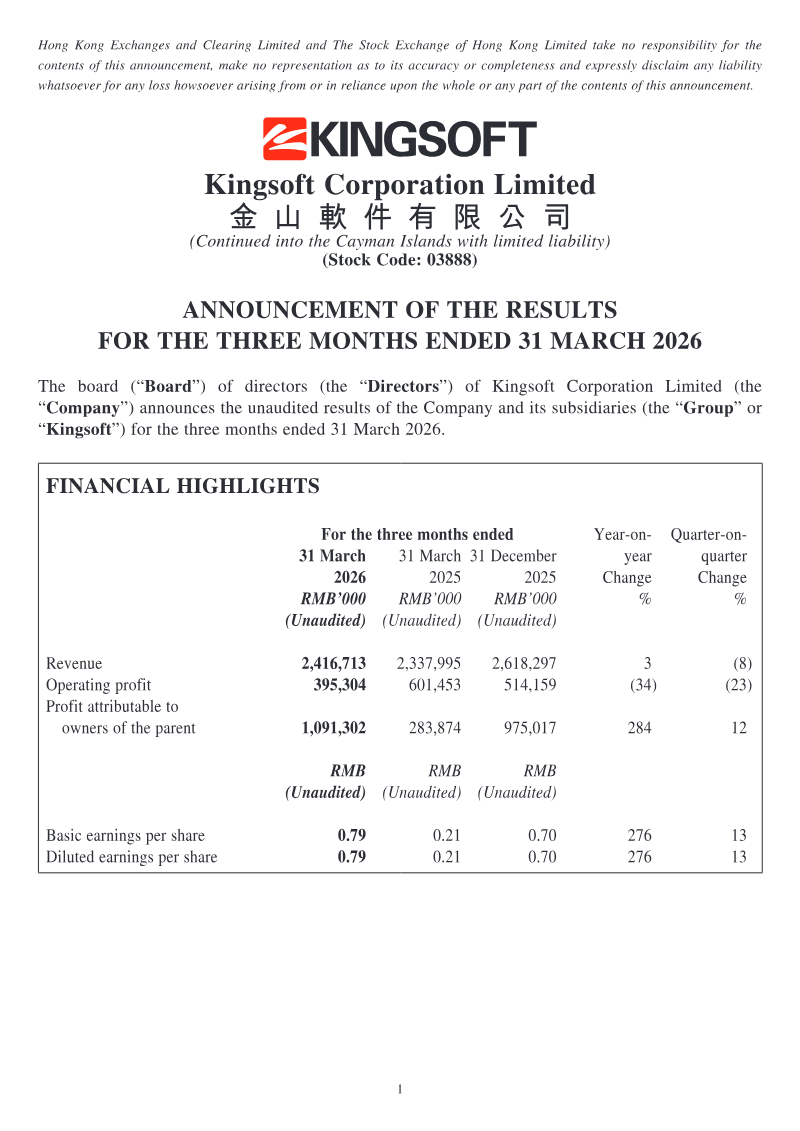
Kingsoft Corporation
Tencent
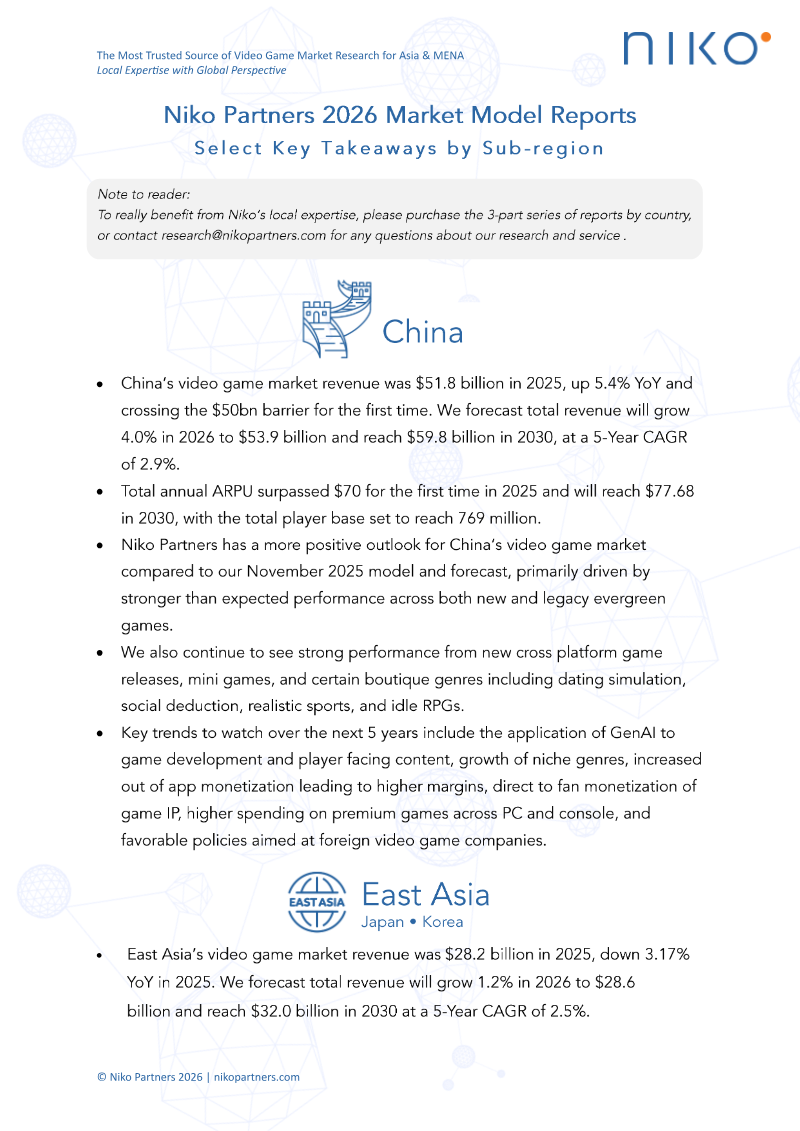
Niko Partners · 2026
Giant Network Group · 2026

Archosaur Games · 2026
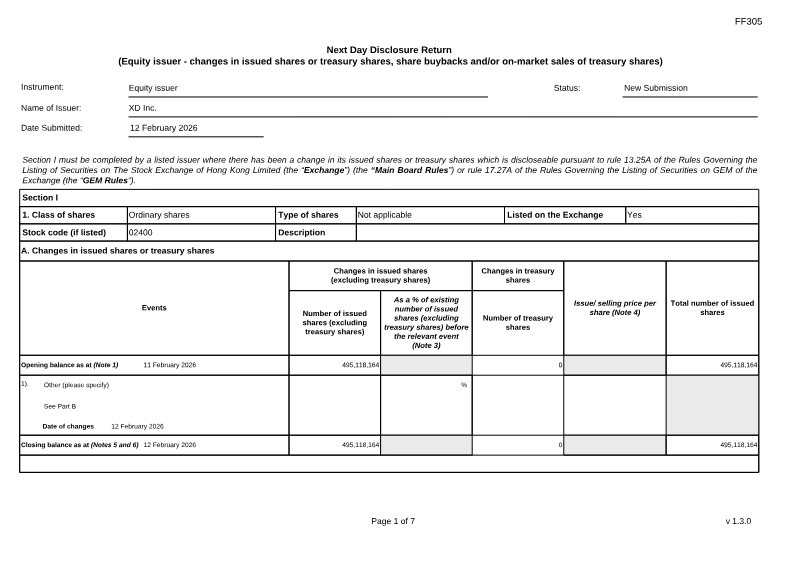
Stock Exchange of Hong Kong · 2026

Stillfront Group · 2026
Meridian Play · 2026
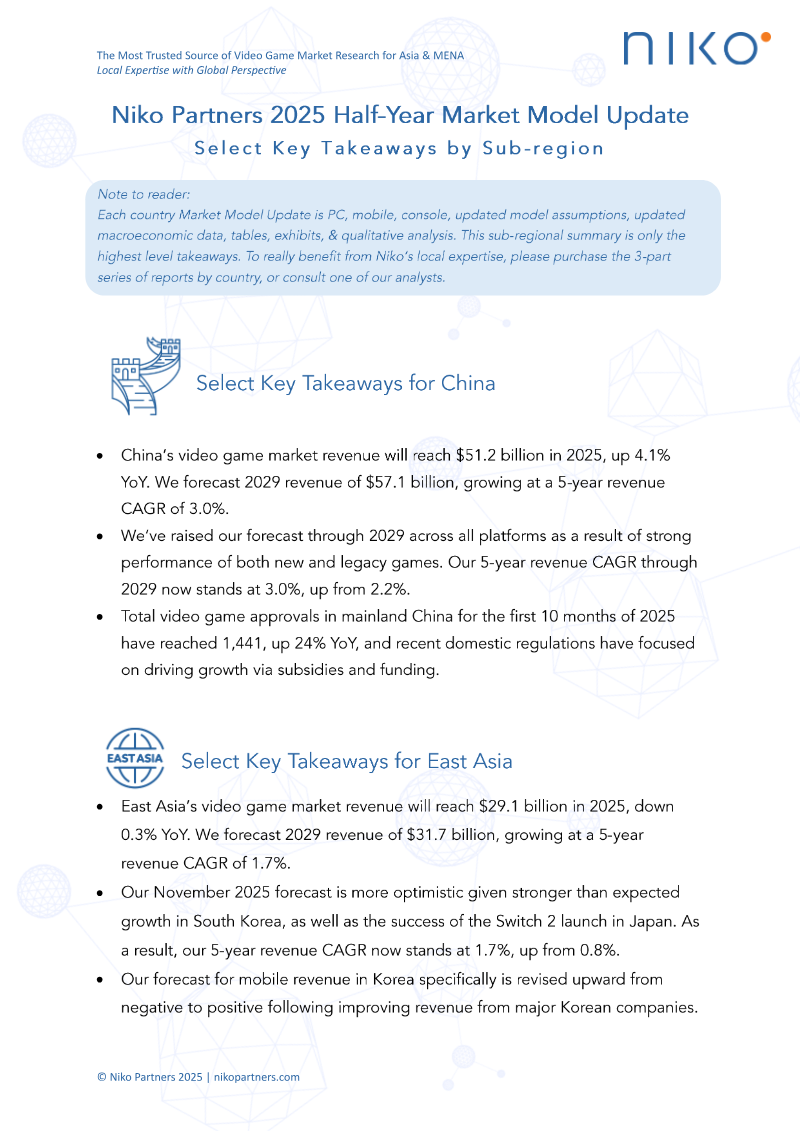
Niko Partners · 2025

Sea Limited · 2024
Pangle · 2021