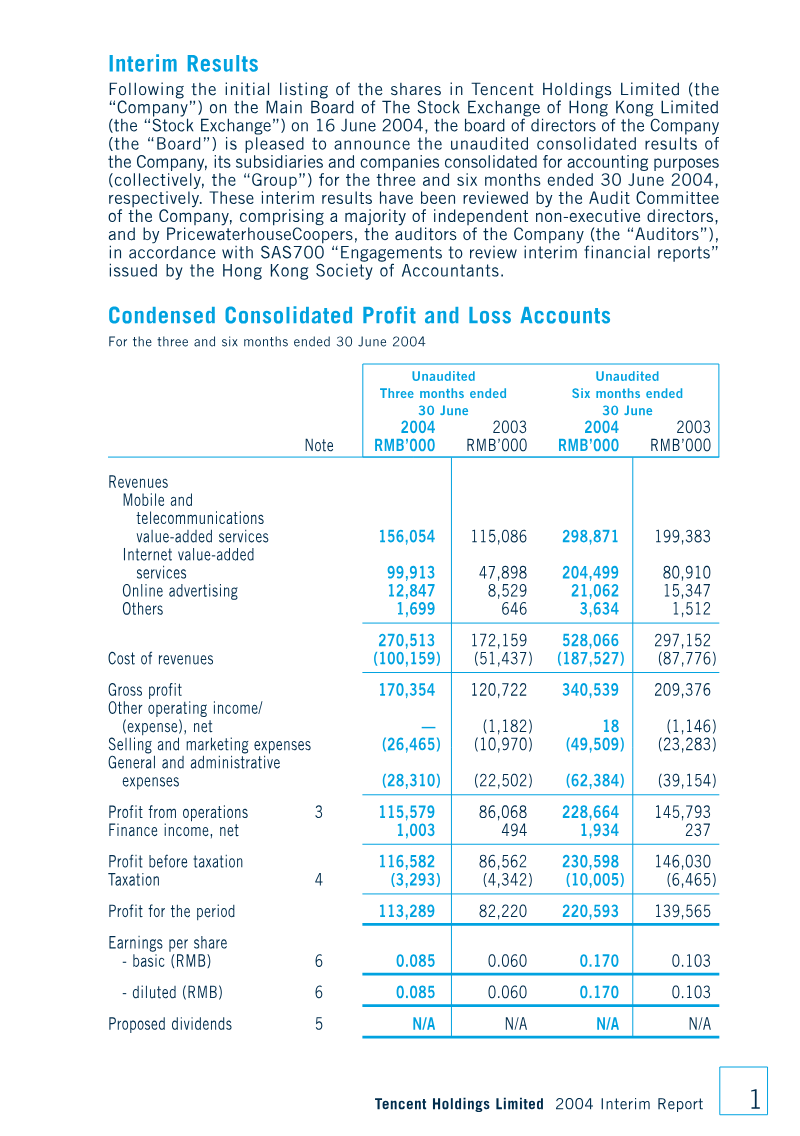
Tencent Holdings Limited demonstrated robust financial expansion during the first half of 2008, characterized by an 84.8% year-over-year revenue increase to RMB 3.03 billion. This growth was underpinned by a significant rise in active user accounts, which reached 341.9 million by mid-year. Profit for the period climbed to RMB 1.19 billion, reflecting a strong 40.8% profit margin. The company’s performance was primarily driven by the scaling of internet value-added services, particularly online gaming and community platforms, alongside sustained growth in mobile telecommunications and online advertising.
Operational scaling necessitated increased investment in human capital and infrastructure, leading to higher employee benefit costs and research and development expenditures. The workforce expanded to 5,168 employees, with total remuneration costs reaching RMB 593.6 million. Despite these rising operational expenses and the transition to a unified 25% PRC enterprise income tax rate, the company maintained a solid balance sheet with total assets of RMB 8.20 billion and a stable gearing ratio of 24%. Strategic initiatives during this period included the acquisition of mobile value-added service providers and equity interests in various international and domestic gaming entities, further diversifying the company's portfolio.
The company navigated a complex macroeconomic environment, including the appreciation of the RMB against the USD and HKD, which resulted in exchange losses, and potential headwinds from a slowing Chinese economy. Governance remained stable, with MIH China (BVI) Limited serving as the largest shareholder at 35.08%. Through a combination of share repurchases and a share award scheme, the company continued to manage its capital structure and incentivize staff, ensuring alignment with long-term growth objectives while adhering to International Accounting Standard 34.
Tencent · 2024
Tencent · 2024

Tencent · 2022
Tencent · 2021
Tencent
Tencent
Tencent
Tencent
Tencent
Tencent
Tencent
Tencent
GREE
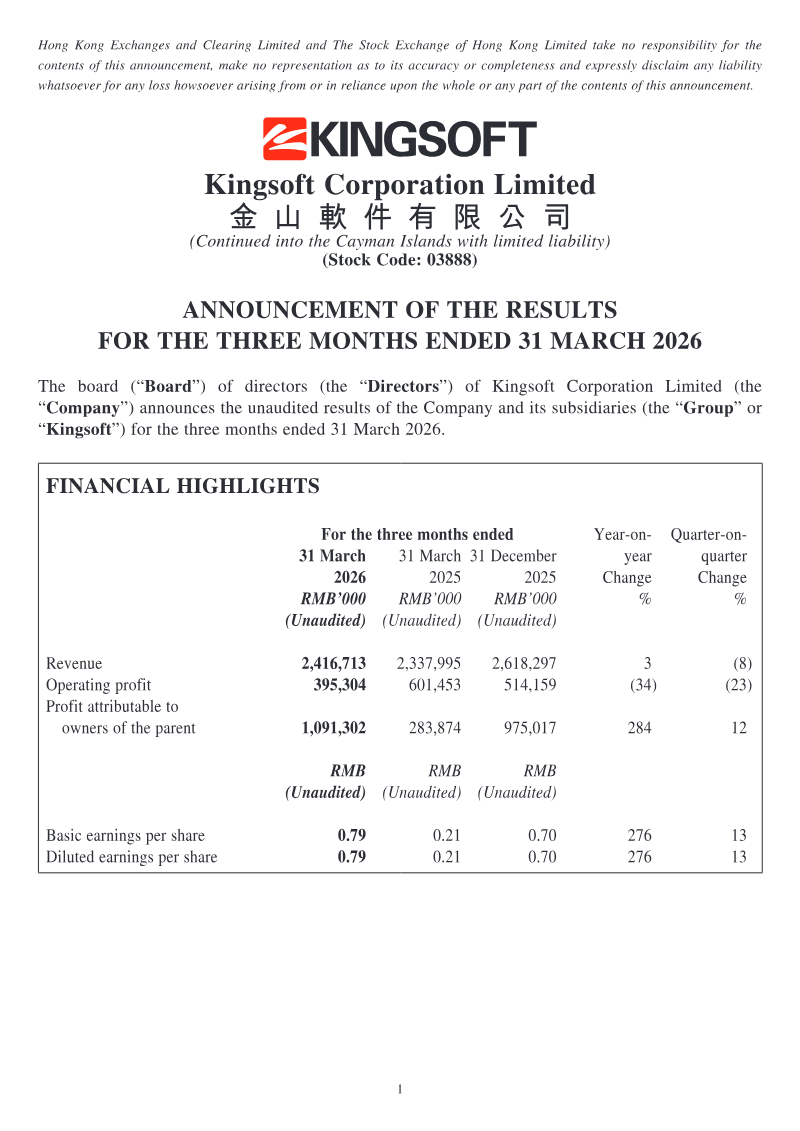
Kingsoft Corporation
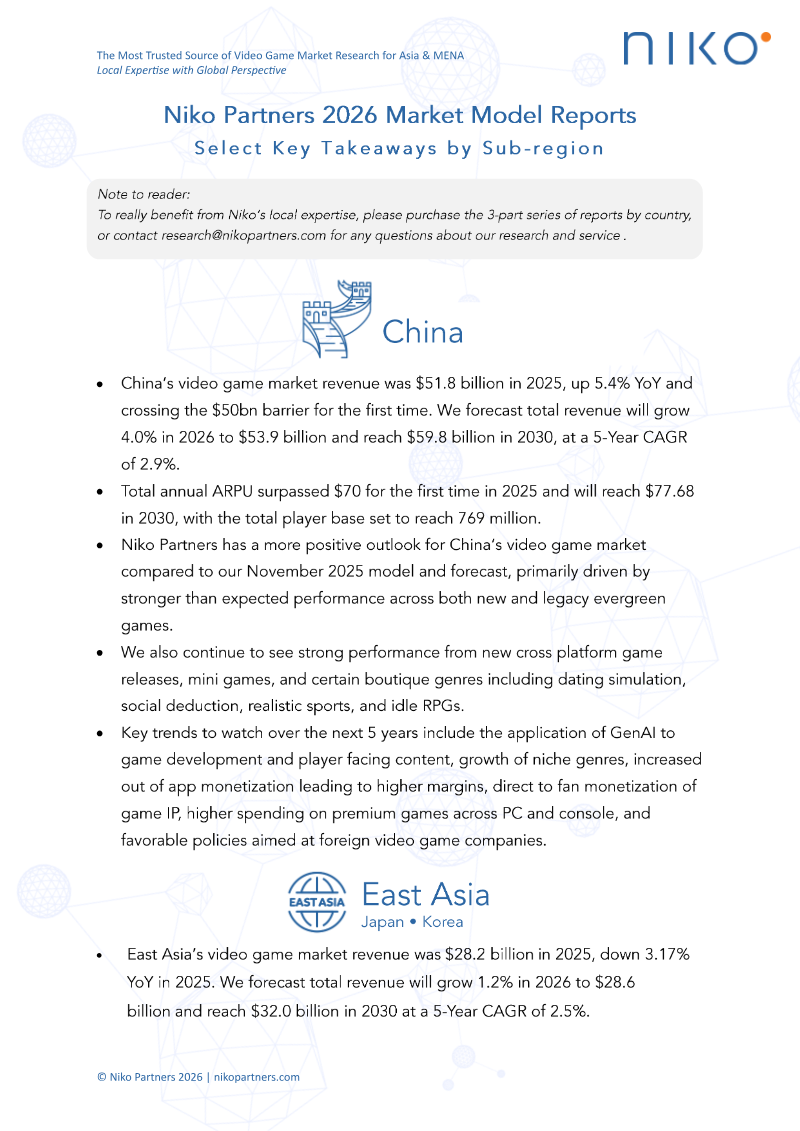
Niko Partners · 2026
Giant Network Group · 2026

Archosaur Games · 2026
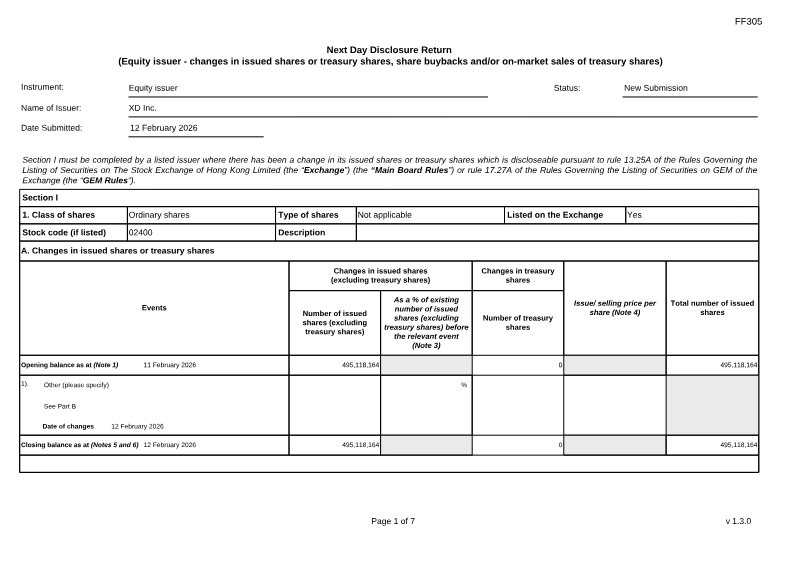
Stock Exchange of Hong Kong · 2026

Stillfront Group · 2026
Meridian Play · 2026
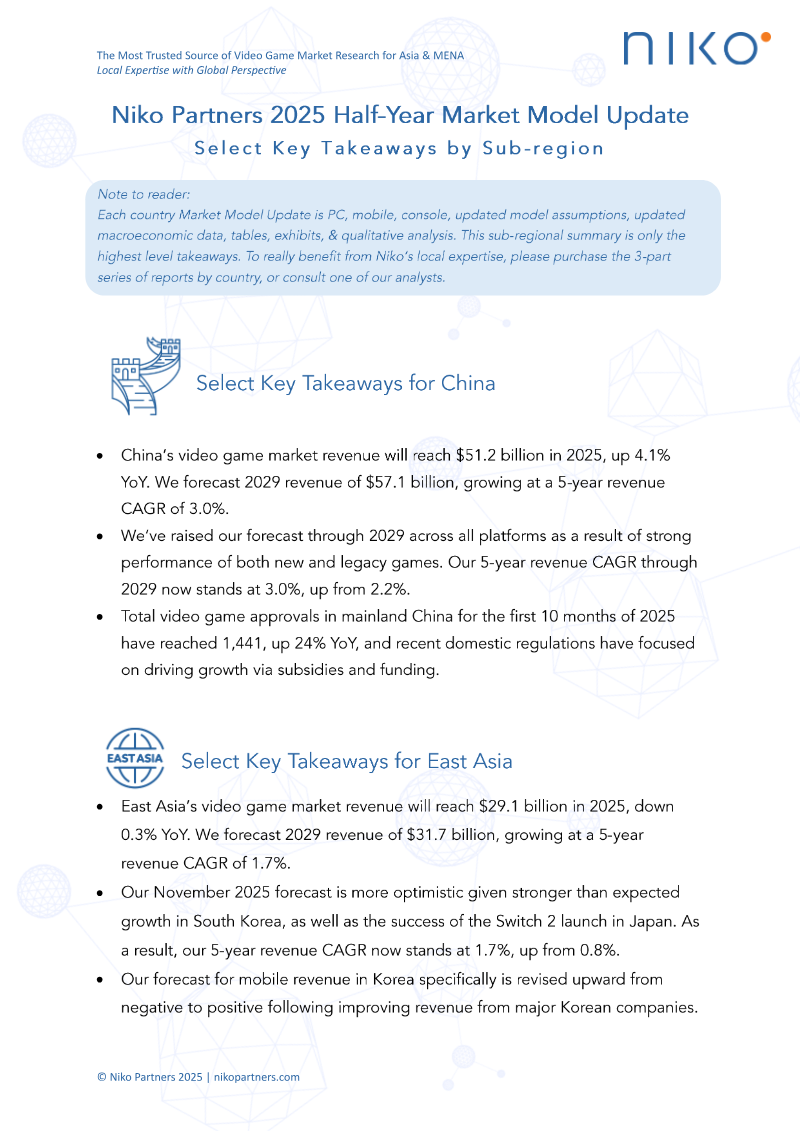
Niko Partners · 2025

Sea Limited · 2024
Pangle · 2021