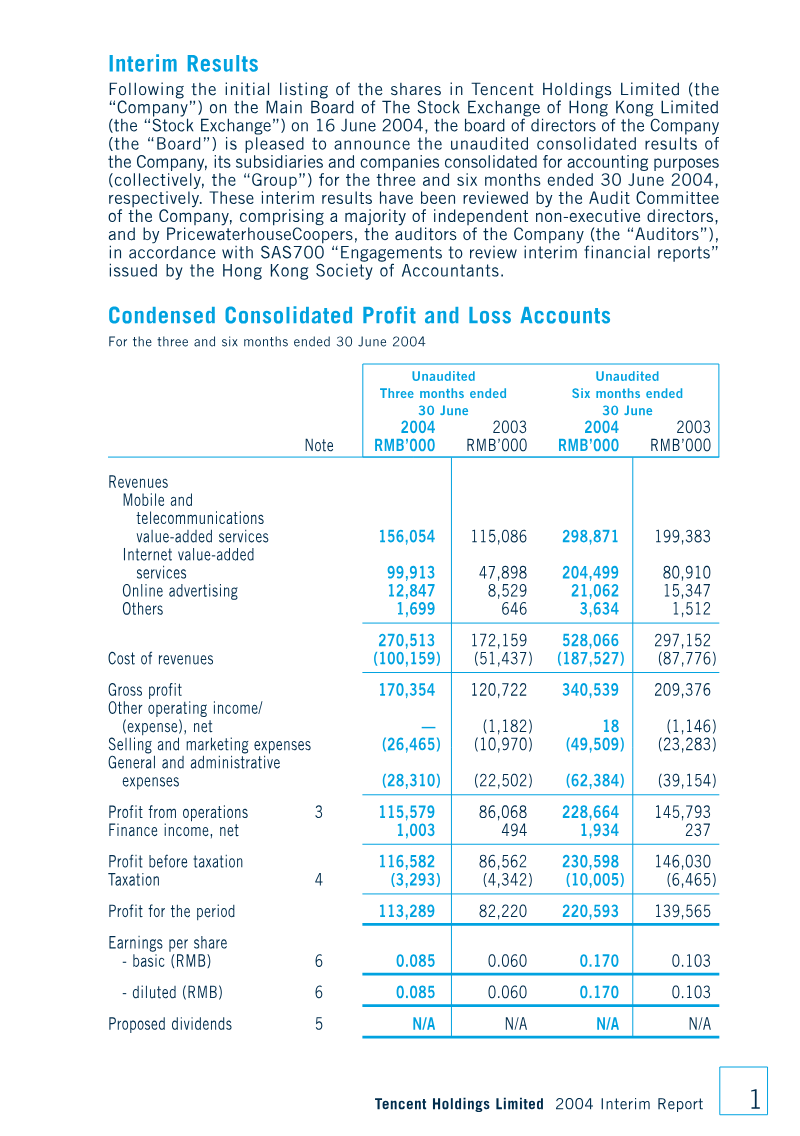
Tencent Holdings reported a robust 2005 performance, with revenue rising 24.7 % to RMB1.426 billion driven by a 79.2 % increase in Internet value‑added services and a 105.9 % jump in online advertising, while mobile‑telecom services declined 19.3 %. Net profit climbed 10 % to RMB485 million, yielding earnings per share of RMB0.274 (basic) and RMB0.267 (diluted). The QQ instant‑messaging platform expanded to over 200 million active users, and new services such as Qzone, QQ Pet, and the MMOG QQ Fantasy contributed to revenue growth. Operating profit margin improved modestly to 33.8 % in Q4, though full‑year operating profit increased only 3.3 % due to higher selling, marketing and general administrative costs.
Financially, the group’s assets grew from RMB2.863 billion to RMB3.427 billion, largely through increases in cash and held‑to‑maturity investments. R&D expenditure surged to RMB162.5 million, while employee‑benefit costs more than doubled to RMB344.5 million. A net tax benefit of RMB48.3 million offset a modest tax expense, reflecting favorable Chinese enterprise income‑tax incentives. The company recorded a foreign‑exchange loss of RMB47 million on U.S. dollar investments, and no dividends were paid to equity holders during the year.
Governance structures remained transparent: a balanced board of five directors, independent audit and remuneration committees, and compliance with Hong Kong listing rules (except for the chairman/CEO dual role). Share‑option schemes were detailed, allowing up to 40.5 million shares post‑IPO with a ten‑year life and board‑determined vesting periods. No material conflicts of interest or significant director‑held contracts were disclosed.
The report covered IFRS adoption, noting minimal impact from revised standards; IAS 39 reclassified certain financial assets to fair value, IFRS 2 introduced share‑based compensation charges, and IAS 38 governed goodwill from acquisitions. Accounting policies for financial instruments, derivatives, inventory, receivables, and employee benefits were outlined, ensuring consistency with IFRS. Overall, Tencent’s 2005 results demonstrate strong growth in core internet services, disciplined financial management, and robust corporate governance within the Chinese market.
Tencent · 2024
Tencent · 2024

Tencent · 2022
Tencent · 2021
Tencent
Tencent
Tencent
Tencent
Tencent
Tencent
Tencent
Tencent
Tencent Holdings Limited
Giant Network Group · 2026
Aream & Co · 2026
Konvoy · 2024
Embracer Group

Koei Tecmo
Tencent
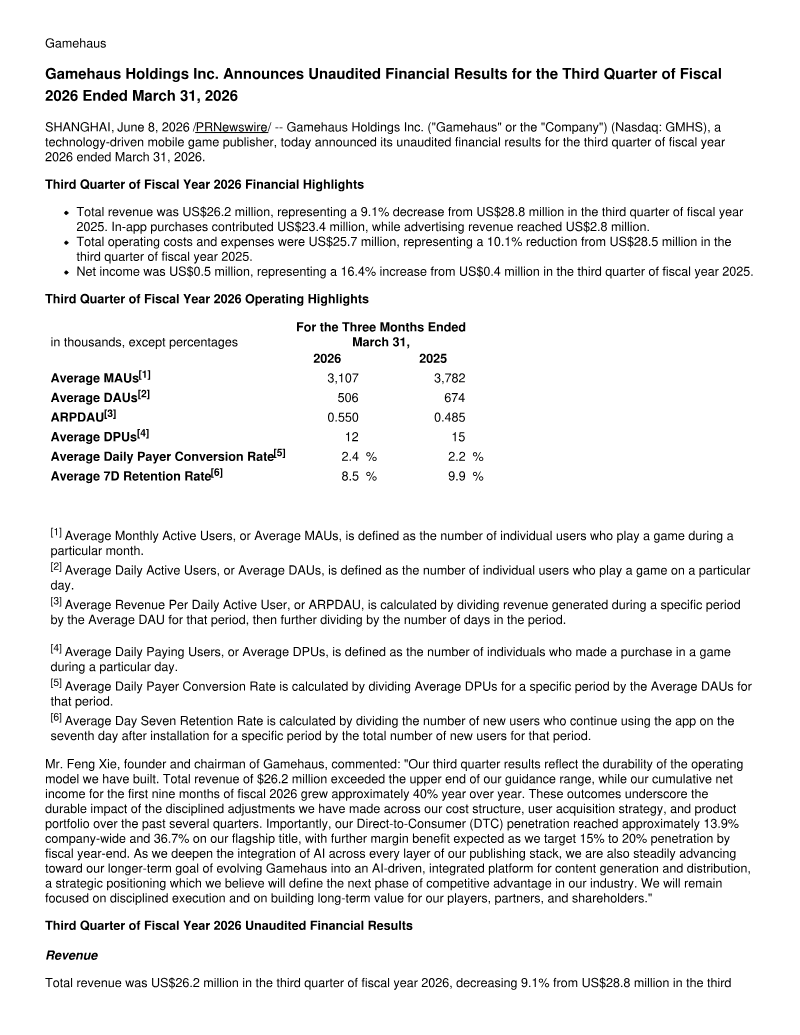
Gamehaus Holdings

Ubisoft · 2026
GameAnalytics · 2026
Pearl Abyss · 2026

Archosaur Games · 2026