FinancialStillfront Group
Stillfront Group: Q4 2025 Earnings Release
8 Feb 202612 pages~4 min full read
The release reports that Stillfront Group’s Q4 2025 performance achieved a 27 % adjusted EBITDAC margin, up from 25 % in the prior year, despite a 9.4 % decline in organic revenue to SEK 1,356 million. Europe drove the margin expansion through a new franchise launch and the divestiture of Narrative, while North America maintained an efficiency focus. MENA & APAC contributed to growth in both margin and revenue, with the SEKm portfolio delivering a 27 % margin.
Key franchises such as Supremacy, Home Design, and Jawaker remained central to the group’s strategy. The company highlighted a shift from three operating segments to a single segment structure, consolidating Europe, North America, and MENA & APAC under one umbrella to streamline reporting. This reorganisation also reduced the number of key franchises from 5 to 2 in Europe, 2 in North America, and 3 in MENA & APAC.
Free cash flow for Q4 2025 was SEK 922 million, down from SEK 1,050 million in Q4 2024, driven by a lower cash flow from operations (SEKm) and higher acquisition costs. Net debt stood at SEK 6,125 million with a leverage ratio of 2.2x against adjusted pro‑forma LTM EBITDA, indicating a moderate debt burden.
The group’s forward‑looking priorities include continued margin improvements, disciplined investment in key franchises, maintaining healthy cash flows, and ongoing strategic reviews. These initiatives aim to sustain profitability while supporting growth across its global portfolio.

Sensor Tower · 2021
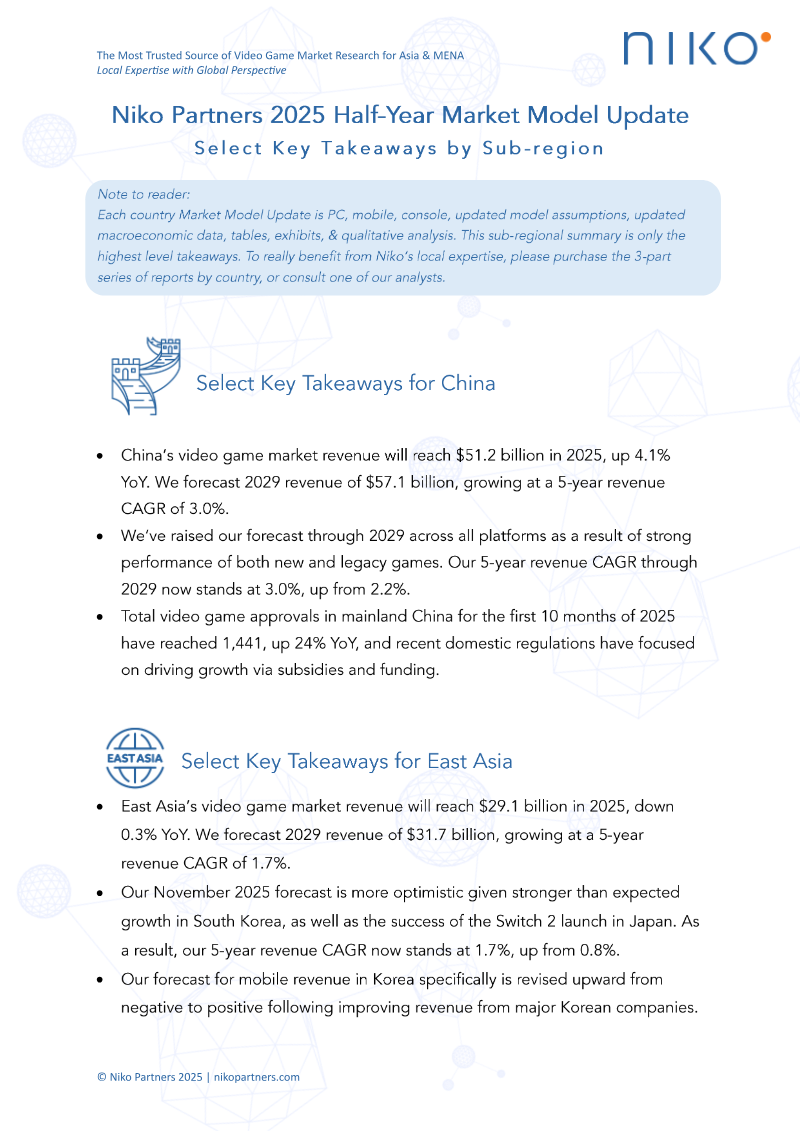
Niko Partners · 2025

Niko Partners · 2023

Sensor Tower · 2021
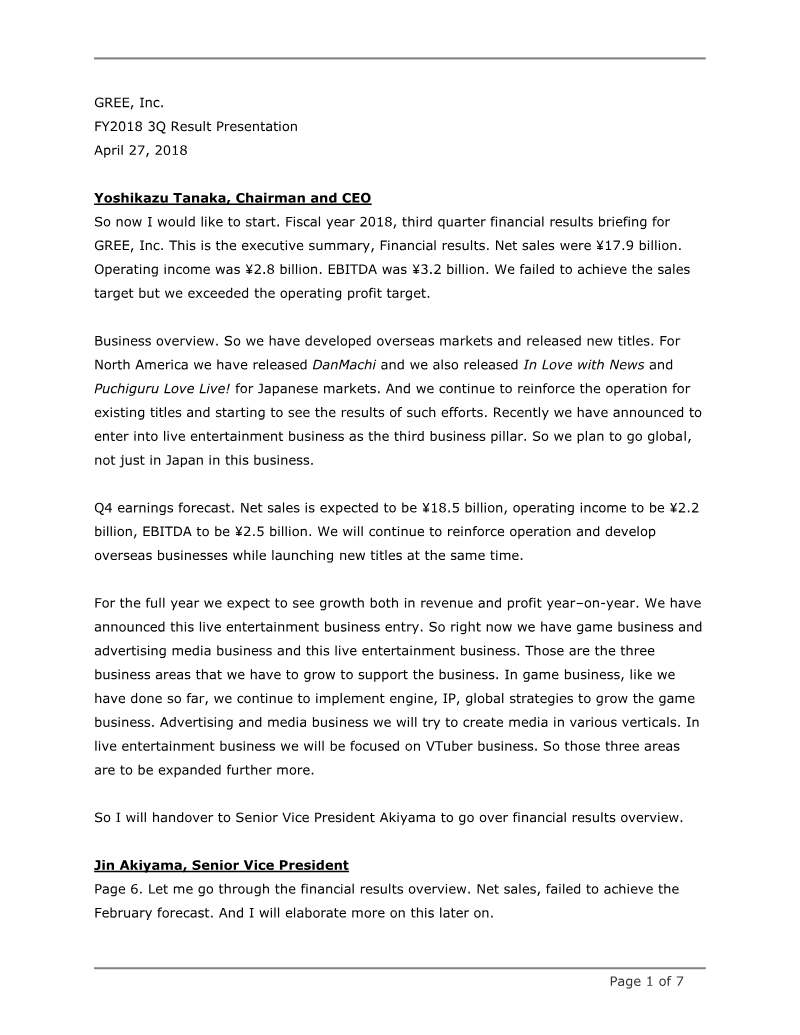
GREE · 2018
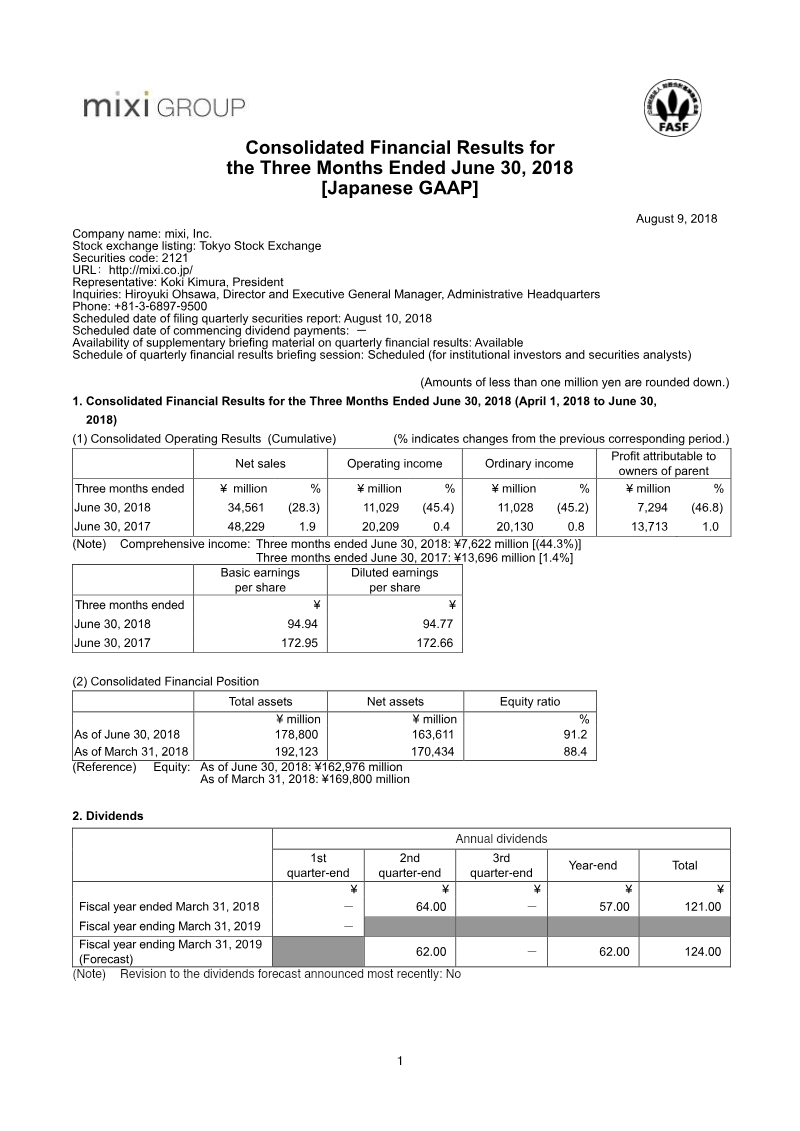
mixi
GREE
GREE

King · 2026
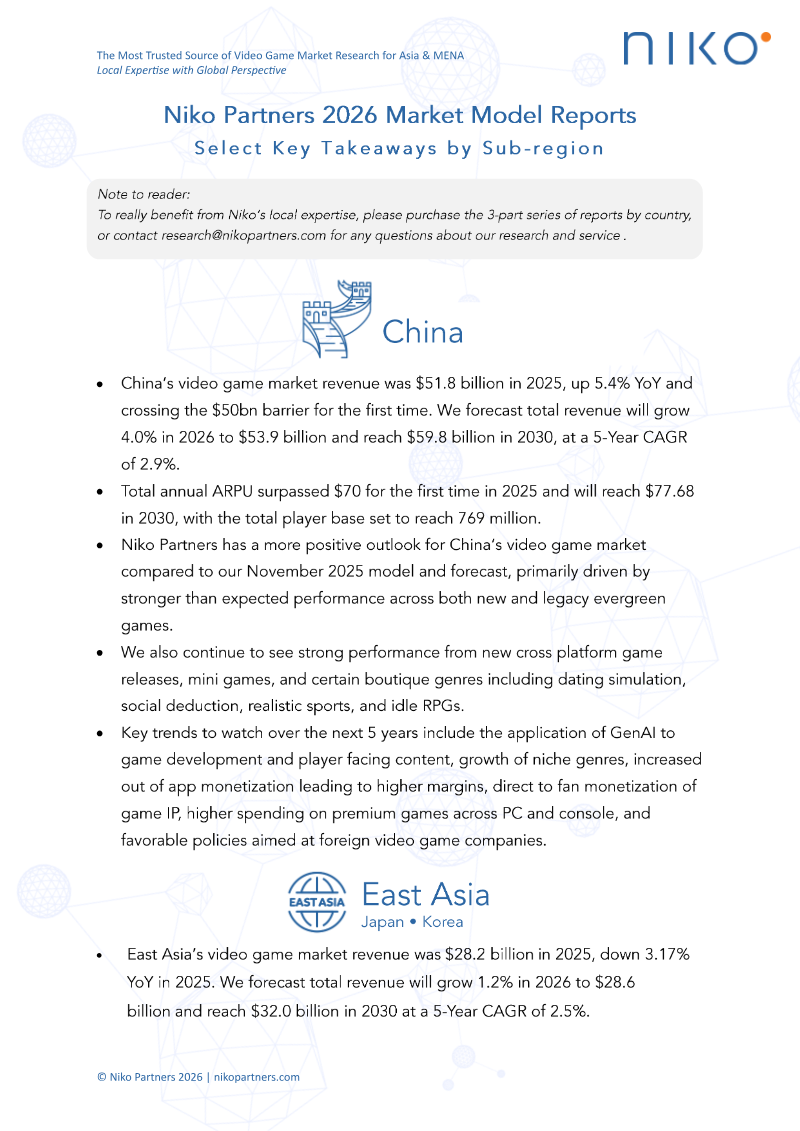
Niko Partners · 2026
Pearl Abyss · 2026
Giant Network Group · 2026