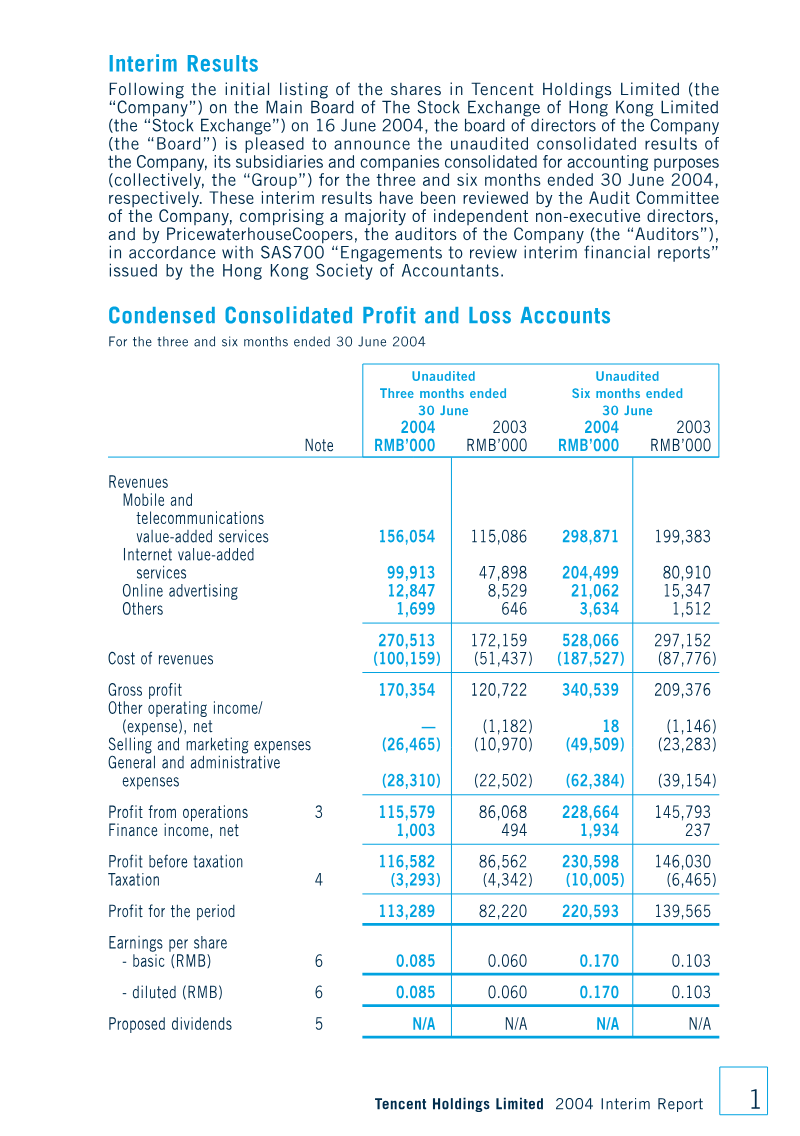
Tencent Holdings Limited demonstrated robust financial expansion during the first half of 2006, characterized by a 112.9% year-over-year revenue increase to RMB 1.35 billion. This growth was primarily fueled by the rapid scaling of internet value-added services and online advertising, which offset rising operational costs. By the end of June 2006, the company’s market reach expanded significantly, with registered instant messaging accounts climbing to 549 million. Net profit for the six-month period reached RMB 517.6 million, reflecting the successful integration of strategic acquisitions like the Joymax group and the continued monetization of the QQ.com portal.
Operational expenditures rose to RMB 801.6 million during this period, driven by intensified investments in research and development, staff benefits, and infrastructure requirements such as bandwidth and server custody. Despite these costs and a notable increase in share-based compensation expenses, the company maintained a strong liquidity position with RMB 2.7 billion in cash and investments. Capital management remained a priority, evidenced by the repurchase and cancellation of 18.3 million shares to bolster long-term shareholder value, alongside the issuance of 10.3 million shares through existing option schemes.
While the company achieved substantial gains across its core segments, it acknowledged a more challenging outlook for its wireless value-added services due to shifting regulatory policies from China Mobile. Nevertheless, the firm’s diversified revenue model and commitment to corporate governance standards provide a stable foundation for navigating these industry headwinds. By balancing aggressive R&D investment with disciplined financial management and strategic acquisitions, the company solidified its position as a dominant force in the Chinese internet services market throughout the first half of 2006.
Tencent · 2024
Tencent · 2024

Tencent · 2022
Tencent · 2021
Tencent
Tencent
Tencent

Tencent
Tencent
Tencent
Tencent
Tencent
XD
Kingsoft Corporation
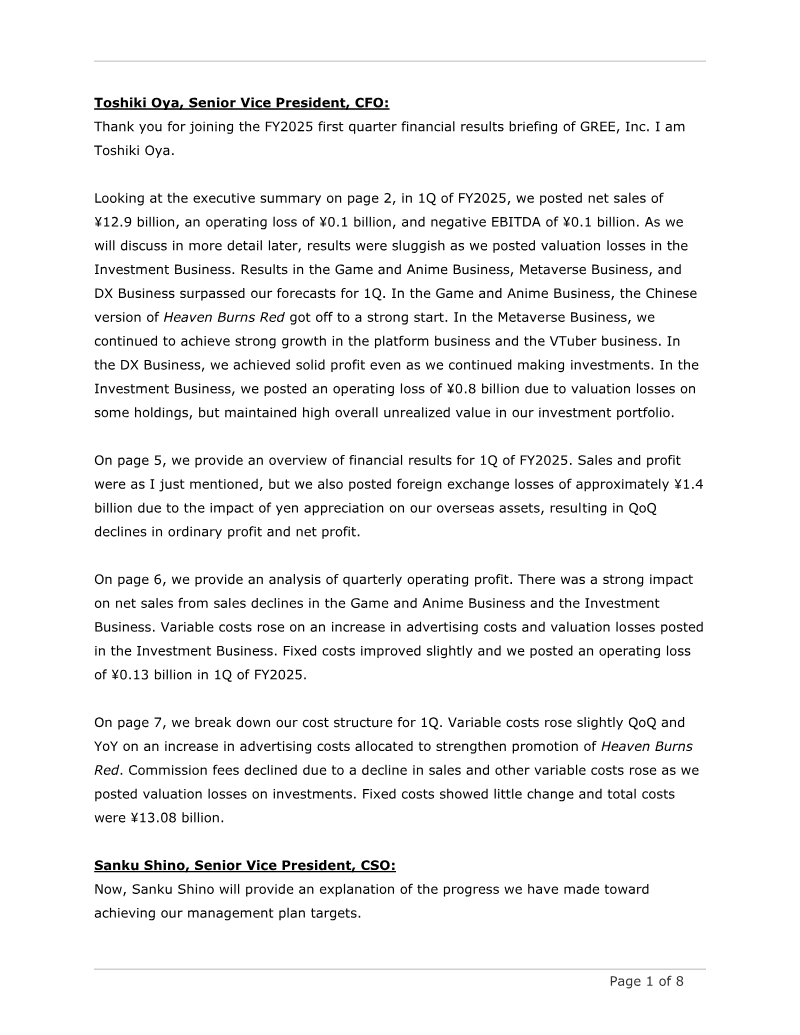
GREE
Tencent
Tencent Holdings Limited
IGG
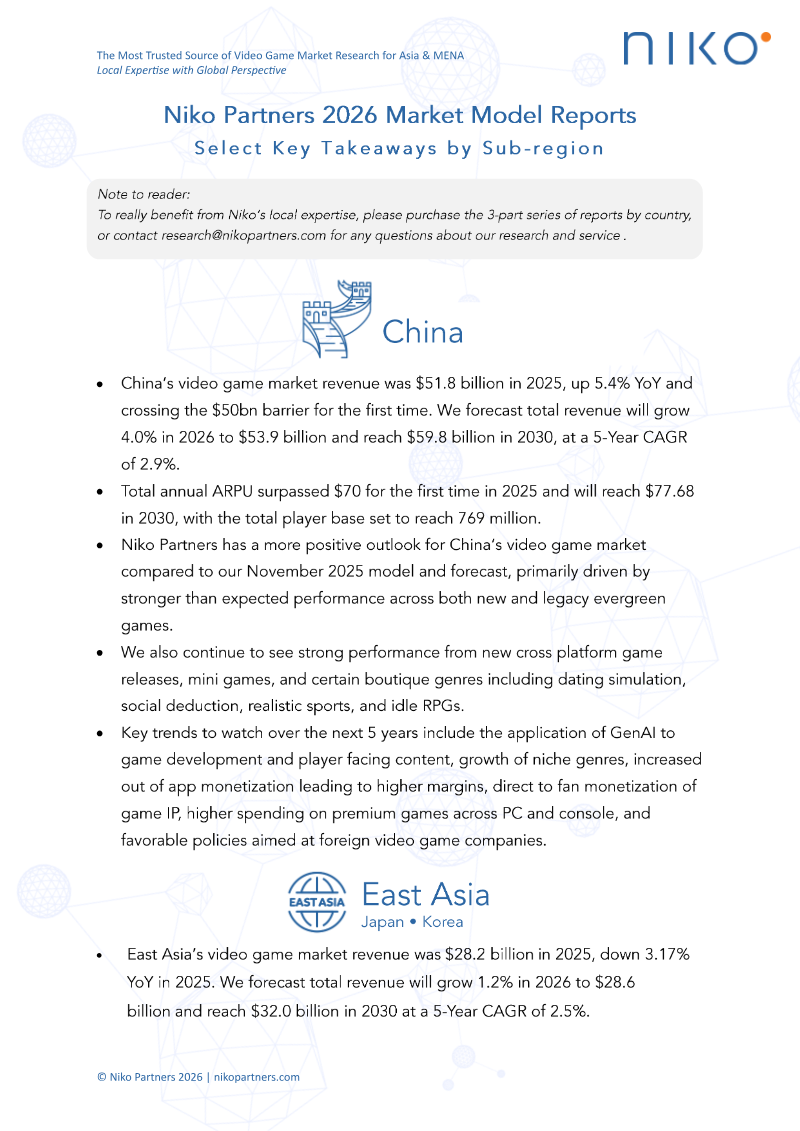
Niko Partners · 2026
Giant Network Group · 2026

Archosaur Games · 2026
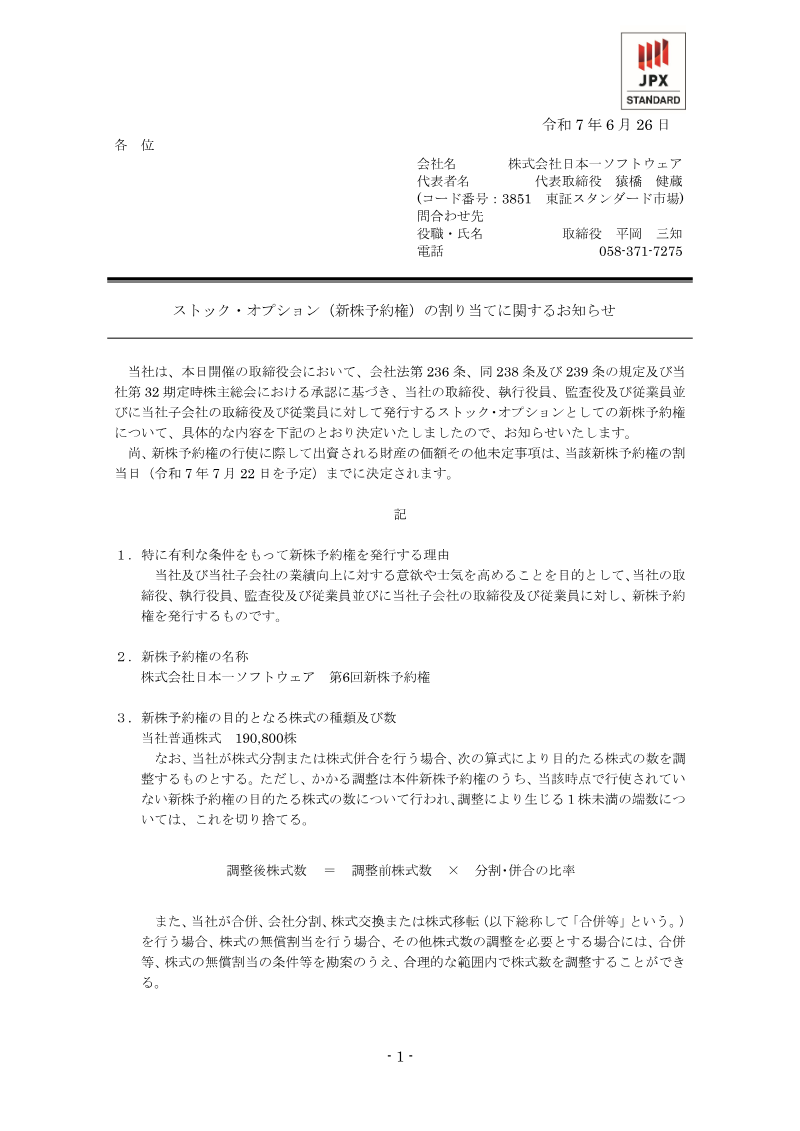
Nippon Ichi Software · 2026
Stock Exchange of Hong Kong · 2026

Stillfront Group · 2026