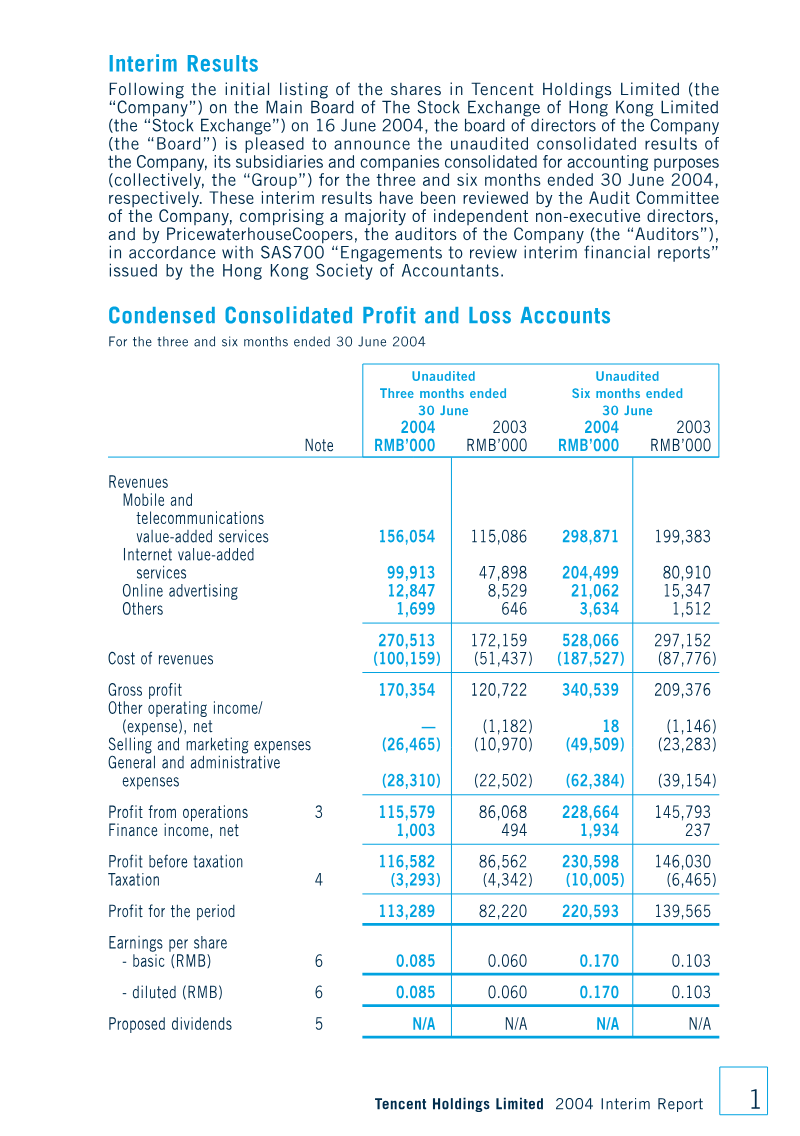
Tencent demonstrated robust financial health and operational expansion during the first half of 2005, characterized by a strategic pivot toward Internet value-added services. Total revenues reached RMB 634.1 million, representing a 20.1% year-over-year increase, while net profit for the period climbed to RMB 283.9 million. This profitability was bolstered by a significant one-time deferred tax credit of RMB 88.6 million and a 92.8% quarter-over-quarter profit surge in the second quarter. These gains effectively offset a decline in mobile and telecommunications value-added services, which faced headwinds from regulatory shifts and billing adjustments.
The company’s growth was underpinned by massive user engagement, with registered instant messaging accounts reaching 438.4 million and peak simultaneous online users hitting 16.2 million. To support this scale, the organization doubled its workforce to 1,648 employees, leading to a corresponding doubling of remuneration costs to RMB 134 million. Increased investments in research and development and new product launches remained central to the company’s strategy, even as operating expenses rose. The financial reporting for this period marked a transition to International Financial Reporting Standards, specifically adopting IFRS 2 to account for share-based compensation via the Black-Scholes model.
Geographically focused on the Chinese market, the company navigated a changing macroeconomic landscape, including the decoupling of the RMB from the USD in July 2005, which introduced new foreign exchange risks. Corporate governance remained stable, with MIH QQ (BVI) Limited maintaining its position as the largest shareholder. Although the company deviated from standard governance practices by unifying the Chairman and CEO roles, the board maintained that this structure was essential for maintaining agility and operational stability within the rapidly evolving information technology sector.
Tencent · 2024
Tencent · 2024

Tencent · 2022
Tencent · 2021

Tencent
Tencent
Tencent
Tencent
Tencent
Tencent
Tencent
Tencent
Tencent
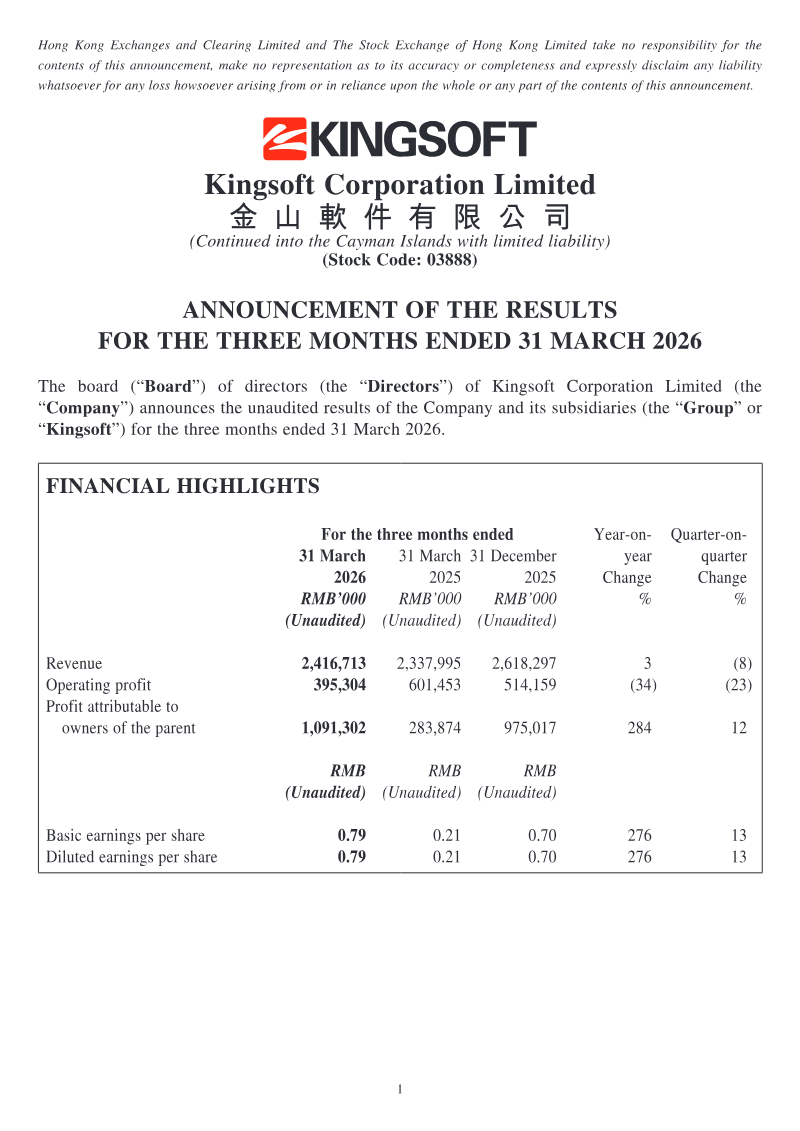
Kingsoft Corporation
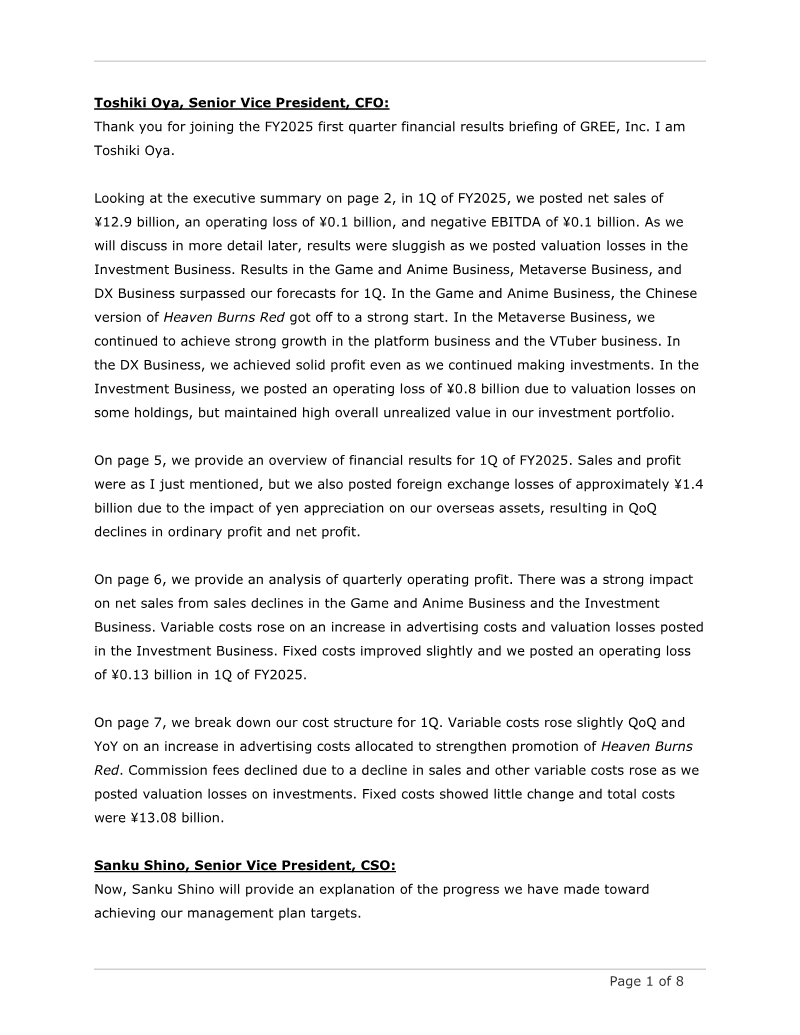
GREE
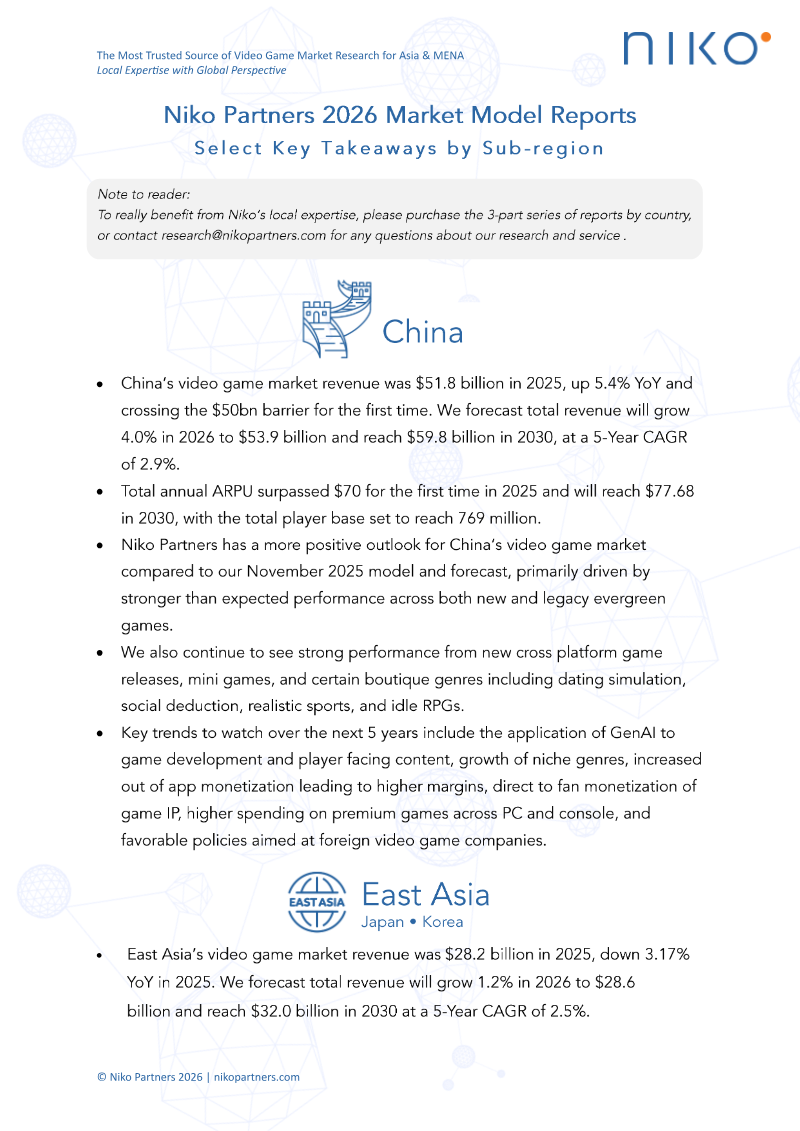
Niko Partners · 2026
Giant Network Group · 2026

Archosaur Games · 2026
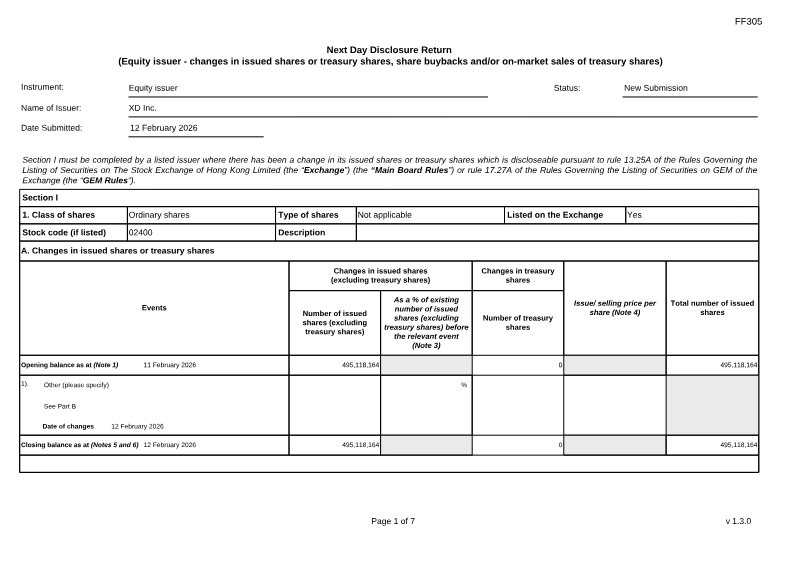
Stock Exchange of Hong Kong · 2026

Stillfront Group · 2026
Meridian Play · 2026
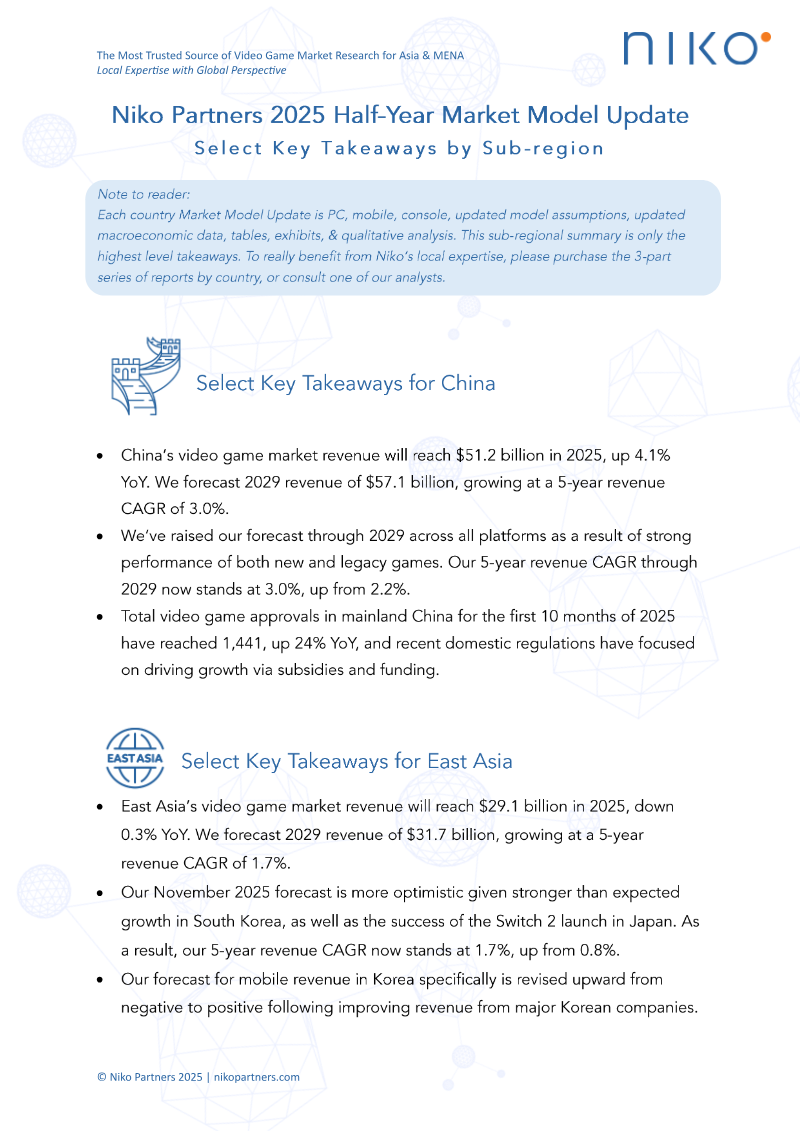
Niko Partners · 2025

Sea Limited · 2024
Pangle · 2021