Quest
Company
Documents about Quest
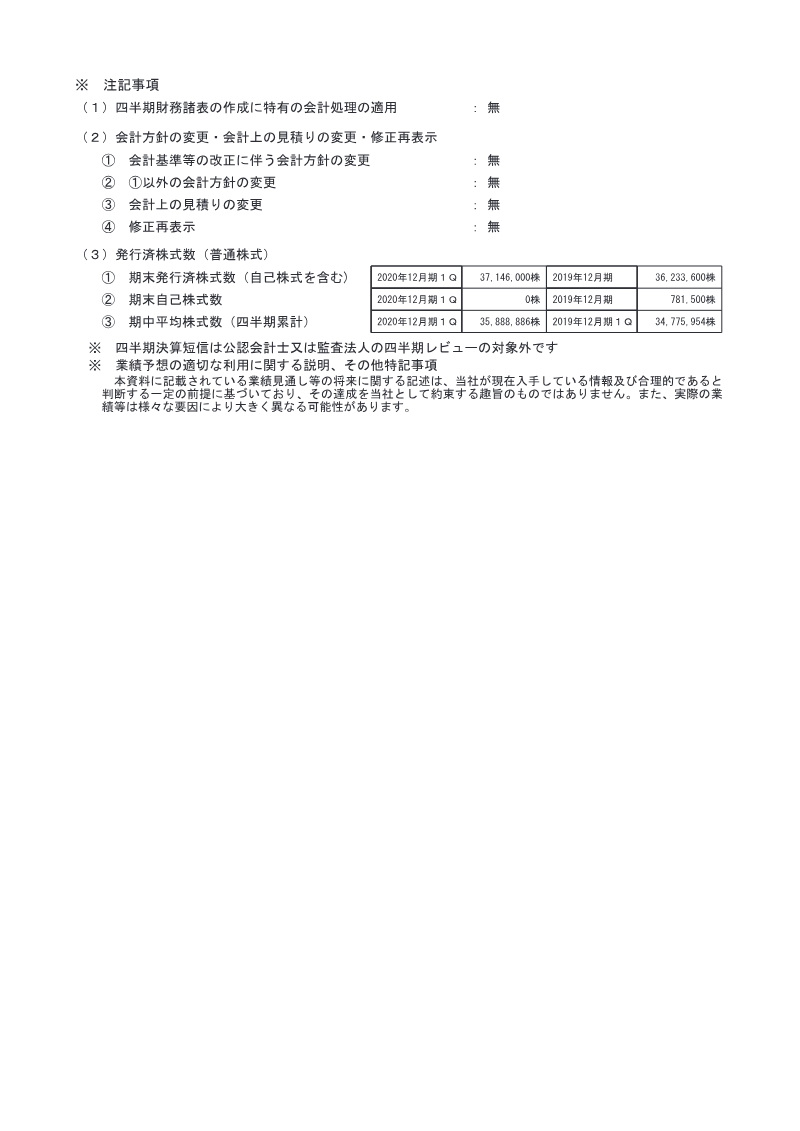
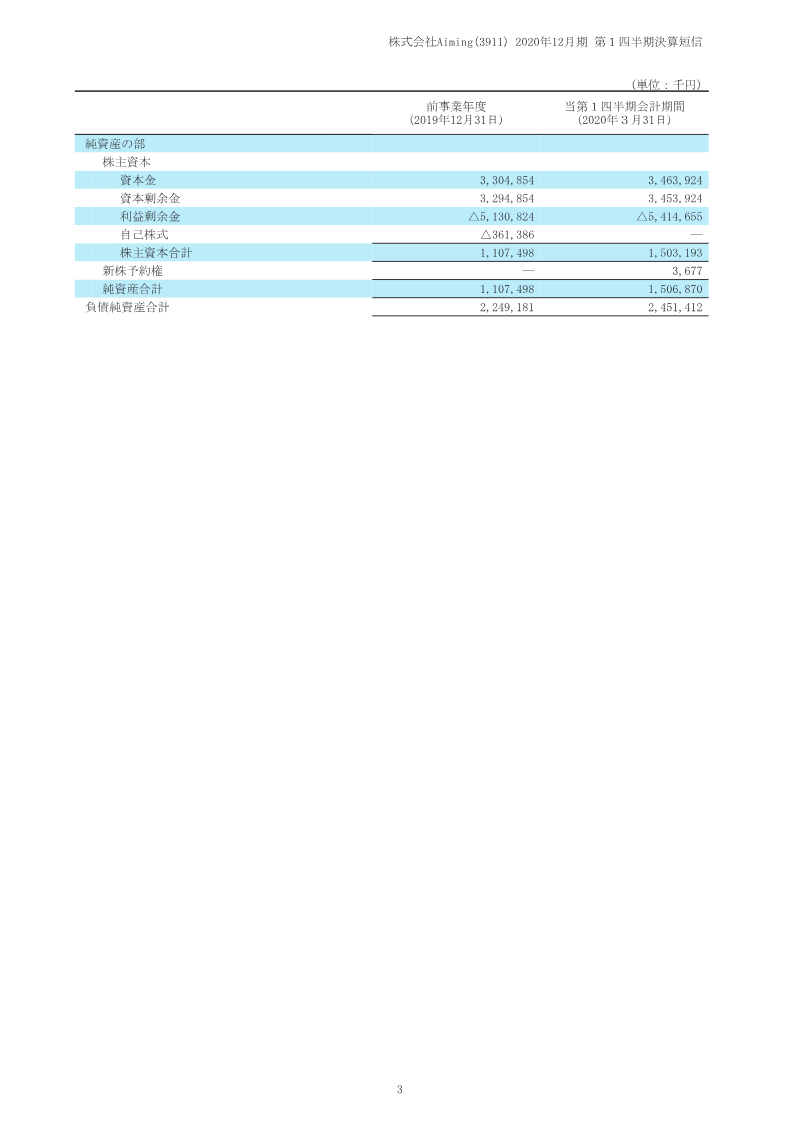
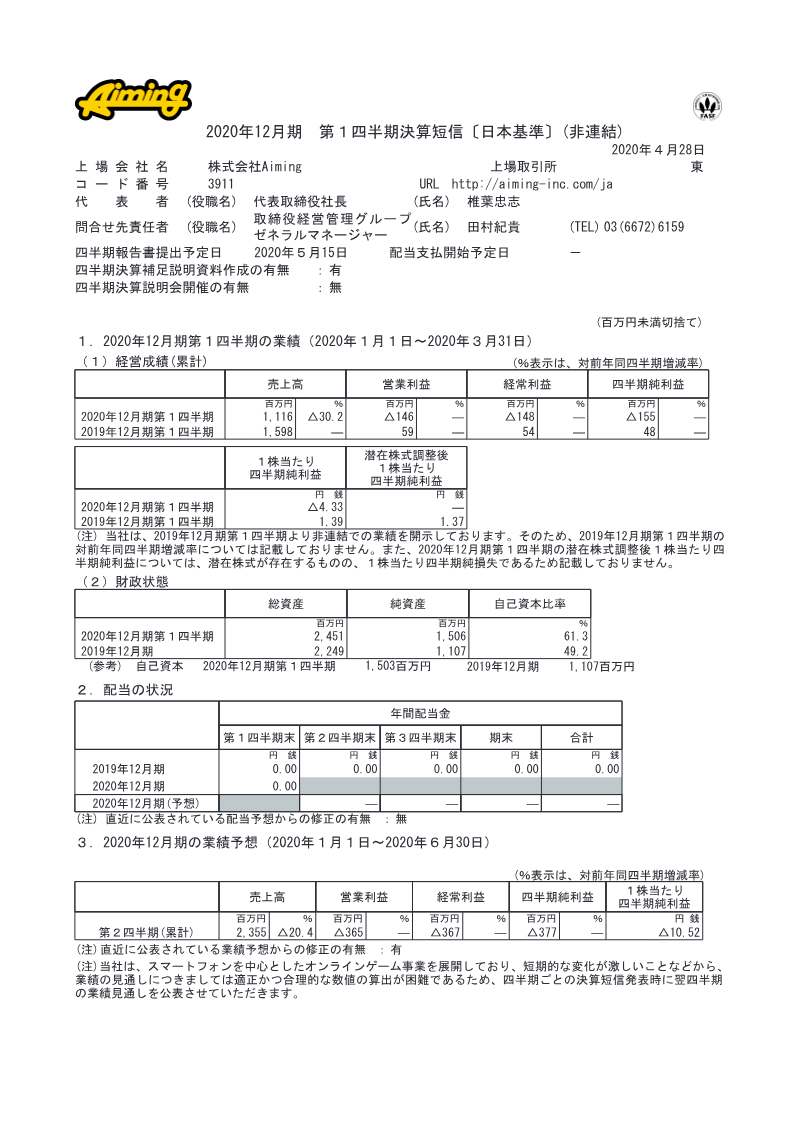
Aiming Q1 2020 Financial Results
Aiming’s financial results for the first quarter of 2020 reflect a period of significant operational contraction and financial loss.
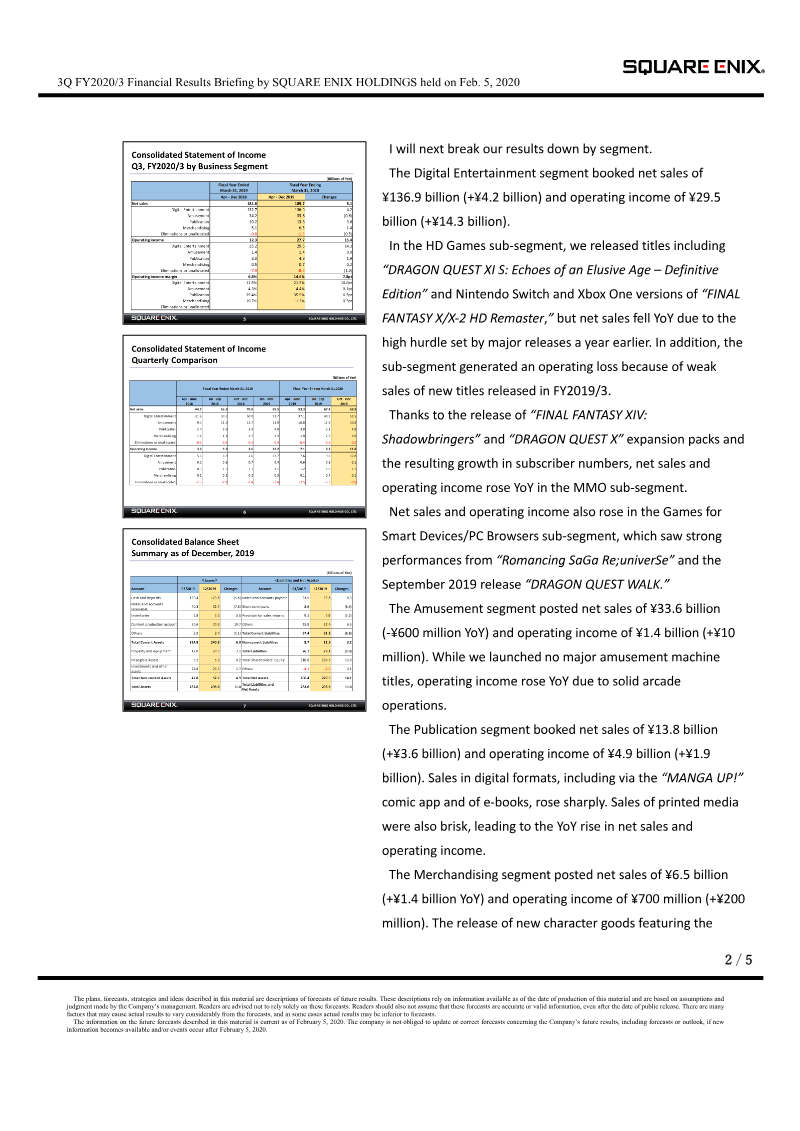
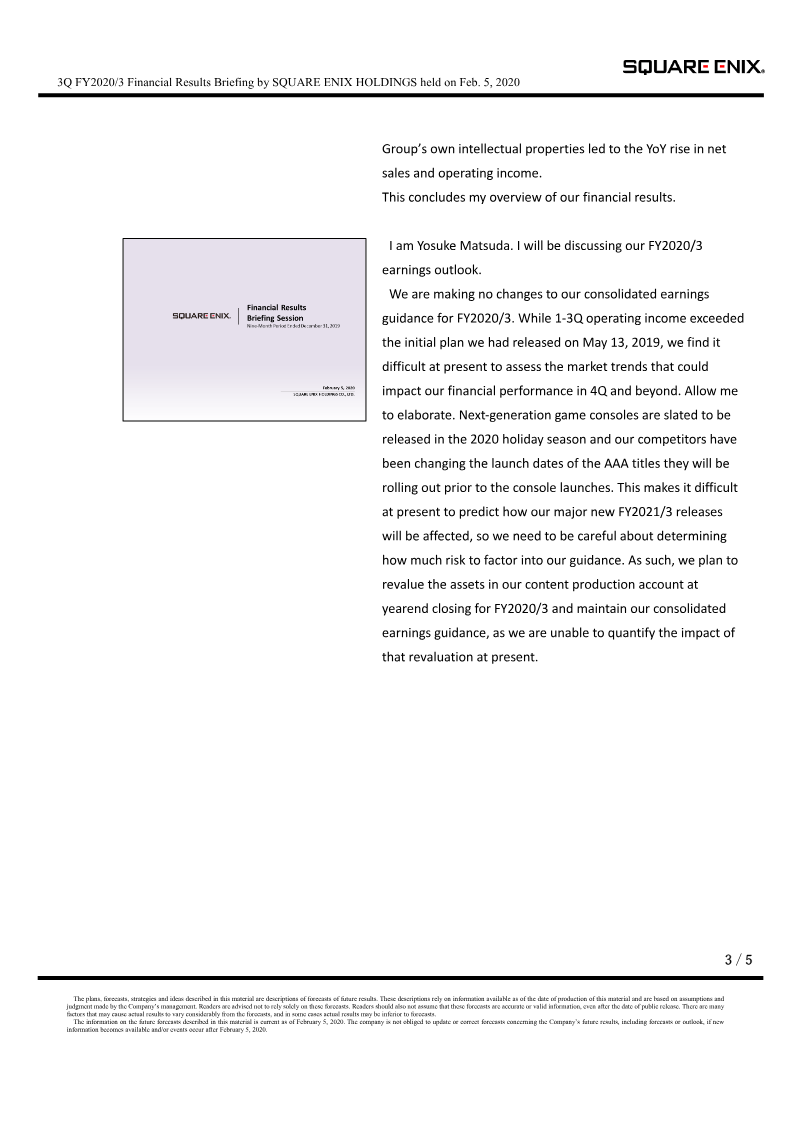
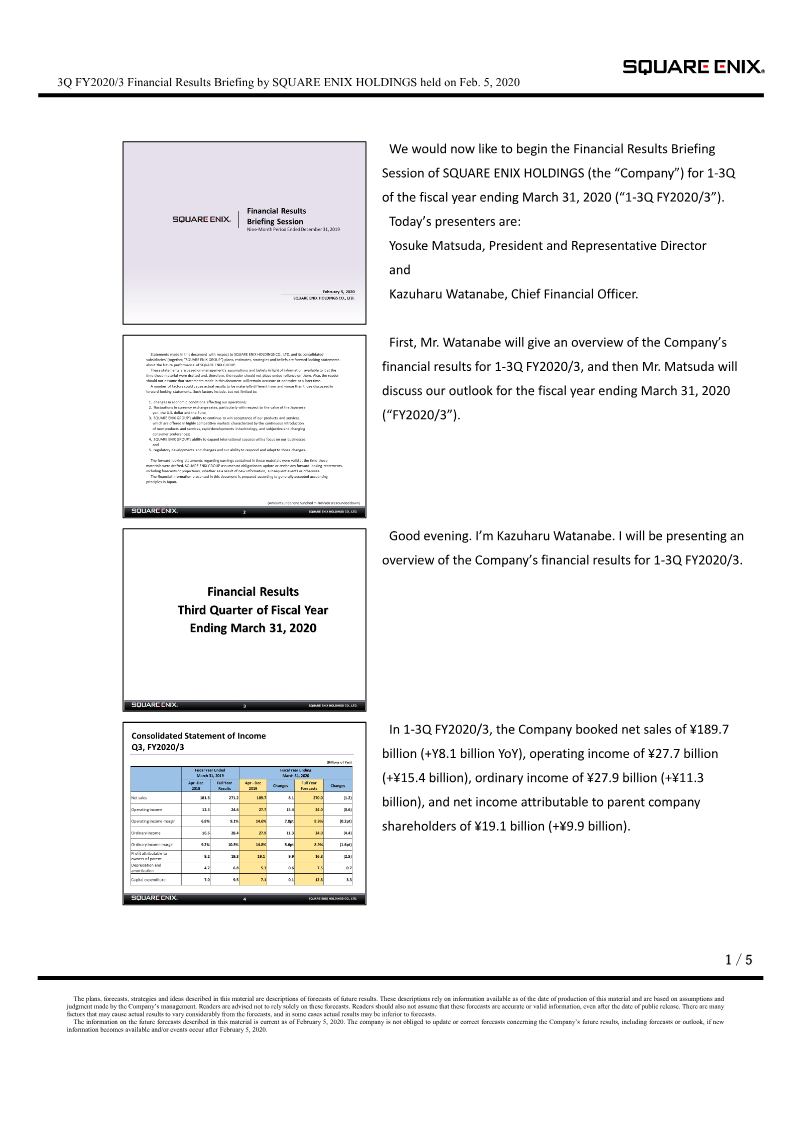
Square Enix Holdings 3Q FY2020/3 Financial Results Briefing
Square Enix Holdings reported strong financial growth for the first three quarters of the fiscal year ending March 31, 2020.
- Square Enix reported net sales of ¥189.7 billion and operating income of ¥27.7 billion for the first three quarters of FY2020/3, marking a year-over-year operating income increase of ¥15.4 billion.
- The Digital Entertainment segment served as the primary growth driver, generating ¥29.5 billion in operating income through strong performance in MMOs and smart device titles.
- MMO revenue was bolstered by the release of expansion packs for Final Fantasy XIV and Dragon Quest X, while smart device growth was driven by Romancing SaGa Re;univerSe and Dragon Quest Walk.
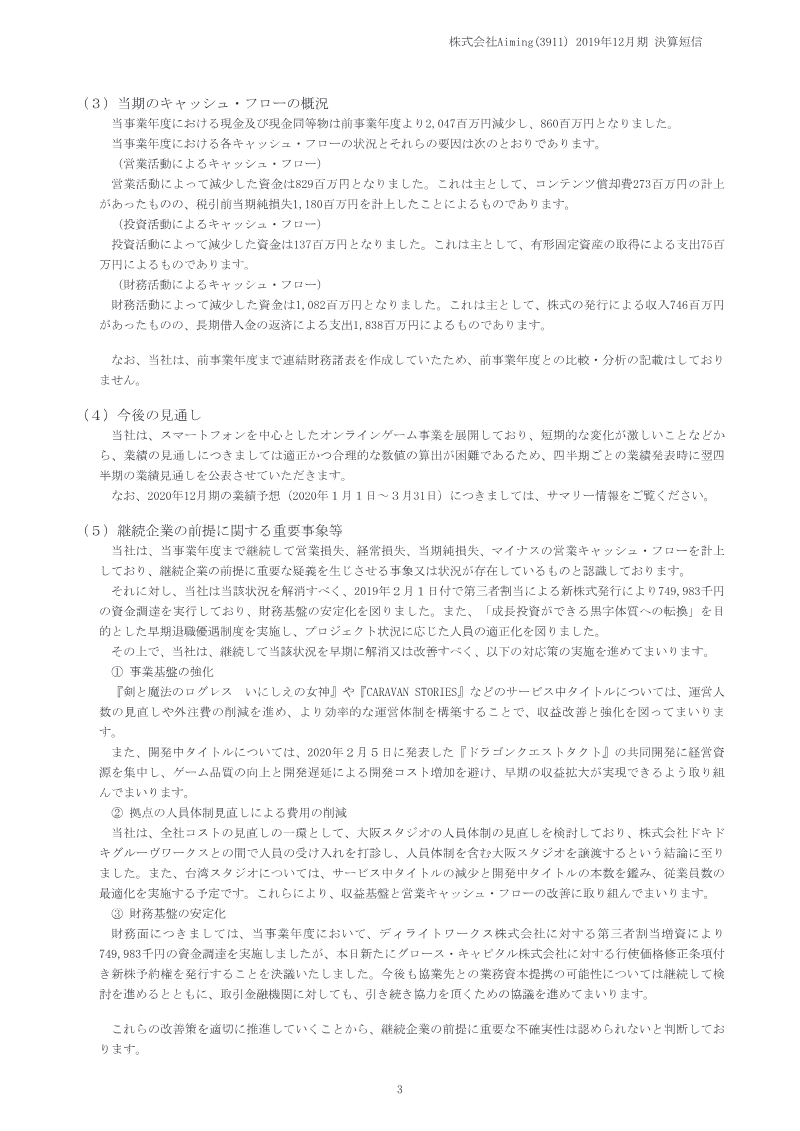
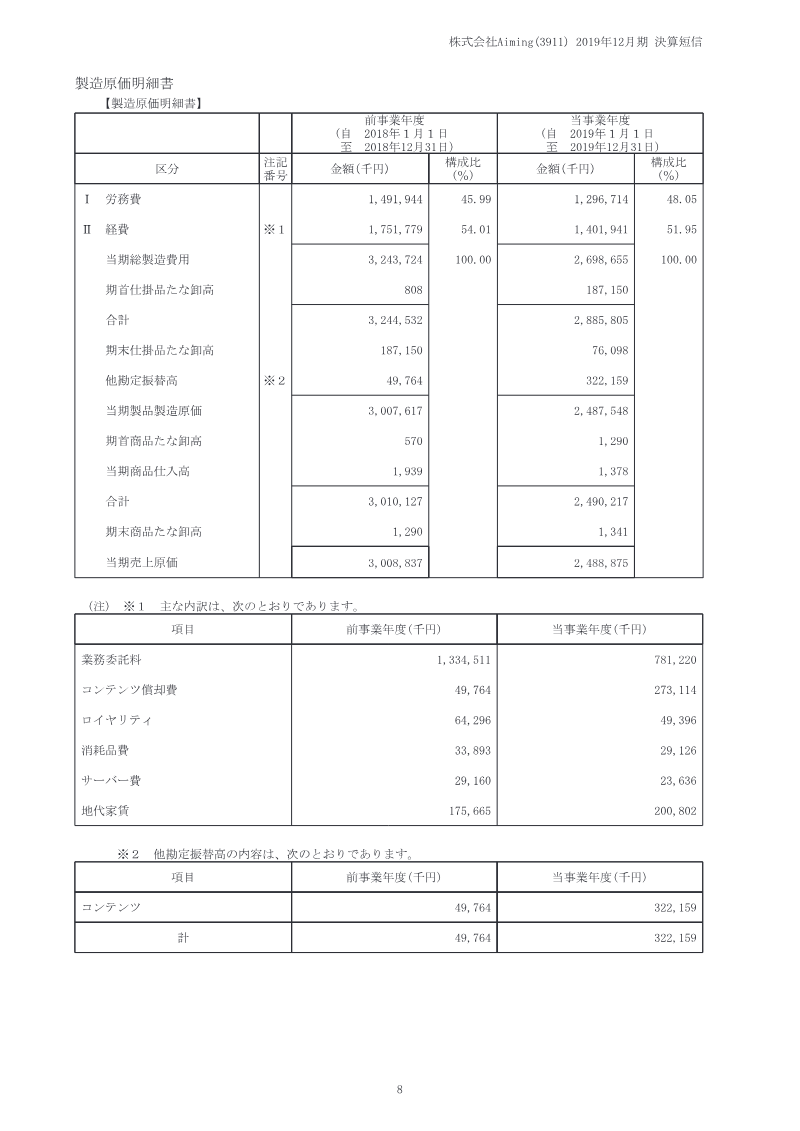
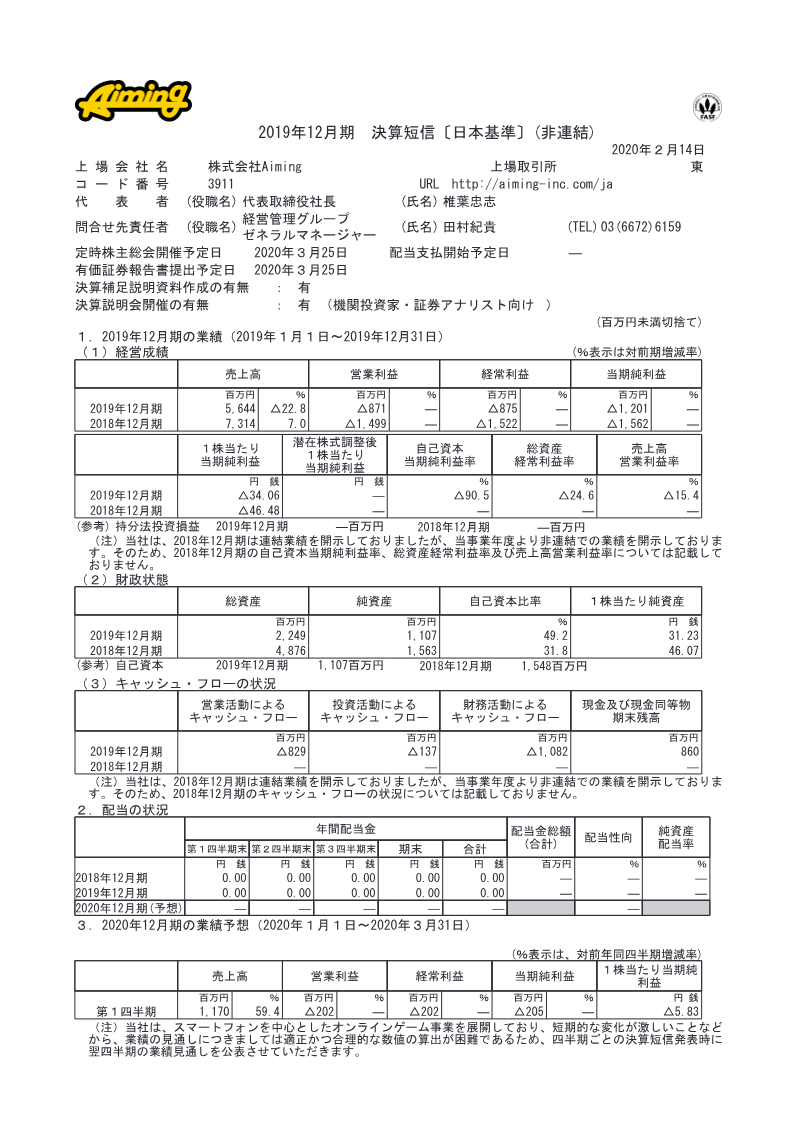
Aiming Fiscal Year 2019 Financial Results
Aiming’s fiscal year 2019 financial results reflect a period of significant operational restructuring and financial challenge within the Japanese online game market.
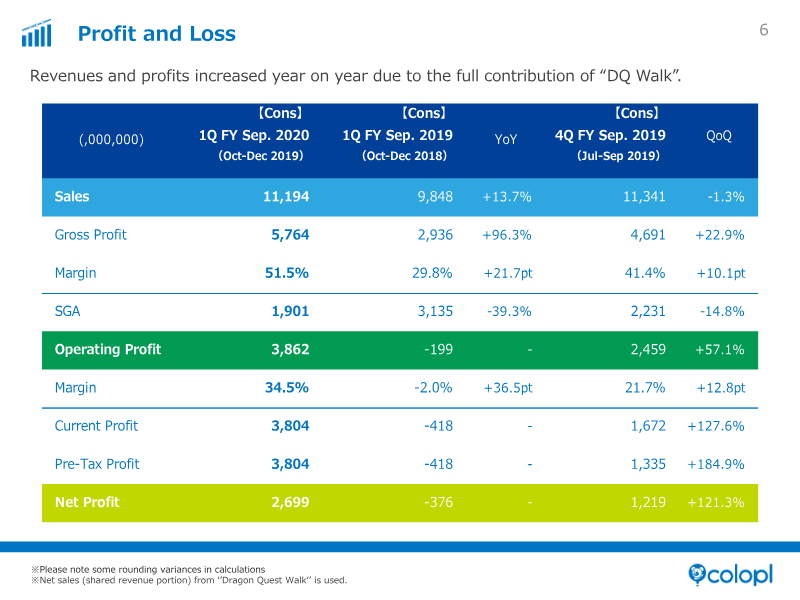
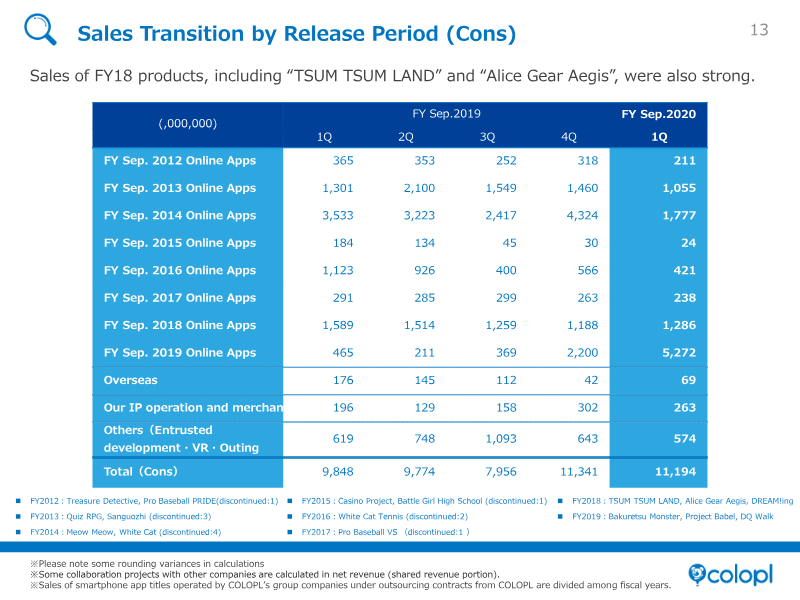

COLOPL 1Q FY Sep. 2020 Earnings Results
COLOPL’s financial results for the first quarter of the fiscal year ending September 2020 demonstrate a significant recovery in profitability, driven primarily by the strong performance of the title "Dragon Quest Walk."
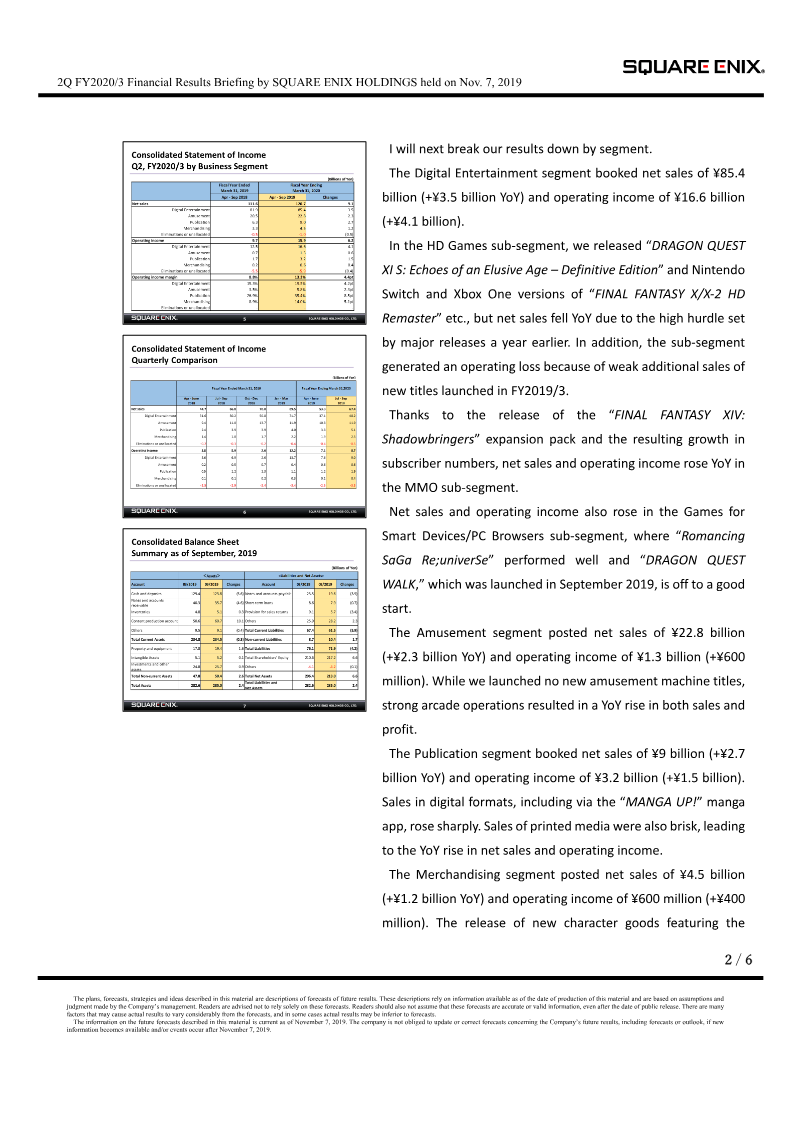
Square Enix Holdings 2Q FY2020/3 Financial Results Briefing
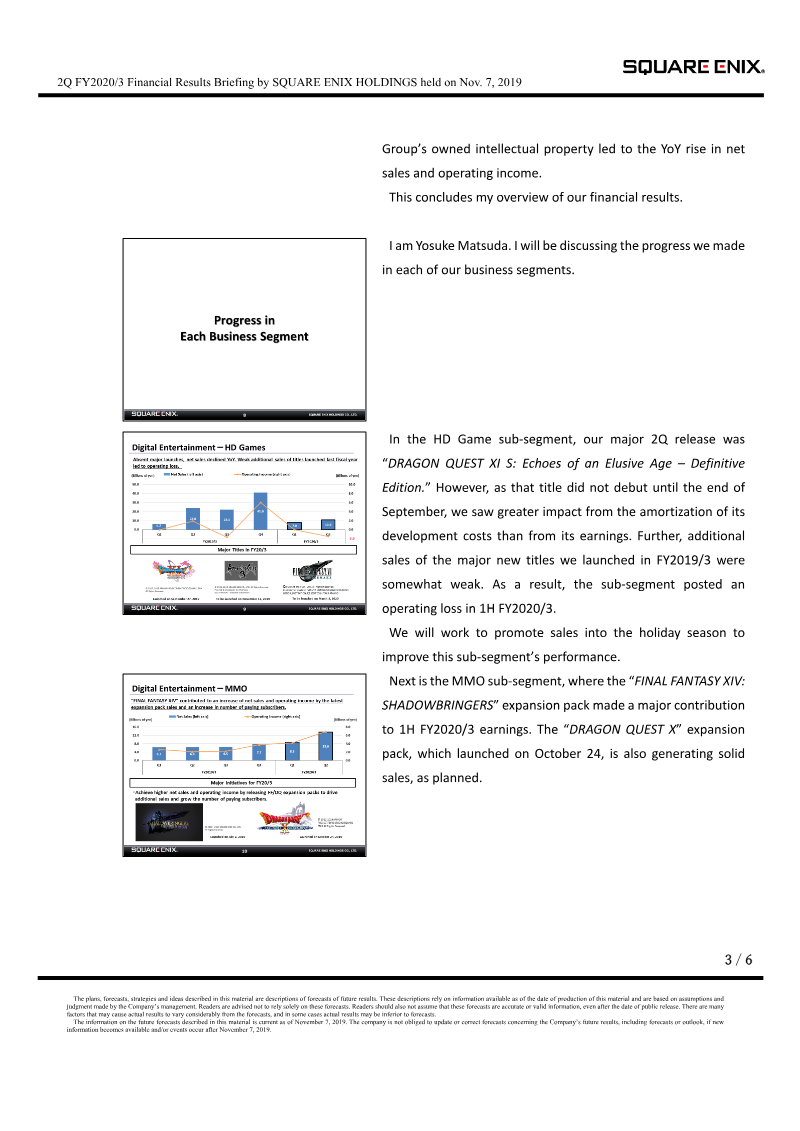
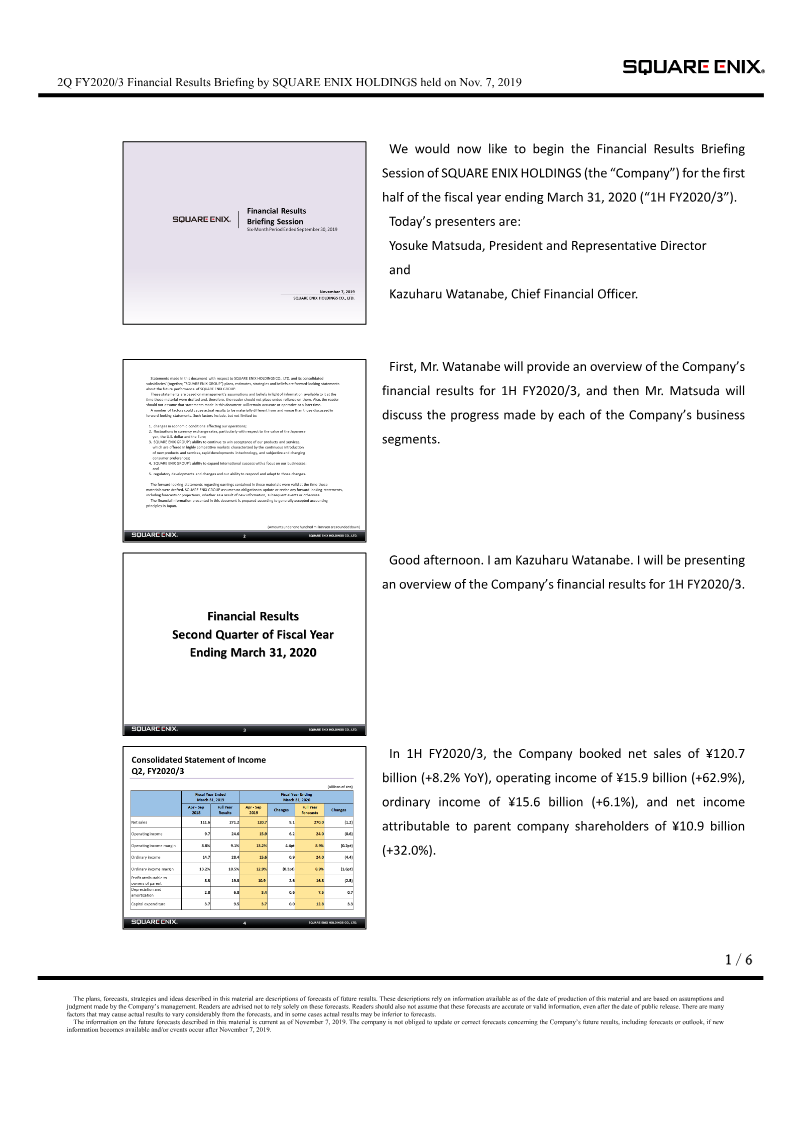
Square Enix Holdings reported positive financial growth for the first half of the fiscal year ending March 31, 2020.
- Square Enix reported strong H1 FY2020/3 growth with net sales of ¥120.7 billion (up 8.2% YoY) and operating income of ¥15.9 billion (up 62.9% YoY).
- The Digital Entertainment segment's MMO sub-segment and mobile titles like 'Dragon Quest Walk' and 'Romancing SaGa Re;univerSe' were primary drivers of financial performance.
- The HD Games sub-segment recorded an operating loss due to development cost amortization and a ¥2.35 billion impairment loss on content production.

Financial Results Briefing Session: Six-Month Period Ended September 30, 2019
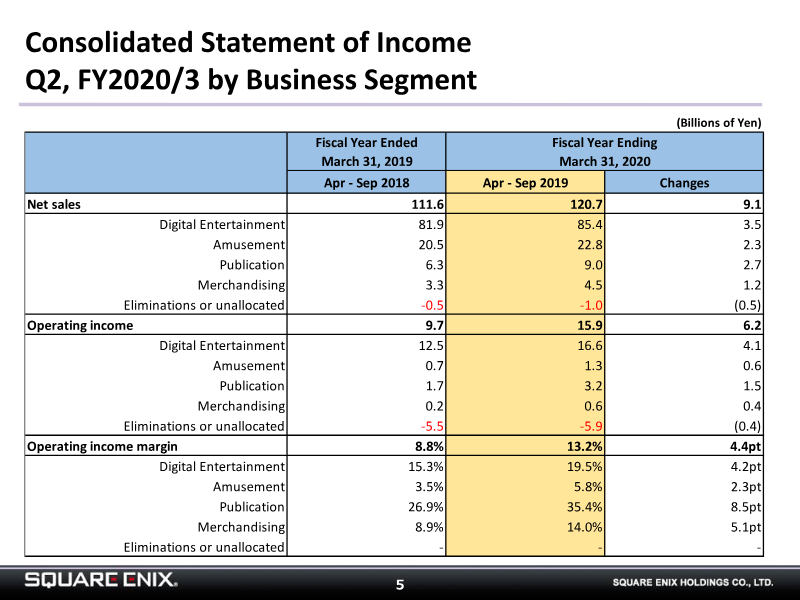
Square Enix Holdings Co., Ltd. reported its financial results for the six-month period ending September 30, 2019, reflecting a period of growth driven by strong performance in its digital entertainment and publication segments.
- Square Enix reported a strong first half for the fiscal year ending March 31, 2020, with net sales reaching 120.7 billion yen and operating income rising to 15.9 billion yen, a significant increase from 9.7 billion yen in the same period the previous year.
- The Digital Entertainment segment's MMO business saw growth in both net sales and operating income, driven by the release of the 'Final Fantasy XIV: Shadowbringers' expansion pack and an increase in paying subscribers.
- Games for smart devices and PC browsers performed well, with net sales and operating income rising due to the continued success of 'Romancing SaGa Re;univerSe' and the September 2019 launch of 'Dragon Quest Walk'.

COLOPL 4Q FY September 2019 Financial Results
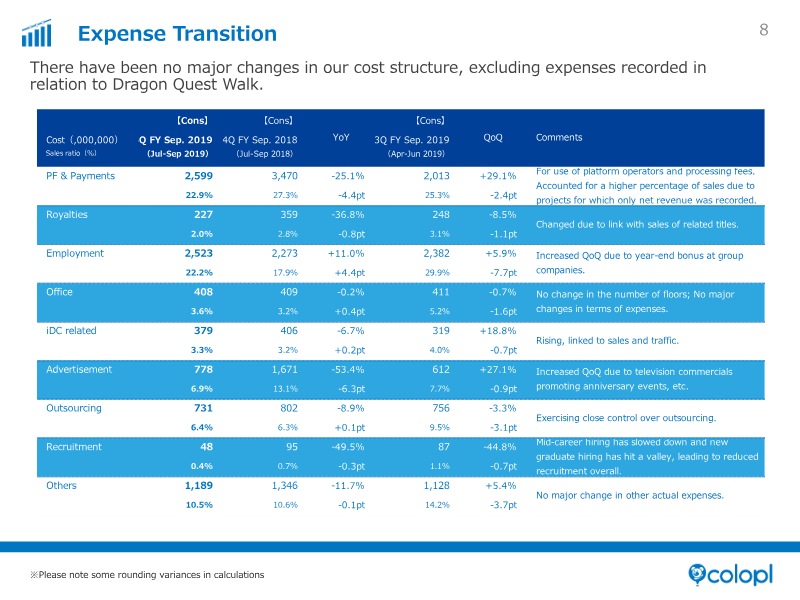
The financial results for the fourth quarter of the fiscal year ending September 2019 highlight a period of significant growth driven by the successful launch of Dragon Quest Walk.
- COLOPL achieved ¥11.3 billion in Q4 sales, a 42.5% increase over the previous quarter, driven primarily by the launch of Dragon Quest Walk.
- Operating profit rebounded to ¥2.4 billion in Q4 from a break-even point in the third quarter, contributing to a full-year operating profit of ¥2.9 billion on ¥38.9 billion in total sales.
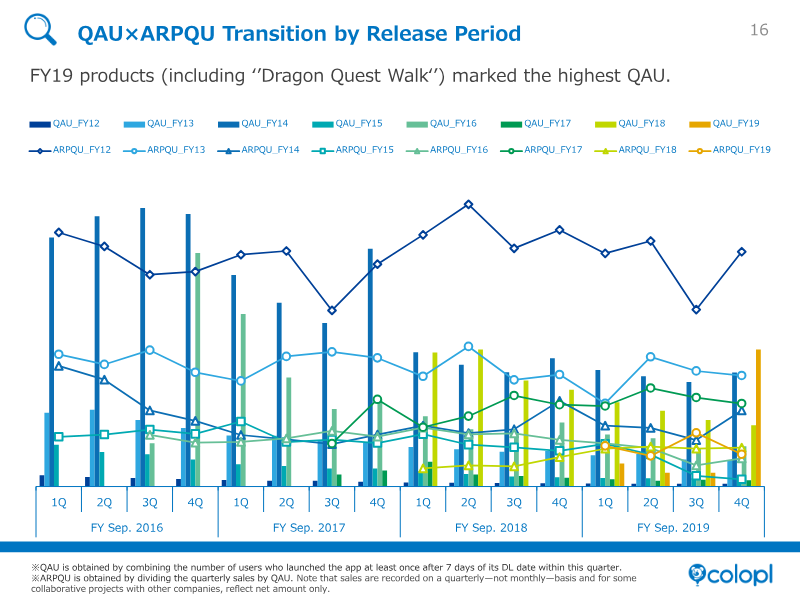
- Quarterly Active Users (QAU) grew by 48.1% to reach 8 million, supported by anniversary events for White Cat Project and White Cat Tennis.
COLOPL 4Q FY2019 Operating Results Briefing: Question and Answer Summary
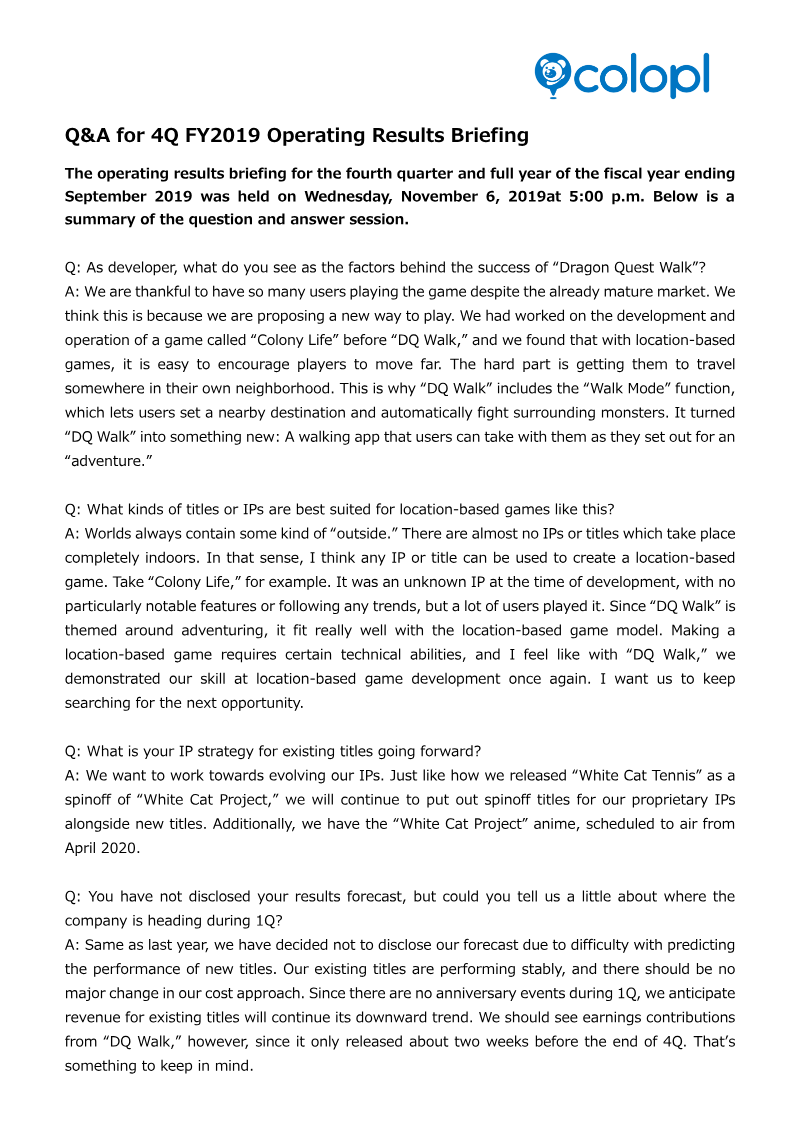
The fiscal year 2019 operating results briefing for Colopl highlights the strategic success of the location-based mobile game Dragon Quest Walk and outlines the company’s future development trajectory.
- Dragon Quest Walk has become the primary driver of Colopl's strategic success, validating the company's focus on location-based mechanics and real-world exploration.
- Colopl plans to leverage its technical proficiency in location-based development to adapt various intellectual properties into similar exploration-based gaming experiences.
- Existing game titles are expected to see a revenue decline in 1Q FY2020 due to a lack of anniversary events, shifting the company's earnings reliance toward Dragon Quest Walk.
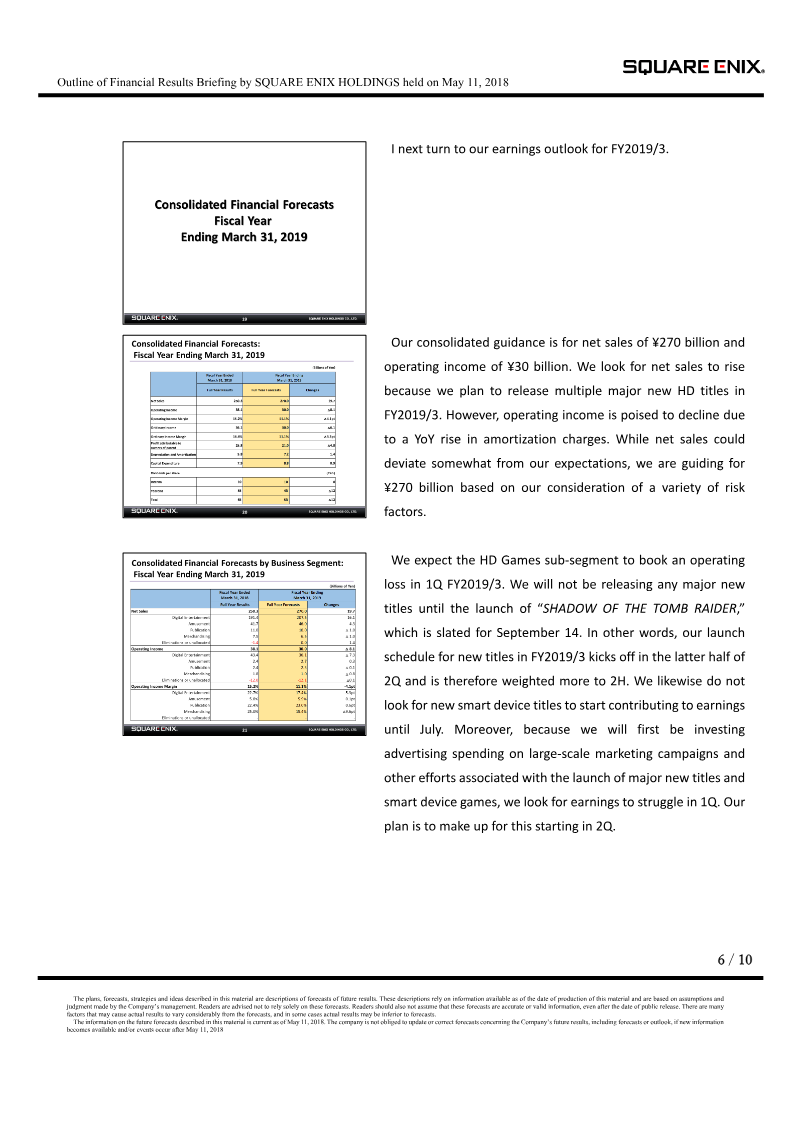
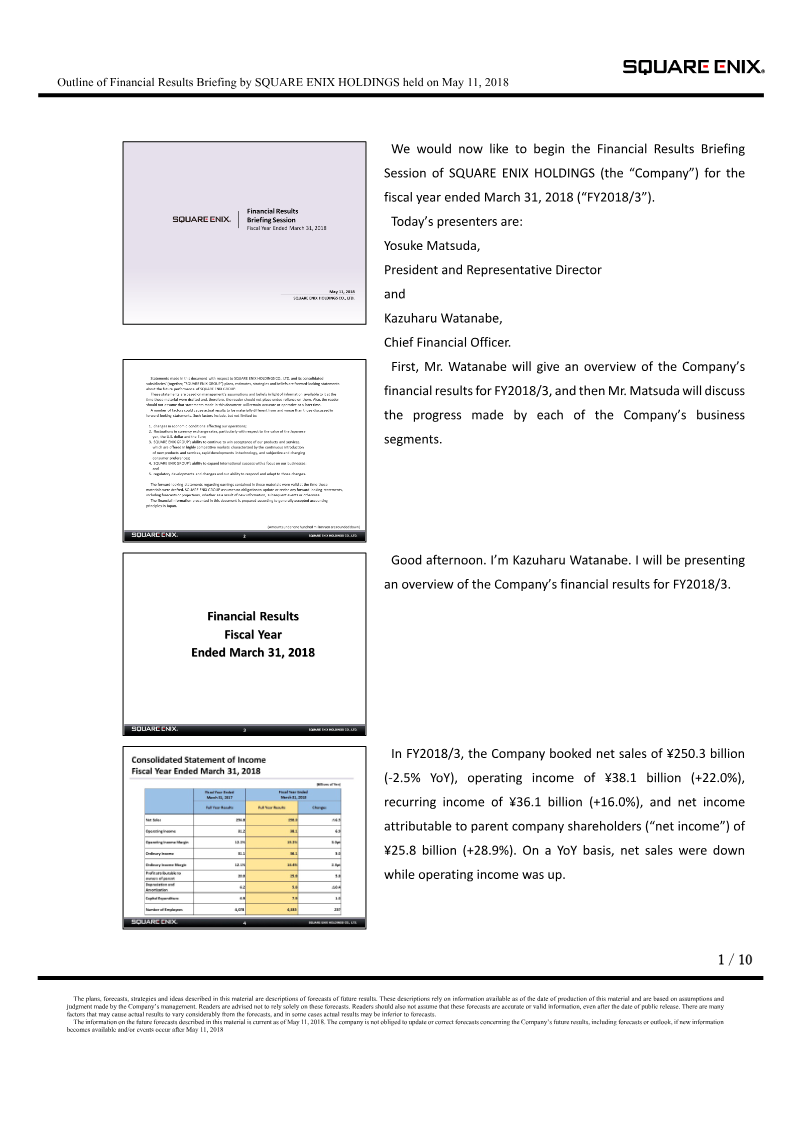
Financial Results Briefing: Fiscal Year Ended March 31, 2018
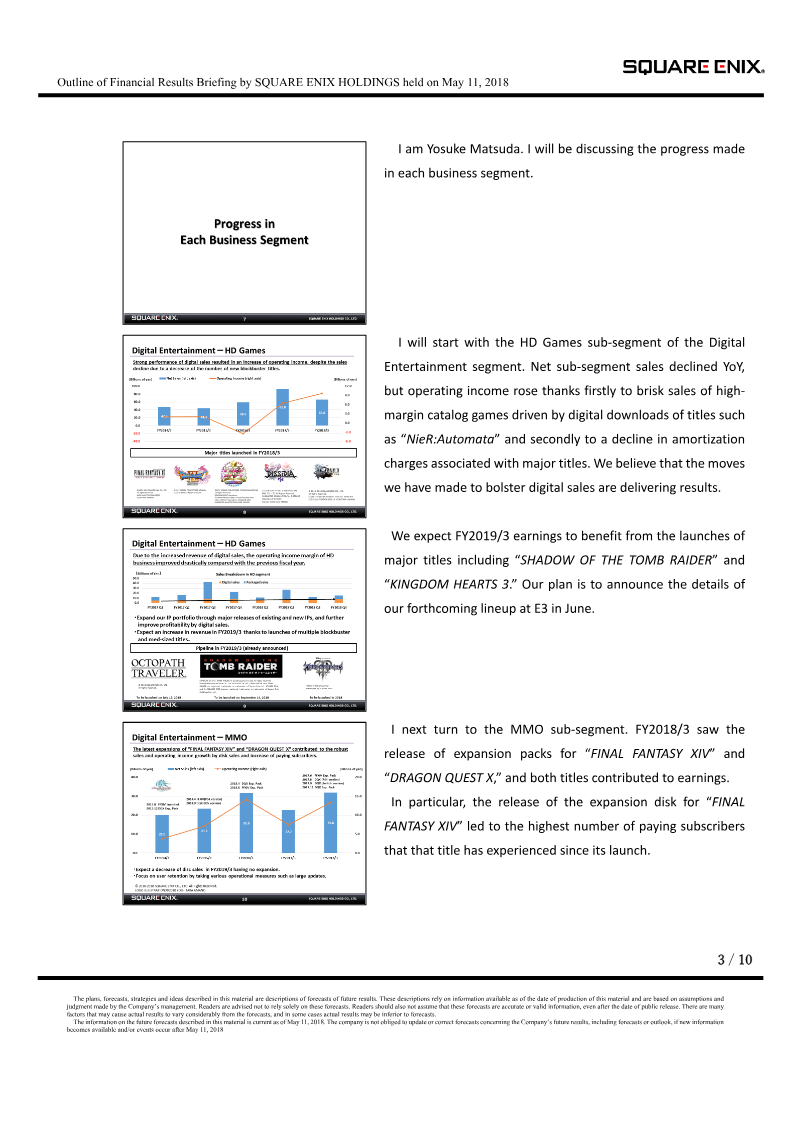
Square Enix Holdings reported its financial results for the fiscal year ended March 31, 2018, highlighting a period of strategic transition toward digital-first revenue streams.
- Square Enix reported FY2018 net sales of ¥250.3 billion, a 2.5% decrease, while operating income grew 22.0% to ¥38.1 billion and net income rose 28.9% to ¥25.8 billion.
- The company set medium-term targets for the fiscal year ending March 31, 2020, aiming for ¥300–400 billion in net sales and ¥40–50 billion in operating income.
- Growth was driven by high-margin digital catalog sales, specifically NieR:Automata, and expansion packs for MMO titles Final Fantasy XIV and Dragon Quest X.
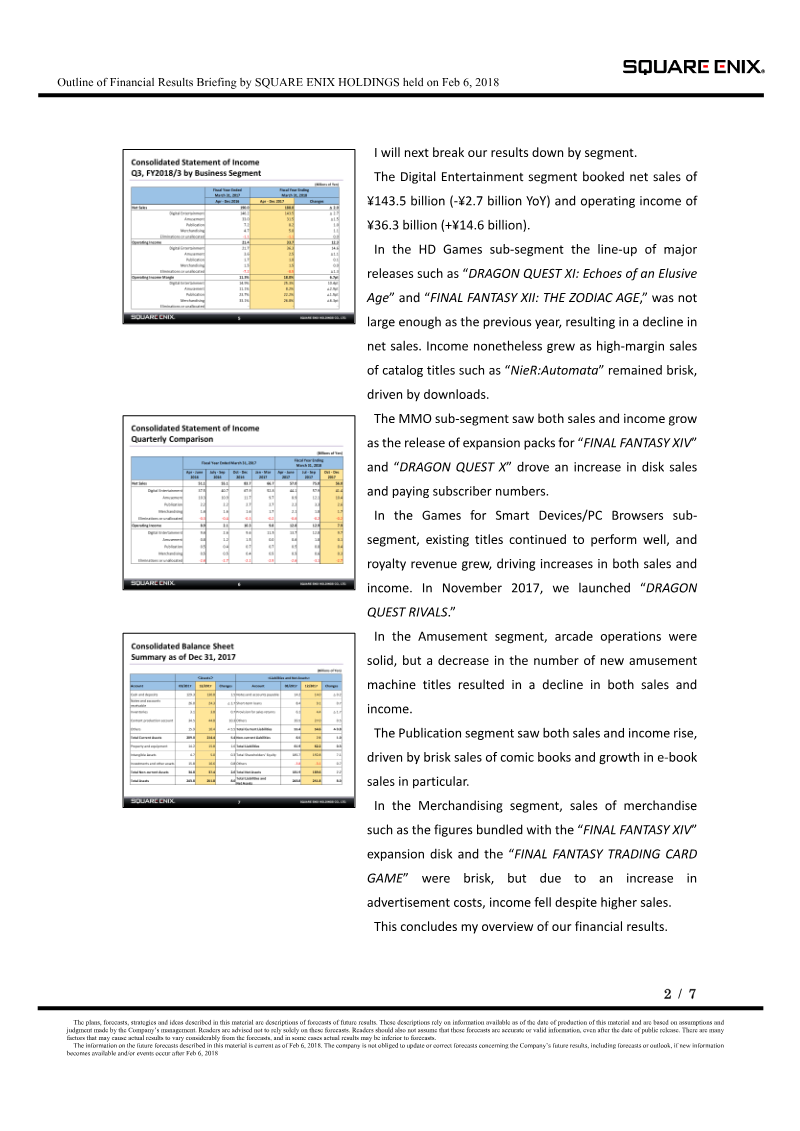
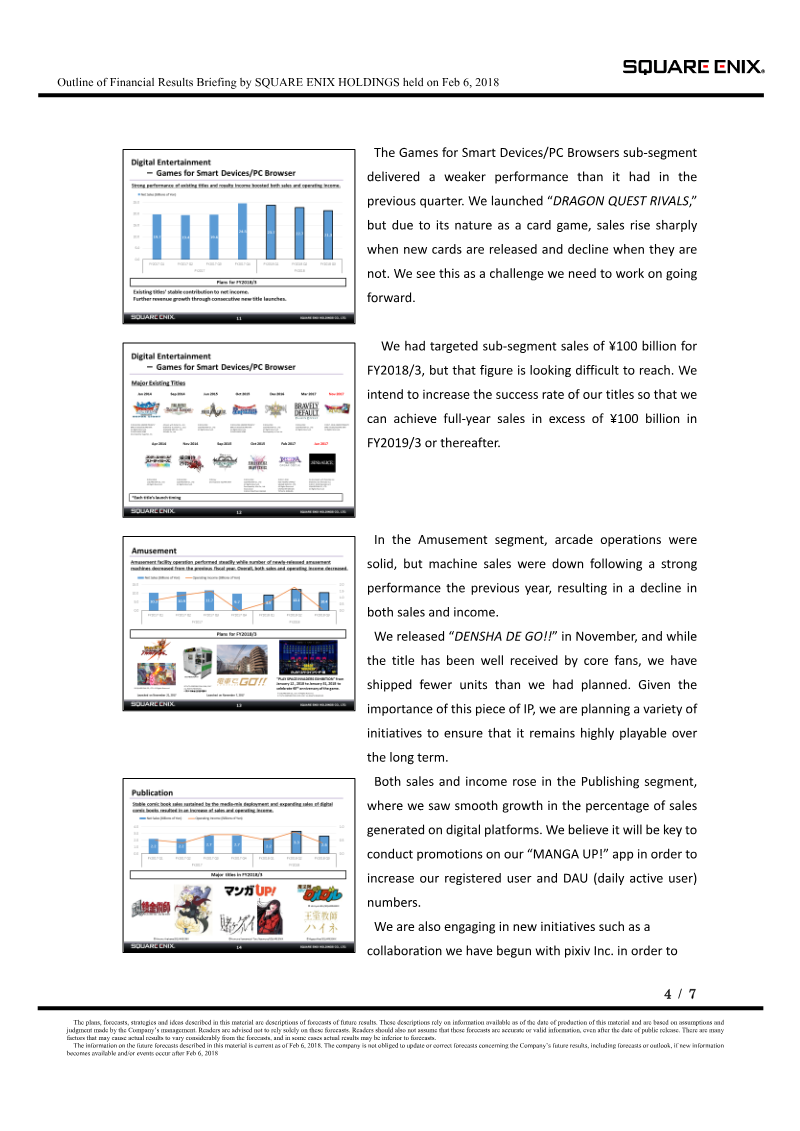
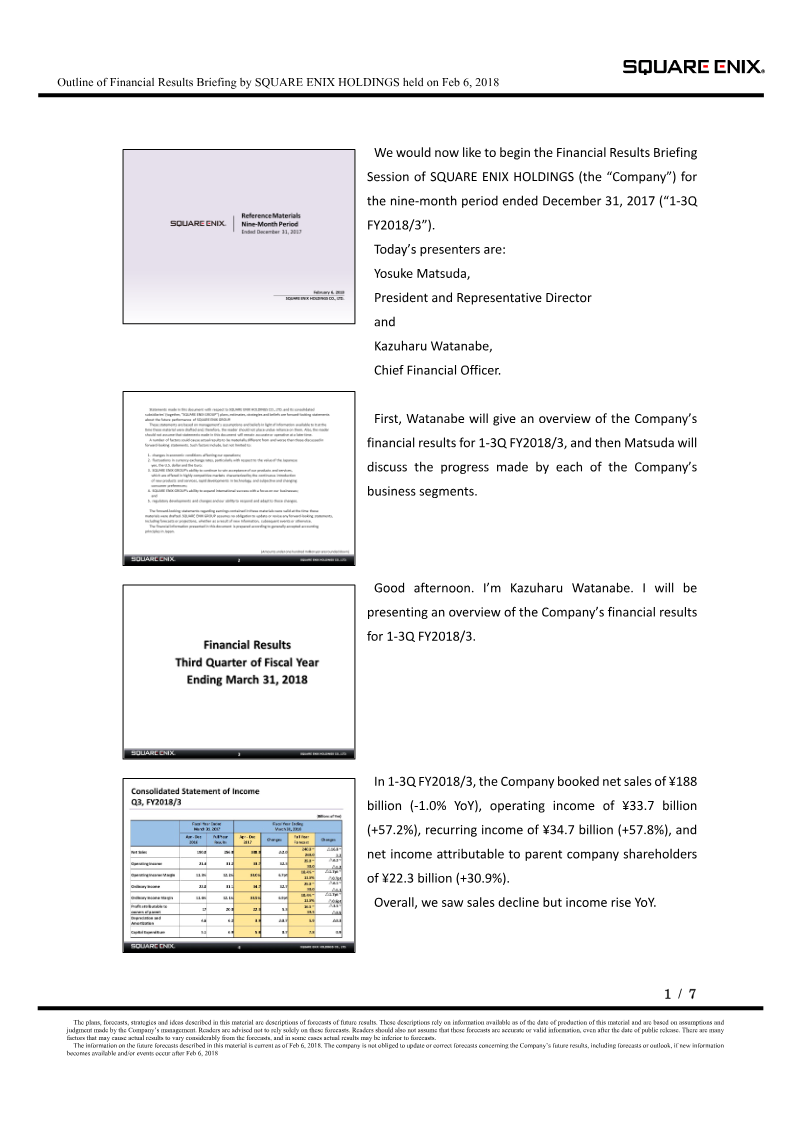
Square Enix Holdings Financial Results Briefing: Nine-Month Period Ended December 31, 2017
Square Enix Holdings reported its financial results for the nine-month period ending December 31, 2017, demonstrating a trend of declining net sales alongside significant growth in operating and recurring income.
- Square Enix reported a 57.2% increase in operating income to ¥33.7 billion and a 30.9% rise in net income to ¥22.3 billion for the nine-month period ending December 31, 2017, despite a 1.0% decline in net sales to ¥188 billion.
- The Digital Entertainment segment generated ¥143.5 billion in net sales, driven by strong digital catalog sales of titles like NieR:Automata and growth in MMO subscribers following Final Fantasy XIV and Dragon Quest X expansions.
- Profitability improved due to a strategic shift toward high-margin digital sales and catalog monetization, which successfully offset a lighter release schedule for new HD games compared to the previous year.

THQ Nordic Q4 2017 Interim Report
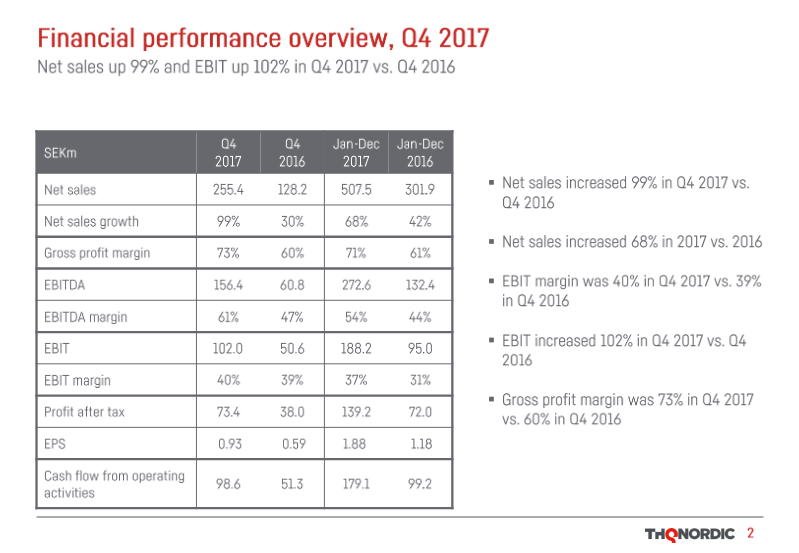
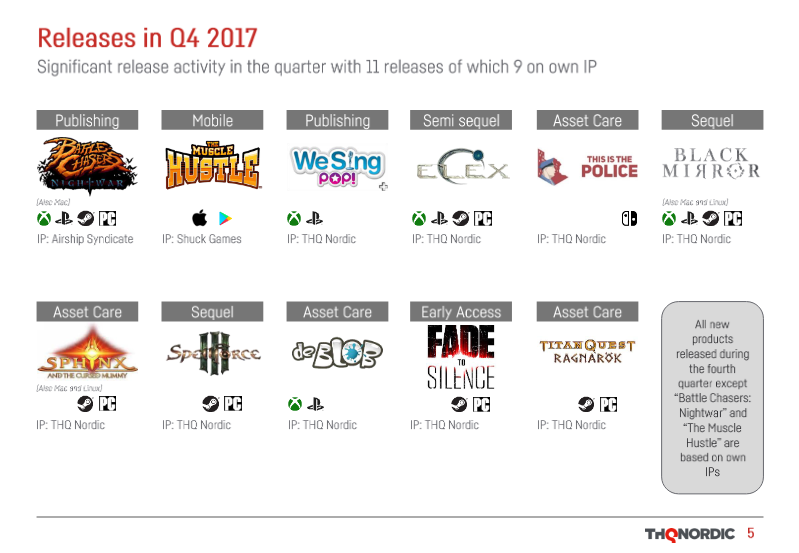
THQ Nordic experienced substantial financial growth during the fourth quarter of 2017, characterized by a 99% increase in net sales and a 102% rise in EBIT compared to the same period in 2016.
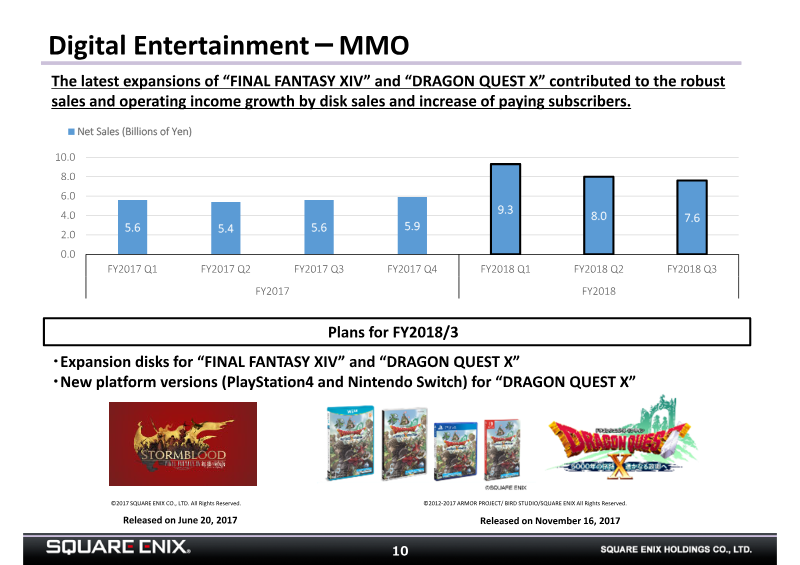

Square Enix Holdings Nine-Month Financial Results: Period Ended December 31, 2017
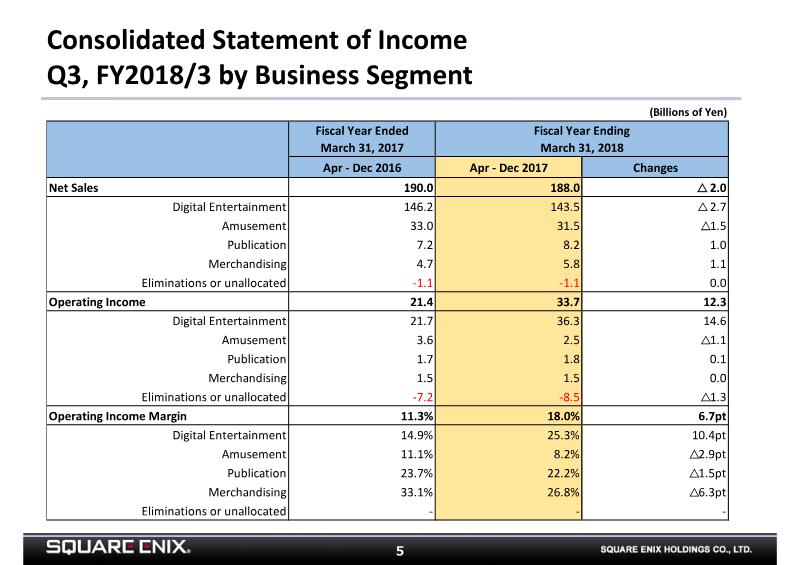
The Square Enix Holdings financial results for the nine-month period ending December 31, 2017, demonstrate a period of significant profit growth driven primarily by the company’s Digital Entertainment segment.
- Square Enix reported a significant increase in operating income for the nine-month period ending December 31, 2017, rising to 33.7 billion yen from 21.4 billion yen in the prior year, representing an operating margin of 18.0%.
- The Digital Entertainment segment was the primary driver of growth, with operating income surging to 36.3 billion yen compared to 21.7 billion yen in the previous year, fueled by strong performance in MMO expansions and mobile titles.
- MMO revenue saw substantial gains due to the release of expansion disks for 'FINAL FANTASY XIV' and 'DRAGON QUEST X' and an increase in paying subscribers.