Uk

40 documents·20 publishers

Documents

Page 1
Report5 pages

East vs. West: Monetization Trends

The study examines how mobile gaming spending patterns differ between Eastern and Western markets, focusing on frequency of purchases, average spend per transaction, and motivational drivers. Findings reveal that Eastern gamers purchase in‑app items more often than Western players; 35 % of East spend frequently versus 36 % in the West, with a higher proportion of occasional and rare spenders in the West. When it comes to transaction size, Eastern users tend to pay more per purchase: 76 % spend over $10 compared with only 42 % of Western users, while a smaller share of East spend under $5 (30 %) versus 8 % in the West. Motivational analysis shows that Western gamers prioritize value and bundles, whereas Eastern players are more attracted to exclusivity, limited‑time items, new offers, and character acquisition. The research covers key markets in Asia—Korea and Japan—and Western regions including the United States, United Kingdom, and broader Europe. Data were collected through a survey of mobile gamers across these regions, with sample sizes sufficient to compare spending behaviors and motivations. The report concludes that monetization strategies should be tailored regionally: value‑based bundles may resonate better in the West, while exclusive content and limited editions could drive higher spend in Eastern markets.

  • Eastern mobile gamers demonstrate a significantly higher propensity for large transactions, with 76% of purchases exceeding $10 compared to only 42% in Western markets.
  • Western mobile gamers are more likely to make small-scale purchases, with 8% of spenders in the West opting for transactions under $5, contrasted with 30% in the East.
  • Monetization strategies in the West should prioritize value-based bundles, as these resonate more effectively with the purchasing preferences of Western players.
  • Eastern markets, specifically Korea and Japan, show a stronger consumer preference for exclusivity, limited-time offers, and character acquisition.
  • Purchase frequency remains relatively balanced across regions, with 35% of Eastern gamers and 36% of Western gamers identified as frequent spenders.
+5
Mistplay
Page 1
Whitepaper41 pages

What Good Are AI NPCs?: Lessons from a Large-scale Player Study

The study demonstrates that generative AI‑driven non‑player characters can deliver deeply engaging, emotionally resonant gameplay. In a 122‑hour experiment with 68 participants, the “Dead Meat” demo achieved high immersion scores—97 % UES reward and 94 % focused attention—while keeping mental demand low (NASA‑TLX scores of 64.7 for demand and 52.7 for performance). Qualitative interviews consistently cited the NPCs’ human‑like dialogue and narrative depth as key contributors to player enjoyment.

Quantitative data confirm widespread satisfaction: 96 % of players rated overall enjoyment as high, and 90 % praised the creative freedom afforded by the open‑ended design. Subscale analysis of the GUESS instrument revealed that 60 % achieved a top score for Creative Freedom, 65 % for Personal Gratification, and 80 % for Play Engrossment. Thematic coding identified freedom of expression, challenge‑driven motivation, and immersive conversation as primary drivers of satisfaction, indicating that the game successfully balances agency with sufficient guidance.

Player behavior analysis uncovered seven distinct strategic approaches—such as “Good Cop/Bad Cop” interrogation, “Rule Bender End Justifies the Means,” and “Smart Arse” manipulation—often combined within a single session. Participants responded equally to voiced and text‑based NPCs, and the 20‑minute session length encouraged replayability through role‑playing different characters. Although the brief duration limited long‑term insight, emergent strategies were viewed as a feature rather than a flaw. Future research will explore how authorial adjustments influence player responses across demographic groups, reinforcing the potential of AI NPCs to enrich narrative gameplay on a broad scale.

  • Generative AI NPCs drive high player engagement, with 97% of participants reporting high immersion and 96% rating their overall enjoyment as high.
  • The integration of AI NPCs maintains a balance between agency and guidance, as evidenced by 80% of players achieving top scores for play engrossment and 90% praising the creative freedom of the open-ended design.
  • Cognitive load remains manageable during AI-driven interactions, with participants reporting NASA-TLX mental demand scores of 64.7 and performance scores of 52.7.
  • Players adopt diverse, emergent interaction strategies, including interrogation, manipulation, and rule-bending, which suggests that AI NPCs support complex, role-playing-heavy gameplay.
  • Player satisfaction is consistent across communication formats, as participants responded equally well to both voiced and text-based AI NPC interactions.
+2
University of Bristol
Page 1
Report13 pages

Half-Yearly Report: 2014

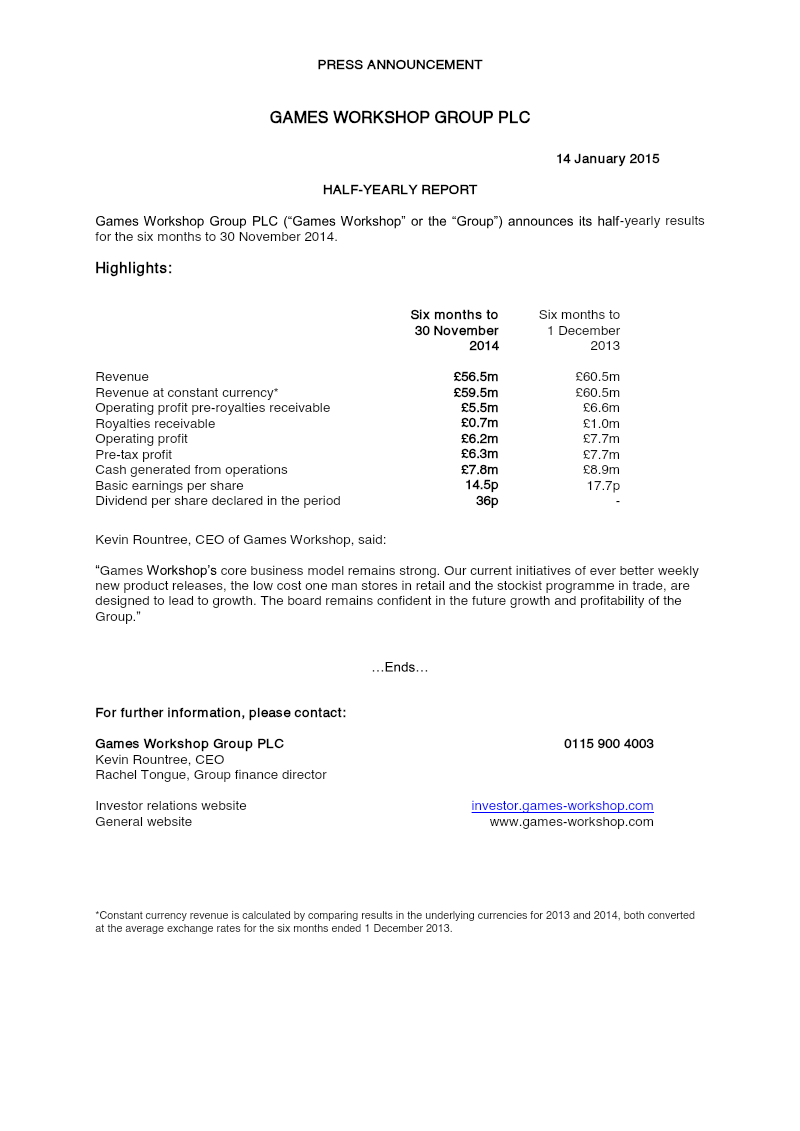
Games Workshop Group PLC (“Games Workshop” or the “Group”) announces its half-yearly results for the six months to 30 November 2014. Six months to Six months to Revenue £56.5m £60.5m Revenue at constant currency £59.5m £60.5m Operating profit pre-royalties receivable £5.5m £6.6m Royalties receivable £0.7m £1.0m Operating profit ...

  • Games Workshop Group PLC reported a 6.6% decline in revenue to £56.5 million for the six months to November 30, 2014, compared to £60.5 million in the prior year, with a constant currency decline of 1.7%.
  • Operating profit decreased to £6.2 million from £7.7 million in the previous year, and pre-tax profit also fell to £6.3 million from £7.7 million.
  • Basic earnings per share dropped to 14.5p from 17.7p, although a dividend of 36p per share was declared in the period, compared to none in the prior period.
  • Retail sales declined by 9.7% (£2.4 million) due to restructuring in North America and Continental Europe, and reduced sales from the Nottingham Visitor Centre; Trade sales also fell by 5.1% (£1.2 million).
  • Operating expenses were reduced by £3.2 million, including £2.7 million from retail channel costs and £1.0 million from the Continental European reorganization, resulting in a core business operating margin of 9.8% (down from 11.0% in 2013).
+1
Games Workshop Group
Page 1
Report14 pages

Half-Yearly Report and Trading Update: 2015-2016

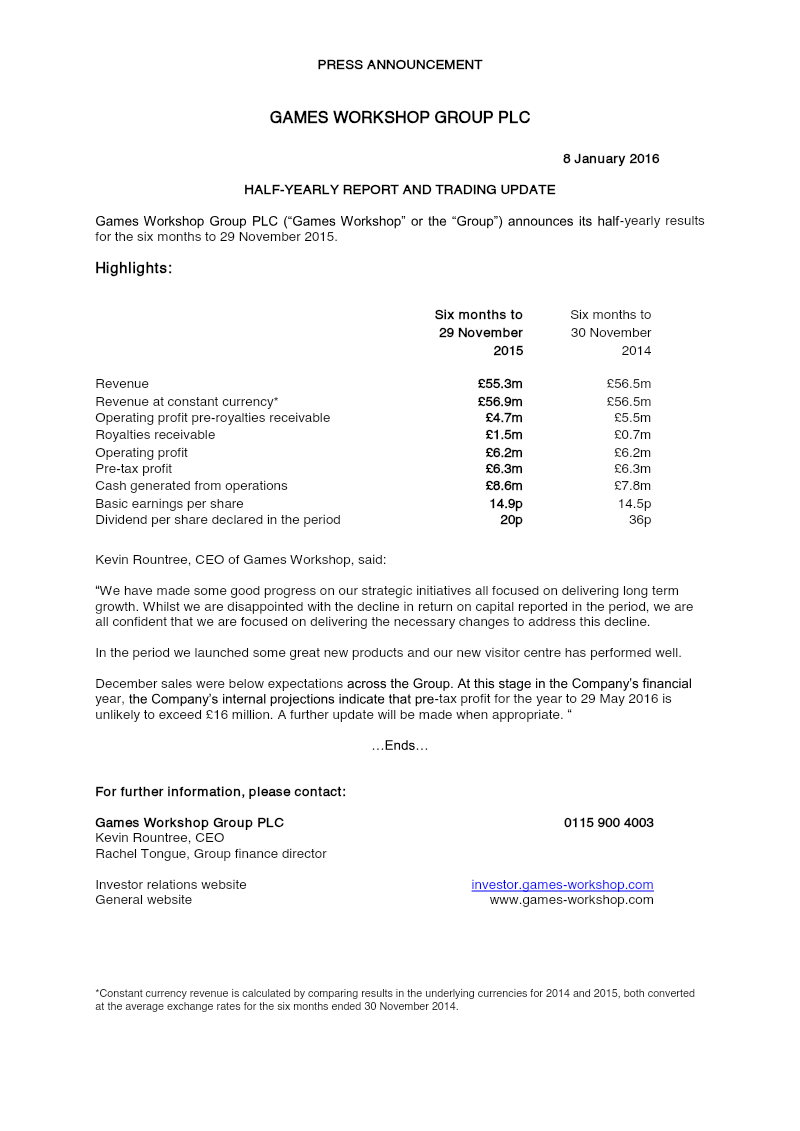
HALF-YEARLY REPORT AND TRADING UPDATE Games Workshop Group PLC (“Games Workshop” or the “Group”) announces its half-yearly results for the six months to 29 November 2015. Six months to Six months to 29 November 30 November 2015 2014 Revenue £55.3m £56.5m Revenue at constant currency £56.9m £56.5m Operating profit pre-royalties receivable ...

  • Games Workshop's pre-tax profit for the year to May 29, 2016, is projected to be no more than £16 million, and December sales were below expectations across the Group.
  • Revenue for the six months to November 29, 2015, decreased to £55.3 million from £56.5 million in the prior year, though it increased to £56.9 million at constant currency.
  • Operating profit remained flat at £6.2 million for the six months to November 29, 2015, compared to the previous year, but core business operating profit (pre-royalties) fell by £0.8 million to £4.7 million.
  • Return on capital declined from 38% in November 2014 to 36% in November 2015, attributed to increased average capital employed and a decline in operating profit before royalties.
  • Royalties receivable from licensing significantly increased from £0.7 million to £1.5 million in the period.
+1
Games Workshop Group
Page 1
Report16 pages

Half-Yearly Report: 2017

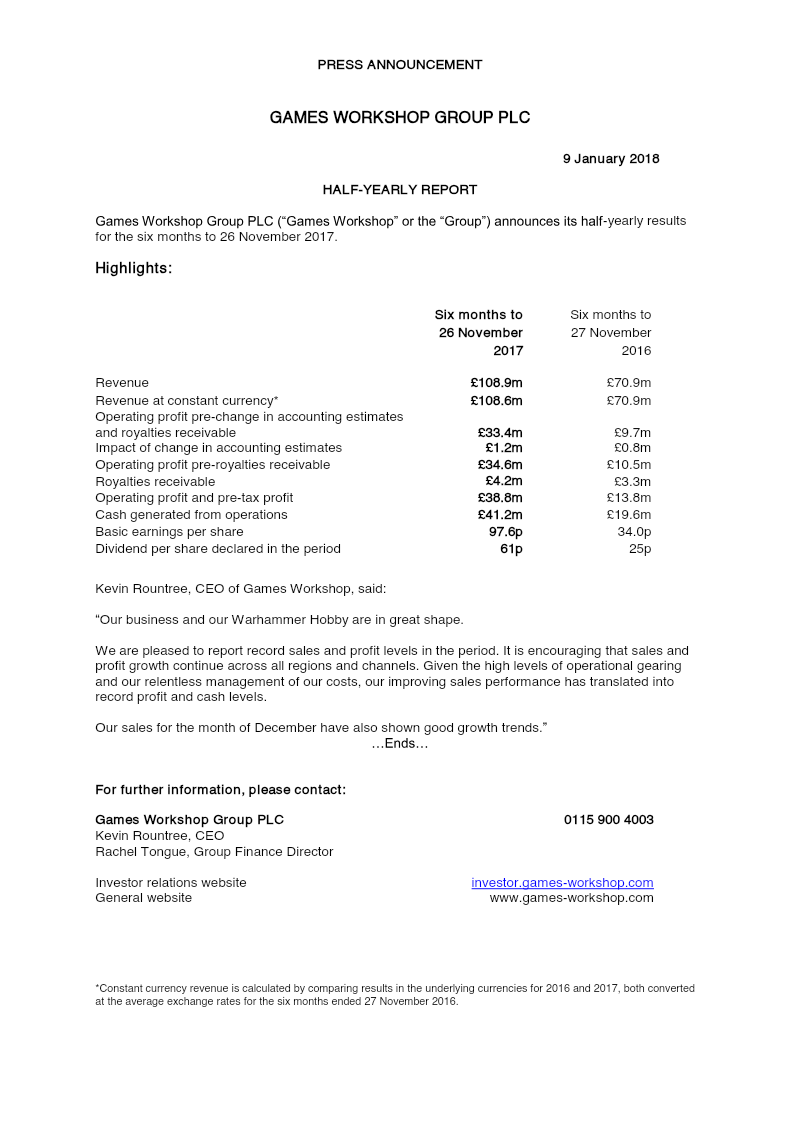
Games Workshop Group PLC (“Games Workshop” or the “Group”) announces its half-yearly results for the six months to 26 November 2017. 26 November 27 November Revenue £108.9m £70.9m Revenue at constant currency £108.6m £70.9m Operating profit pre-change in accounting estimates and royalties receivable £33.4m £9.7m Impact of change in accounting estimates ...

  • Games Workshop Group PLC reported record sales and profit for the six months to November 26, 2017, with revenue increasing by 53.6% to £108.9 million (from £70.9 million in 2016) and operating profit soaring by 181.2% to £38.8 million (from £13.8 million in 2016).
  • This strong performance translated into significantly higher earnings per share, which rose from 34.0p in 2016 to 97.6p in 2017, and a substantial increase in dividends declared, from 25p to 61p per share.
  • Growth was broad-based, with sales and profit increasing across all regions and channels, including a 71% rise in online shop sales and a 22% increase in digital publication sales through Apple, with new distribution channels like Amazon and Audible also launched.
  • The company's focus on its 'Warhammer Hobby' and continuous improvement of its miniatures range, combined with effective cost management, contributed to these record financial results and strong cash generation (£41.2 million from operations).
  • Games Workshop also saw significant growth in its Trade segment (up 63.5% to £47.96 million) and Mail Order segment (up 71.2% to £21.28 million) in external revenue for the period.
+2
Games Workshop Group
Page 1
Report16 pages

Half-Yearly Report: Six Months to 1 December 2019

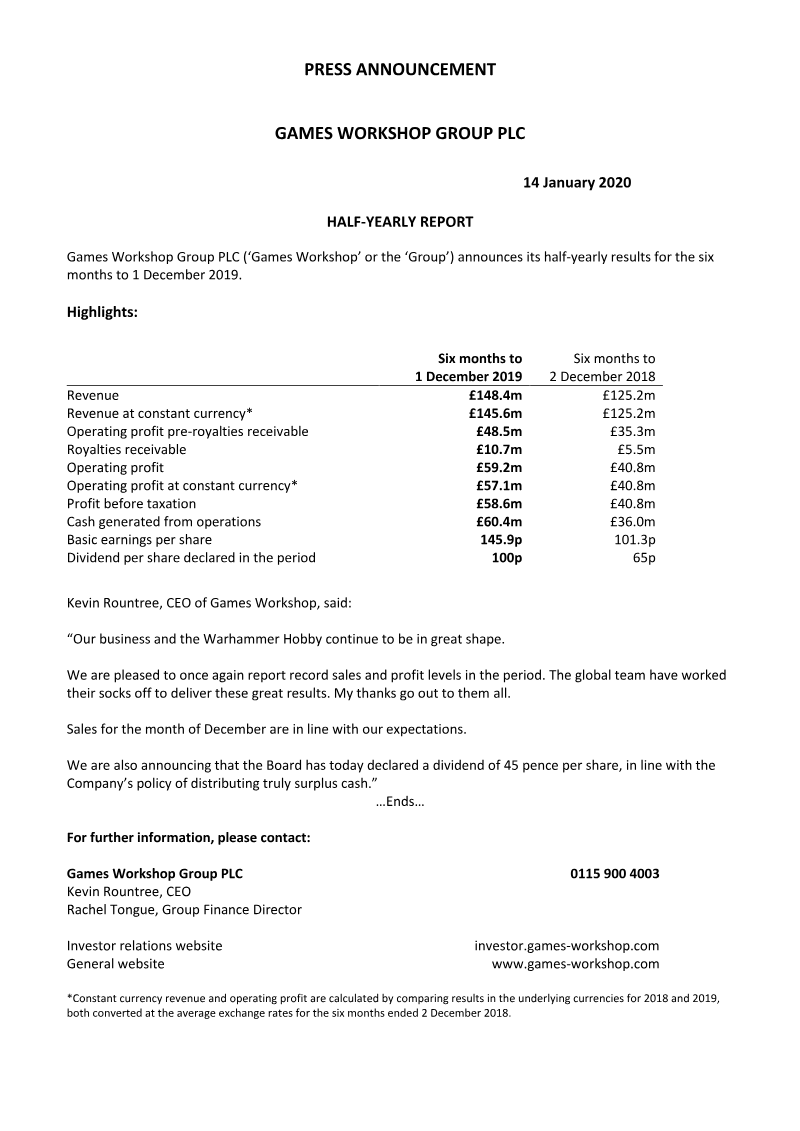
Games Workshop Group PLC (‘Games Workshop’ or the ‘Group’) announces its half-yearly results for the six Six months to Six months to 1 December 2019 2 December 2018 Revenue £148.4m £125.2m Revenue at constant currency £145.6m £125.2m Operating profit pre-royalties receivable £48.5m £35.3m Royalties...

  • Games Workshop Group PLC reported record sales and profit for the six months ending December 1, 2019, with revenue increasing by 19% to £148.4 million (16% at constant currency) and operating profit rising to £59.2 million from £40.8 million in the prior year.
  • Profit before taxation increased by £17.8 million to £58.6 million, and basic earnings per share grew to 145.9p from 101.3p.
  • Licensing income (royalties receivable) significantly increased by £5.2 million to £10.7 million, including £6.2 million from new license contracts, compared to £1.6 million in the previous year.
  • Sales growth was observed across all channels: Trade (£76.1 million), Retail (£45.3 million), and Online (£24.2 million).
  • The company declared dividends of 100p per share during the period, including a new dividend of 45 pence per share, and invested £5.7 million in capital projects.
+2
Games Workshop Group
Page 1
Report17 pages

Half-Yearly Report: 29 November 2020

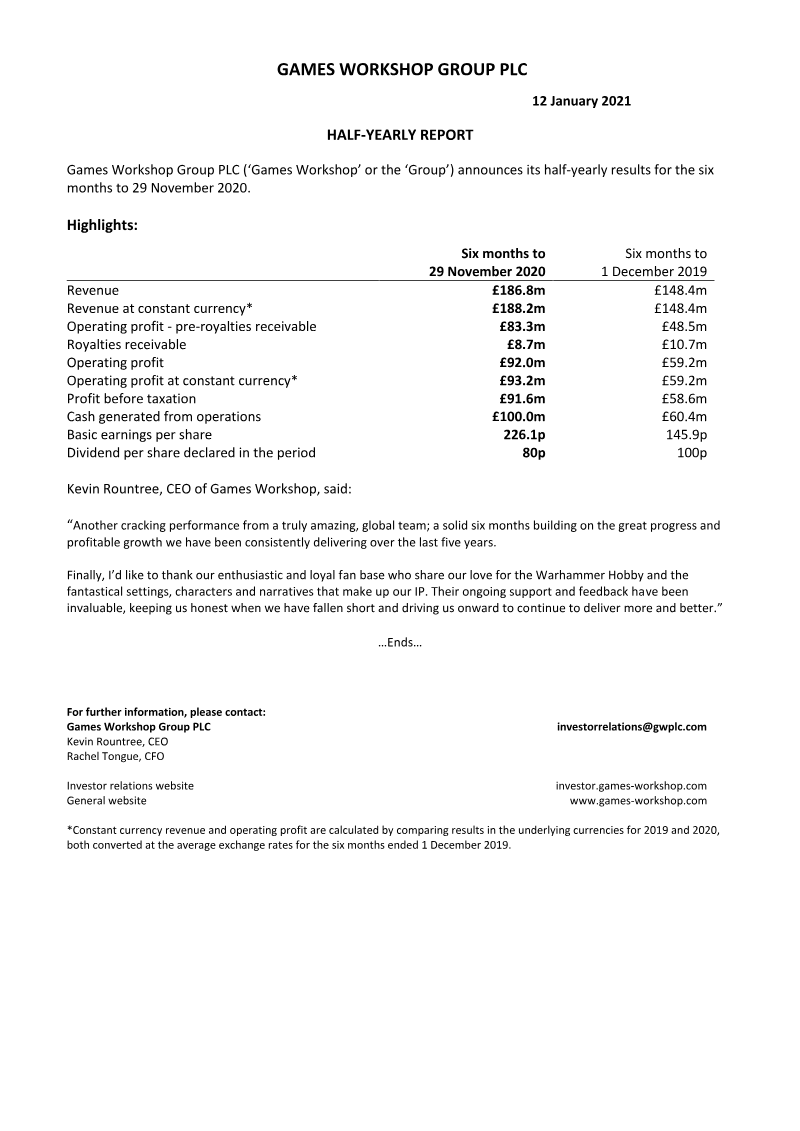
Games Workshop Group PLC (‘Games Workshop’ or the ‘Group’) announces its half-yearly results for the six Six months to Six months to 29 November 2020 1 December 2019 Revenue £186.8m £148.4m Revenue at constant currency £188.2m £148.4m Operating profit - pre-royalties receivable £83.3m ...

  • Games Workshop Group PLC reported significant growth for the six months to November 29, 2020, with revenue increasing to £186.8m from £148.4m in the prior year, and operating profit rising to £92.0m from £59.2m.
  • Profit before taxation for the period reached £91.6m, up from £58.6m, and basic earnings per share grew to 226.1p compared to 145.9p in the previous year.
  • Sales growth was strong across all channels, with trade sales up 33%, online sales up 87%, and retail sales broadly following government lockdown rules, contributing to a 26% overall sales increase.
  • The company achieved a 75% gross margin, a 6% increase, driven by higher volumes, and maintained a controlled cost-to-sales ratio of 28% (excluding group profit share and discretionary bonus), down from 36% in 2019.
  • Manufacturing output increased by 30% compared to the same period last year, with the new Warhammer 40,000 launch breaking production volume records, and the company is expanding its manufacturing capacity with a new factory nearing completion and securing additional land.
+2
Games Workshop Group
Page 1
Report21 pages

Half-Yearly Report: 2024–2025

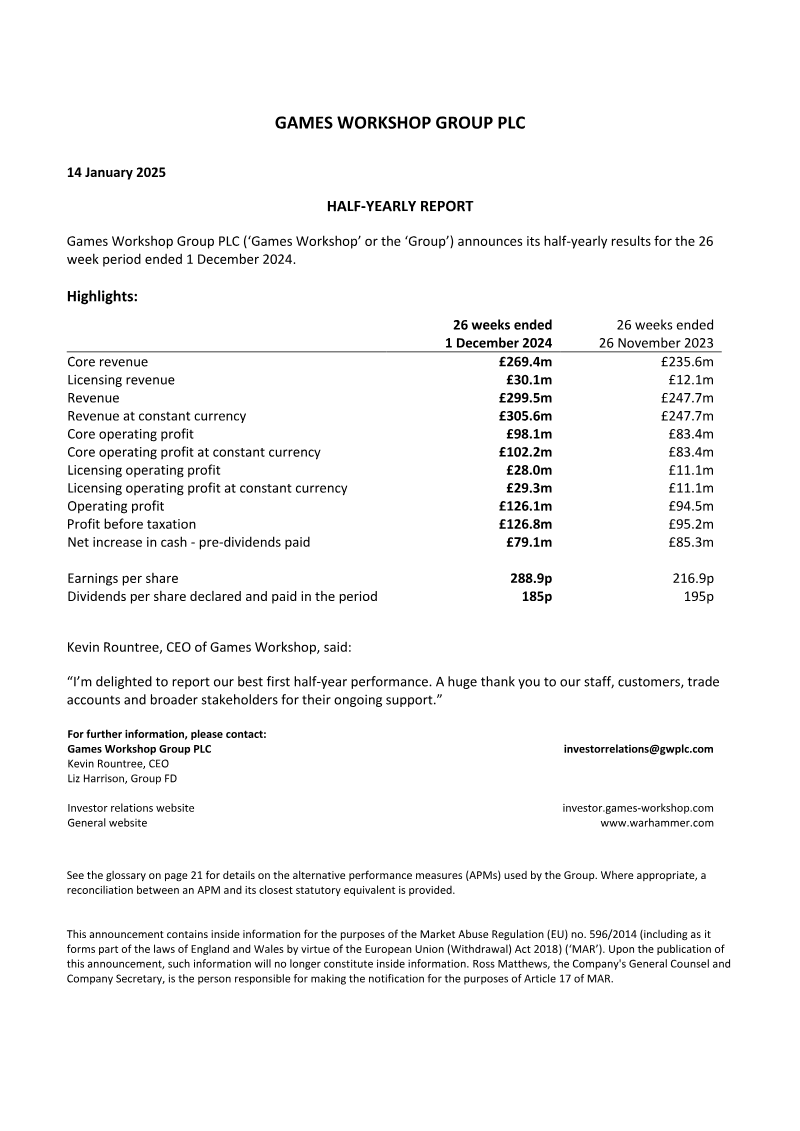
Games Workshop Group PLC (‘Games Workshop’ or the ‘Group’) announces its half-yearly results for the 26 week period ended 1 December 2024. 26 weeks ended 26 weeks ended 1 December 2024 26 November 2023 Core revenue £269.4m £235.6m Licensing revenue £30.1m £12.1m Revenue £299.5m £247.7m Revenue at cons...

  • Games Workshop Group PLC reported its best first half-year performance for the 26 weeks ended December 1, 2024, with total revenue reaching £299.5m, up from £247.7m in the prior year.
  • Operating profit significantly increased to £126.1m for the 26 weeks ended December 1, 2024, compared to £94.5m in the same period last year, with profit before taxation at £126.8m.
  • Core revenue grew by 14.3%, driven by strong performance in Trade (+21.7%) and Retail (+11.2%), although Online revenue decreased by 4.2%.
  • Licensing revenue saw substantial growth, increasing from £12.1m to £30.1m, with licensing operating profit rising from £11.1m to £28.0m.
  • Earnings per share rose to 288.9p for the 26 weeks ended December 1, 2024, up from 216.9p in the previous year.
+3
Games Workshop Group
Page 1
Report14 pages

FY24 Interim Results: Frontier Developments

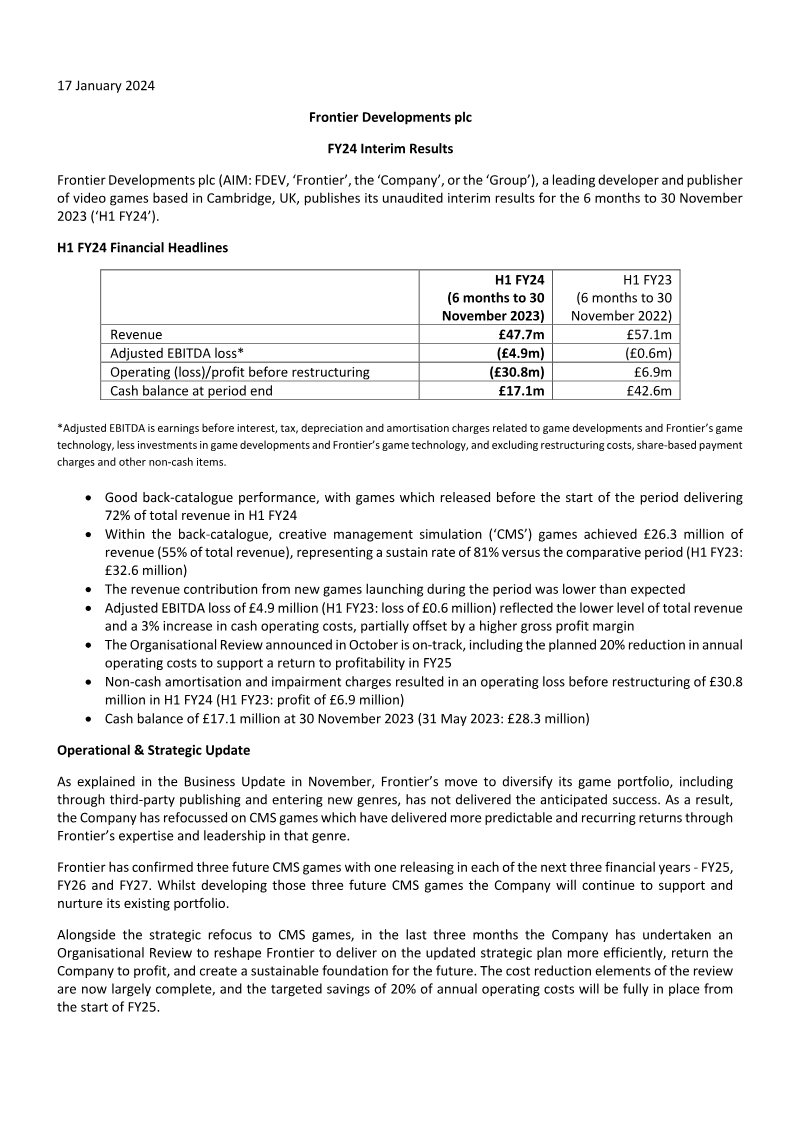
Frontier Developments plc (AIM: FDEV, ‘Frontier’, the ‘Company’, or the ‘Group’), a leading developer and publisher of video games based in Cambridge, UK, publishes its unaudited interim results for the 6 months to 30 November (6 months to 30 (6 months to 30 November 2023) November 2022) Revenue £47.7m £57.1m Adjusted EBITDA loss (£4.9m) (£0.6m) Operating (...

  • Frontier Developments experienced a significant financial downturn in H1 FY24 (6 months to 30 November 2023), reporting a £33.1 million loss after tax compared to a £6.7 million profit in H1 FY23, and an operating loss of £30.8 million versus a £6.9 million profit in H1 FY23.
  • Revenue decreased to £47.7 million in H1 FY24 from £57.1 million in H1 FY23, primarily due to lower-than-expected contributions from new game launches and a full impairment charge of £16.9 million for 'Realms of Ruin'.
  • The company's cash balance significantly reduced to £17.1 million at November 30, 2023, down from £42.6 million in H1 FY23, though it increased to £19.9 million by December 31, 2023, after receiving subscription fees.
  • Frontier is strategically refocusing on Creative Management Simulation (CMS) games, with three new CMS titles planned for release in FY25, FY26, and FY27, building on the strong performance of existing CMS games which generated £26.3 million (55% of total revenue) in H1 FY24.
  • An organizational review led to cost reduction efforts, targeting 20% savings in annual operating costs by the start of FY25, with a £2.5 million restructuring charge recorded in H1 FY24.
+2
Frontier Developments
Page 1
Report94 pages

Annual Report and Accounts 2024

ANNUAL REPORT AND ACCOUNTS 2024 30 YEARS OF HEADLINES CONTENTS CREATIVITY, STRATEGIC REPORT See a summary of the headlines for FY24, 01 Headlines INNOVATION AND ...

  • Frontier plans to release three self-published CMS (Creative Management Simulation) games in the next three consecutive financial years: Planet Coaster 2 in autumn 2024 (FY25), a new Jurassic World game in FY26, and a third unannounced CMS game in FY27.
  • Frontier reported a loss before taxation of £28.425 million for the 12 months ending May 31, 2024, an increase from £26.509 million in the previous year.
  • Net cashflows from operating activities decreased to £31.625 million in FY24 from £47.875 million in FY23, while net cashflows used in investing activities improved to (£27.868 million) from (£52.310 million).
  • The company incurred £1.4 million in costs from an Organizational Review in FY24, primarily due to redundancy costs, compared to £nil in FY23.
  • Frontier's total unrecognised tax losses increased to £109.5 million at May 31, 2024, from £80.2 million at May 31, 2023, with these losses having no expiry date.
+3
Frontier Developments
Page 1
Report13 pages

FY25 H1 Results: A Strong Turnaround

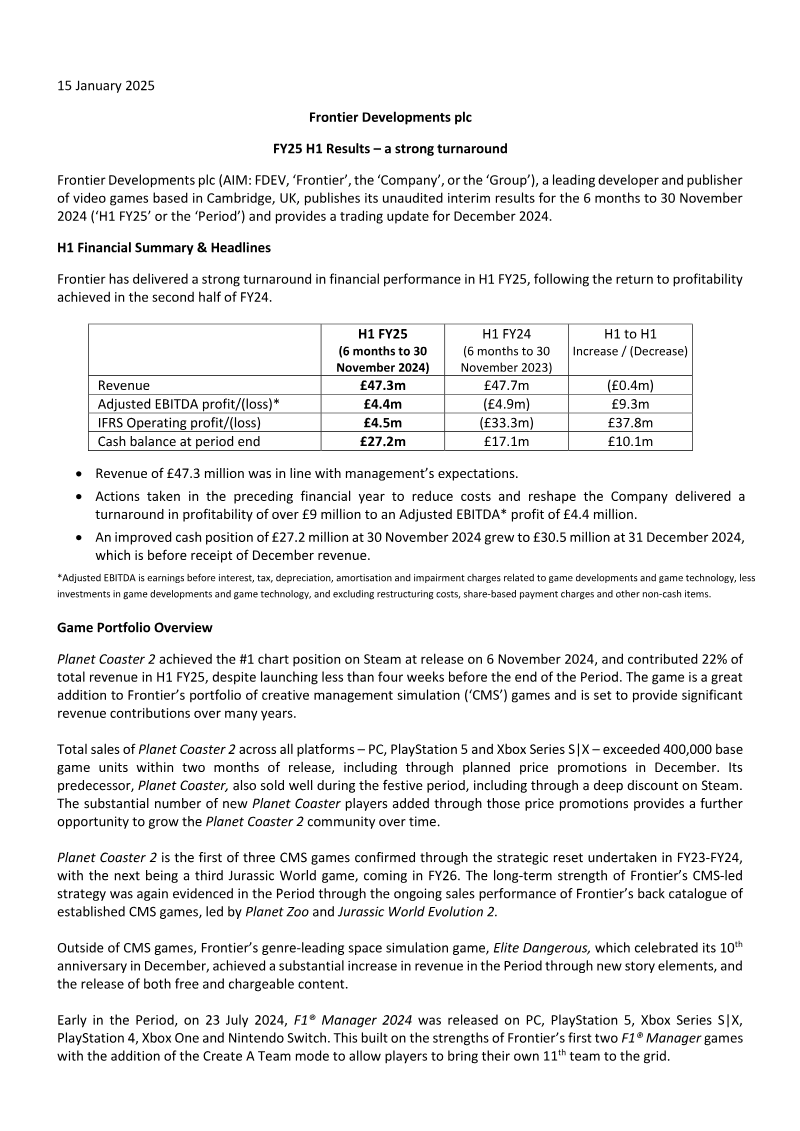
Frontier Developments plc reported a robust turnaround in its first half of FY25, with revenue of £47.3 million nearly matching the prior year’s £47.7 million and an adjusted EBITDA profit of £4.4 million, a swing from a £4.9 million loss in H1 FY24. Operating profit rose to £4.5 million from a £33.3 million loss, driven by significant cost reductions following an organisational review and the closure of Frontier Foundry. Cash reserves strengthened to £27.2 million at 30 November, rising to £30.5 million by 31 December after the November launch of Planet Coaster 2.

Planet Coaster 2, released on 6 November, dominated the period by contributing 22% of total revenue and selling over 400,000 base‑game units across PC, PS5, and Xbox Series platforms within two months. The game’s launch reinforced the company’s CMS strategy, supported by strong sales of existing titles such as Planet Zoo and Jurassic World Evolution 2. Elite Dangerous also saw revenue growth through new story content, while F1® Manager 2024 added a fresh title to the portfolio.

Cost efficiencies were evident: adjusted operating costs fell 25% to £28.5 million, R&D expenses dropped 21% to £19.5 million, and marketing and administrative costs declined 32%. Gross profit margin improved to 70% from 69%, reflecting a favourable revenue mix.

The company maintains a positive outlook for FY25, citing continued momentum from the CMS lineup and upcoming releases. Management expressed confidence in sustaining profitability and capitalising on planned content updates, while acknowledging subscription deal timing as a variable factor. Overall, the interim results demonstrate that Frontier’s strategic reset and disciplined cost management have restored profitability and positioned the firm for continued growth in the competitive video‑game market.
  • Frontier Developments achieved a significant financial turnaround in H1 FY25, swinging from a £4.9 million EBITDA loss in the prior year to a £4.4 million profit.
  • Operating profit reached £4.5 million, a substantial recovery from the £33.3 million loss reported in H1 FY24, driven by aggressive cost-cutting measures and the closure of the Frontier Foundry division.
  • The November 6 launch of Planet Coaster 2 generated 22% of total H1 revenue, selling over 400,000 units across PC, PS5, and Xbox Series platforms within two months.
  • Disciplined cost management reduced adjusted operating costs by 25% to £28.5 million, with R&D expenses falling 21% and administrative/marketing costs dropping 32%.
  • Cash reserves strengthened to £30.5 million by December 31, 2024, up from £27.2 million at the end of November.
+1
Frontier Developments
Page 1
Report3 pages

FY25 Trading Update: Strong Results and Increased Momentum

Frontier Developments plc reports a modest revenue rise to £90.6 million for FY25, up from £89.3 million in FY24, driven by a 25 % year‑on‑year increase in its Creative Management Simulation (CMS) titles. The three flagship CMS franchises—Planet Coaster, Planet Zoo and Jurassic World Evolution—accounted for 77 % of total revenue in FY25, a jump from 62 % the previous year. Planet Coaster alone grew almost 200 % following the launch of Planet Coaster 2, while Planet Zoo and Jurassic World Evolution maintained near‑stable sales levels.

Profitability improved sharply; Adjusted EBITDA is projected between £8 million and £9 million, compared with a £0.9 million profit in FY24, thanks to higher gross margins, reduced operating costs and a £3.5 million gain from selling publishing rights to Stranded: Alien Dawn. Adjusted Operating Profit, a new metric effective FY26 that incorporates tax credits and reliefs, is expected to reach £11 million‑£12 million in FY25.

Cash position strengthened, with cash on hand rising to £42.5 million from £29.5 million at the end of FY24, supporting a planned share buyback up to £10 million pending shareholder approval. The board also announced the creation of an Executive Board to streamline decision‑making and highlighted the upcoming release of Jurassic World Evolution 3 on 21 October 2025 as a key growth driver.

  • Frontier Developments achieved a significant increase in profitability, with projected Adjusted EBITDA rising to £8–£9 million from £0.9 million in FY24.
  • Revenue grew to £90.6 million, driven by a 25% year-on-year increase in Creative Management Simulation (CMS) titles, which now account for 77% of total revenue.
  • The launch of Planet Coaster 2 catalyzed a nearly 200% revenue increase for the Planet Coaster franchise.
  • The company’s cash position strengthened to £42.5 million, up from £29.5 million, enabling a proposed £10 million share buyback.
  • Profitability was bolstered by a £3.5 million gain from the sale of publishing rights to Stranded: Alien Dawn, alongside reduced operating costs.
+4
Frontier Developments

Publishers

Related Topics