Monetization
Documents

SensorTower The State of Mobile Gaming 2023
The 2023 SensorTower analysis demonstrates a pronounced shift in mobile gaming dynamics, with hyper‑casual titles experiencing a 24 % year‑over‑year decline in Q4 2022, while hybrid‑casual games grow 13 % and exclusive‑access titles surge 54 %. Revenue patterns echo this trend: action and tabletop genres record modest gains, whereas shooter, RPG, and casino segments suffer double‑digit drops. Geographic revenue distribution shows RPG dominance in Asia (39 %) but a more balanced genre mix across North America and Europe, each contributing at least 12 % of total earnings.
Hybrid‑casual games differentiate themselves through the adoption of meta‑features. Thirty percent of leading hybrid‑casual titles embed at least one such feature, compared with only five percent of hyper‑casuals. Character collection is the most prevalent meta‑feature, present in 18 % of hybrid‑casuals and boosting average playtime by 122 %. Downloads for hybrid‑casual games rose 17 % in Europe and a striking 124 % in Asia during 2022, while the global market grew 4 % YoY.
Live‑Ops events prove highly lucrative for flagship titles. Marvel Snap’s themed events generated between $670 k and $746 k on launch day, illustrating the monetization power of well‑timed in‑app events. SensorTower’s event‑tracking tool offers publishers granular revenue attribution, facilitating competitive benchmarking and schedule optimization.
Regional performance highlights divergent trends. Europe’s top five markets—Germany, the U.K., France, Russia, and Italy—saw a collective 6 % revenue decline to $700 million in Q4 2022, with Russia’s market plummeting 72 % YoY after the Ukraine conflict. Despite an 8 % overall download drop, Russia remained Europe’s largest volume market with 673 million downloads (24 % of the region). In contrast, Asia’s quarterly gross fell 15 % to $9.5 billion, largely due to a 20 % Google Play decline, while downloads stayed flat above 5.5 billion per quarter; India led the region by a wide margin.
- The mobile gaming market is shifting away from hyper-casual titles, which saw a 24% year-over-year decline in Q4 2022, toward hybrid-casual games that grew 13% and exclusive-access titles that surged 54%.
- Hybrid-casual games are successfully utilizing meta-features to drive engagement, with 30% of top titles embedding these features and character collection specifically boosting average playtime by 122%.
- Regional revenue performance is diverging, with Asia’s quarterly gross falling 15% to $9.5 billion and Europe’s top five markets experiencing a collective 6% revenue decline to $700 million in Q4 2022.
- Live-Ops events remain a primary monetization driver, evidenced by Marvel Snap’s themed events generating between $670,000 and $746,000 on their respective launch days.
- While global market downloads grew 4% year-over-year, hybrid-casual games significantly outperformed this average with download growth of 17% in Europe and 124% in Asia during 2022.

Gaming Spotlight 2023
Mobile gaming continues to dominate the industry’s growth trajectory, yet recent regulatory tightening and rising acquisition costs are poised to curb spend by roughly 2 % in 2023. The analysis underscores that creative optimization, diversified monetization models—including ads, subscriptions, and battle‑passes—and data‑driven partner insights are essential to counter ad fatigue and maintain daily active users, stickiness, and revenue in an increasingly fragmented market. Contextual market data is highlighted as a critical tool for staying ahead of evolving consumer preferences and macroeconomic headwinds.
First‑half 2023 data reveal that free‑to‑play titles remain the most influential drivers of downloads and in‑app purchase (IAP) revenue. “Monopoly GO” led mobile downloads with over 45 million installs and $232 million in IAP, attracting a slightly higher female audience and players aged 25‑34. “Honkai: Star Rail” achieved 62 million downloads and $457 million in spend, largely fueled by a high‑price bundle that accounted for 61 % of May revenue; it appeals more to male players but enjoys strong traction among Gen‑Z gamers. “Royal Match” secured the second spot in global spend with $1.7 billion, driven by a 20 % female skew and significant engagement from players aged 45 and older. These findings illustrate a demographic shift: match‑3 games are increasingly monetized by female and older players, while high‑ticket RPGs continue to attract Gen‑Z consumers.
Survey results indicate a sharp decline in U.S. mobile gamers’ positive sentiment toward in‑game video ads—from 50 % “like” in Q3 2020 to 30 % by Q3 2022—while rewarded‑video ads maintain a more favorable reception at around 40 %. The drop aligns with the rollout of Apple’s ATT framework, yet ad fatigue and oversaturation are identified as primary drivers rather than regulatory causation. The recommendation is to diversify ad formats, prioritizing rewarded videos and playable ads, and to tailor these experiences to specific demographic segments to mitigate fatigue and sustain growth.
- Mobile gaming spending is projected to decline by approximately 2% in 2023 due to rising acquisition costs and increased regulatory pressure.
- High-performing titles demonstrate distinct demographic trends: 'Royal Match' generated $1.7 billion in revenue with a strong base of players aged 45+, while 'Honkai: Star Rail' captured $457 million by targeting Gen-Z with high-price bundles.
- Consumer sentiment toward standard in-game video ads has dropped significantly, falling from 50% positive in Q3 2020 to 30% by Q3 2022, largely due to ad fatigue and market oversaturation.
- Rewarded video ads remain more effective than standard video ads, maintaining a 40% favorability rating among U.S. mobile gamers.
- 'Monopoly GO' emerged as a top performer in early 2023, securing 45 million installs and $232 million in IAP revenue, particularly among the 25-34 age demographic.
2023 Casual Gaming Apps Report
The casual gaming landscape in 2023 is defined by a strategic pivot from rapid user acquisition toward long-term profitability and sophisticated engagement models. While iOS acquisition costs significantly exceed those of Android at $2.23 compared to $0.63, both platforms achieve a comparable Day-7 return on ad spend of approximately 7.7%. North America remains the most expensive yet lucrative market, yielding an 8.1% return on ad spend despite a high $3.59 cost per install. Simulation games have emerged as a particularly efficient entry point for developers, maintaining the lowest acquisition costs at $0.59.
Casual titles serve as the primary engine for the broader mobile ecosystem, driving 74% of installs across all gaming categories and nearly 75% of mid-core installs. Hyper-casual and puzzle games remain the dominant traffic sources, but the industry is increasingly embracing hybridization. This trend involves layering complex meta-elements, such as narrative progression and competitive social features, over simple core mechanics. By blending ad-based and in-app purchase monetization models, developers are successfully targeting crossover audiences and extending the lifecycle of traditionally short-lived genres.
Engagement strategies now heavily rely on competitive mechanics and gameplay diversification. Approximately 90% of leading level-based titles utilize solo leaderboards, while over half incorporate team-based races, debunking the myth that casual players avoid competitive environments. Furthermore, nearly a quarter of top-grossing casual games integrate minigames, such as hidden object or board game mechanics, to refresh the user experience and lower acquisition barriers. These features collectively deepen player retention and monetization, signaling a shift toward more robust, feature-rich casual experiences that prioritize player depth over simple volume.
- Casual gaming now accounts for 74% of all mobile game installs and drives nearly 75% of mid-core game installations.
- Developers are shifting from volume-based user acquisition to hybrid models that blend ad-based revenue with in-app purchases to extend player lifecycles.
- North America remains the most expensive market with a $3.59 cost per install, yet it maintains a high 8.1% return on ad spend.
- While iOS acquisition costs ($2.23) are significantly higher than Android ($0.63), both platforms deliver a comparable Day-7 return on ad spend of approximately 7.7%.
- Simulation games currently offer the most efficient entry point for developers, maintaining the lowest acquisition costs at $0.59 per install.

Gaming Spotlight 2023 Review
The global gaming market in 2023 was defined by a complex interplay between mobile contraction and steady growth in the PC and console sectors. While mobile remains the industry’s largest segment, consumer spending fell 2% to $108 billion, a decline attributed to macroeconomic instability and privacy-related shifts such as Apple’s App Tracking Transparency framework. Conversely, the PC and home console markets expanded by 4% and 3% respectively, bolstered by the rising popularity of subscription services. Handheld gaming also experienced a demographic fragmentation, with the Nintendo Switch Lite attracting a younger, female-leaning audience while the Steam Deck appealed to older, male gamers. Emerging technologies like cloud-streamed gaming are gaining significant traction, projected to reach $3.8 billion in revenue with mobile devices facilitating over a quarter of global streaming hours.
Success in the first half of 2023 was concentrated among high-performing titles that leveraged Gen Z engagement and sophisticated in-app purchase models. Monopoly GO and Honkai: Star Rail emerged as standout performers, generating hundreds of millions in revenue within their first months of release. Established franchises like Royal Match and FIFA Soccer also reached significant lifetime milestones, surpassing $1.7 billion and $1 billion respectively. These successes occurred despite a challenging user acquisition landscape where gamer sentiment toward traditional advertising formats has turned increasingly negative. While rewarded video and playable ads remain the most tolerated formats, overall ad fatigue is rising due to market oversaturation.
To navigate this evolving environment, the industry must adapt to shifting privacy standards and the impending implementation of Google’s Privacy Sandbox. Although data suggests that privacy frameworks have not directly damaged iOS ad sentiment, the general decline in ad acceptance necessitates a move toward more diverse formats and contextual market data. Strategic focus is shifting toward combating rising acquisition costs through high-value player engagement and the optimization of cross-platform experiences. As the market stabilizes, the integration of cloud services and the continued dominance of mobile-first economies in emerging regions will likely dictate the next phase of global industry growth.
- The global mobile gaming market contracted by 2% to $108 billion in 2023, driven by macroeconomic instability and privacy-related shifts like Apple’s App Tracking Transparency.
- PC and home console markets grew by 4% and 3% respectively, largely supported by the increasing adoption of subscription-based models.
- Cloud-streamed gaming is a growing revenue stream projected to reach $3.8 billion, with mobile devices accounting for over 25% of total streaming hours.
- High-performing titles like Monopoly GO and Honkai: Star Rail achieved rapid, massive revenue success by targeting Gen Z and utilizing sophisticated in-app purchase models.
- Rising ad fatigue and negative sentiment toward traditional advertising are forcing developers to move away from standard formats toward rewarded video, playable ads, and contextual market data.
2023 Liftoff Company Midcore Gaming Apps Report
The midcore mobile gaming market in 2023 is defined by a strategic pivot toward deeper gameplay mechanics and diversified monetization streams, now commanding 35% of total iOS gaming revenue in the United States. While North America remains the most lucrative region with a 4.5% Day-7 return on ad spend, significant performance disparities exist between platforms. Android offers a more cost-effective environment for user acquisition compared to iOS, though the shooter genre remains the most expensive and rewarding category, commanding a $7.47 cost per install alongside a leading 6% Day-7 return on ad spend.
Market longevity favors midcore titles over casual alternatives, as evidenced by midcore games being twice as likely to maintain a top-200 grossing position over a twelve-month period. The strategy genre, particularly 4X and "Build & Battle" subgenres, continues to dominate revenue charts. To sustain this momentum, developers are increasingly adopting sophisticated engagement models such as extraction shooter mechanics, multi-layered Battle Passes with dedicated storefronts, and seasonal progression resets designed to prevent late-game stagnation.
Operational strategies have shifted toward aggressive LiveOps and the circumvention of traditional platform fees. Top-performing titles typically manage fifteen simultaneous unique events and fifteen limited-time gachas to drive consistent monetization. Furthermore, publishers are leveraging legal shifts to direct players toward external web stores, offering better value while avoiding app store commissions. Competitive social structures remain the backbone of retention, with 88% of leading midcore games utilizing permanent PvP seasons and over half incorporating guild-based competitions to foster long-term player commitment.
- Midcore mobile games now account for 35% of total iOS gaming revenue in the United States, demonstrating significantly higher market longevity than casual titles.
- Shooter games represent the most high-stakes category, commanding a $7.47 cost per install while delivering a leading 6% Day-7 return on ad spend.
- Top-performing midcore titles maintain engagement through aggressive LiveOps, typically running fifteen simultaneous unique events and fifteen limited-time gachas at any given time.
- Retention strategies are heavily reliant on competitive social structures, with 88% of leading titles utilizing permanent PvP seasons and over 50% incorporating guild-based competitions.
- North America remains the most lucrative region for midcore apps, yielding a 4.5% Day-7 return on ad spend despite performance disparities between Android and iOS user acquisition costs.
Hyper to Hybrid: Mobile Gaming Market Trends 2023
The mobile gaming landscape is undergoing a fundamental shift as developers transition from hyper-casual to hybrid-casual business models. This evolution is driven by a significant downward trend in ad revenue profitability, influenced by Apple’s App Tracking Transparency framework, shifting post-pandemic user behaviors, and increased selectivity from major publishers. To maintain sustainability, developers are increasingly adopting self-publishing strategies and integrating sophisticated meta-gameplay components alongside in-app purchases to diversify revenue streams beyond traditional advertising.
Data from the 2022 calendar year reveals a cooling market for ad-centric models, characterized by declining ad impressions and effective cost per mille (eCPM) across both Android and iOS platforms. Conversely, the volume of in-app purchases grew on both operating systems, signaling a successful pivot toward hybrid monetization. Geographically, India emerged as the leader for Android installs, while the United States maintained its position as the primary market for both ad revenue and in-app purchase value across all devices.
The competitive landscape for ad networks and monetization channels shows distinct platform preferences. Apple Search Ads dominates iOS rankings for installs, retention, and lifetime value, while AppLovin and ironSource lead the Android market. AppLovin currently stands as the top monetization channel by total ad revenue on both platforms. These findings are based on anonymized data from the full 2022 period, utilizing a weighted average methodology for performance metrics and focusing on networks and regions that exceeded a threshold of 25 million installs. The analysis underscores a broader industry movement toward deeper player engagement and more complex economic structures in mobile gaming.
- Mobile developers are shifting from hyper-casual to hybrid-casual models to counter declining ad revenue profitability caused by Apple’s App Tracking Transparency and post-pandemic behavioral shifts.
- In-app purchase volume grew across both Android and iOS in 2022, signaling a successful industry-wide pivot toward diversified revenue streams beyond traditional advertising.
- Ad-centric monetization models faced a cooling market in 2022, characterized by a downward trend in both ad impressions and effective cost per mille (eCPM) on all platforms.
- Apple Search Ads is the top-performing channel for iOS installs, retention, and lifetime value, while AppLovin and ironSource lead the Android market.
- AppLovin currently serves as the leading monetization channel by total ad revenue across both Android and iOS platforms.
In-Game Spending: Parents' Supervision of In-Game Spending 2023
The research investigates how parents supervise and manage their children’s in‑game purchases, tracking trends across five European markets—United Kingdom, France, Germany, Spain and Italy—over four survey waves (2018, 2019, 2020 and 2023). Each wave surveyed adult parents or guardians of children who play video games, with sample sizes ranging from 962 in 2018 to 2,808 in 2023, providing a broad cross‑section of the region’s gaming households.
Findings show that three‑quarters of parents consistently report that their children do not spend on in‑game extras, a proportion that has remained stable since 2020. Among the minority who do spend, the average monthly outlay rose from €33 in 2020 to €39 in 2023, reflecting a €6 increase that aligns with inflation. Most spending (64 %) falls within the €1‑20 range, with the most popular items being gameplay‑impacting content (34 %) and decorative or cosmetic items (just under one third). Loot boxes and other unknown‑reward items remain relatively unpopular.
Parental oversight is high: nine‑in‑ten parents of spending children have some form of agreement, half of which are explicit—either seeking permission (38 %) or setting limits (23 %). Preferred monitoring tools include credit‑card bill checks, parental‑control settings, and two‑factor authentication, though 44 % of parents who avoid controls deem them unnecessary and 32 % find them difficult to activate. Awareness of in‑game currency and loot boxes among all players (ages 11‑64) is also limited, with only 9 % having purchased in‑game currency and 4 % having bought loot boxes. The study’s methodology relies on standardized questionnaires administered to representative adult panels in each country, ensuring comparability within each survey year while noting that cross‑year comparisons are constrained by methodological changes.
- Three-quarters of children do not engage in in-game spending, a figure that has remained stable since 2020.
- Average monthly in-game spending among children who do spend increased from €33 in 2020 to €39 in 2023, a rise consistent with inflation.
- The majority of in-game spending (64%) is concentrated in the €1–20 monthly range, with gameplay-impacting content (34%) and cosmetic items (33%) being the most popular purchases.
- Parental oversight is high, with 90% of parents of spending children maintaining some form of agreement, including explicit permission requirements (38%) or spending limits (23%).
- While 44% of parents who do not use parental controls consider them unnecessary, 32% report that they find these tools difficult to activate.

Misleading (Non-Core) Gameplay Ads Research 2023
The prevalence and perception of non-core gameplay advertisements, often categorized as misleading, represent a significant shift in mobile gaming marketing strategies. Based on a 2023 survey of 5,212 respondents across the United States, Japan, Europe, and Brazil, findings indicate that a vast majority of gamers have encountered these ads. Recognition is highest in the United States at 91%, while other regions range between 71% and 77%. Despite the controversial nature of these promotions, approximately 75% of players in Western markets and 70% in Japan and Brazil admit that the mechanics showcased in these ads are often more fascinating than the actual core gameplay of the advertised titles.
The research challenges the assumption that misleading ads lead to immediate user churn. Between 35% and 46% of gamers reported they would continue playing a game despite the discrepancy, choosing to evaluate the product on its own merits rather than the accuracy of the advertisement. Players generally understand that developers use these tactics to inflate download numbers and revenue or to revitalize interest in older titles. The most appealing elements of these ads are the specific gameplay mechanics and puzzles, while user interface and new features hold the least draw. Notable titles associated with this phenomenon include Hero Wars, various "Scapes" games, and Evony.
Demographic data reveals that the modern gaming audience is maturing, with nearly 10% of U.S. gamers over the age of 60 and less than 2.5% of the global sample under 18. Regional preferences vary significantly; casual titles dominate the U.S. market, while RPGs and complex math-based mechanics are preferred in Japan. In Europe and Brazil, competitive RPG and MMORPG genres lead in popularity. While engagement is high in the West, with many playing over 18 hours weekly, nearly half of Japanese respondents play for less than four hours per week. Ultimately, the industry is seeing a blurring of lines as developers integrate these advertised mini-games into their products to transition from "misleading" to "non-core" content.
- Approximately 75% of Western players and 70% of Japanese and Brazilian players find the mechanics shown in misleading ads more engaging than the actual core gameplay of the advertised titles.
- Between 35% and 46% of gamers continue playing a title despite recognizing that the advertisement does not accurately represent the core gameplay experience.
- Ad recognition is widespread, with 91% of U.S. respondents and 71% to 77% of respondents in other surveyed regions reporting exposure to non-core gameplay advertisements.
- Developers are increasingly integrating these advertised mini-games into their actual products to convert misleading marketing into legitimate non-core content.
- Players identify specific gameplay mechanics and puzzles as the most appealing elements of these ads, while user interface and new features are the least effective drivers of interest.

5 Mobile App Forecasts: 2023
Global mobile market projections for 2023 indicate a complex landscape defined by shifting consumer priorities and economic pressures. While total mobile advertising spend is expected to reach $362 billion, growth is projected to slow due to macroeconomic headwinds. Short-form video apps are anticipated to be the primary drivers of this ad spend, helping to offset a decline in performance marketing budgets. Conversely, mobile gaming is facing a downturn, with consumer spending forecasted to drop to $107 billion in 2023. This decline is attributed to a combination of the global economic squeeze and tightening privacy regulations, such as IDFA and Google’s upcoming changes, which complicate the targeting of high-spending users.
Despite the contraction in gaming spend, specific high-performing titles continue to reach massive financial milestones. Fourteen new apps and games are projected to surpass $2 billion in lifetime consumer spend during 2023, with eleven of those being games. Notably, the video streaming sector remains robust, with platforms like HBO Max and iQIYI expected to join the $3 billion lifetime spend club, reflecting a sustained consumer shift toward mobile-first entertainment.
The broader mobile economy is also seeing a migration of retail dollars toward experiential sectors. As discretionary income tightens, consumers are prioritizing travel, live events, sports, and wellness over physical goods. This shift is supported by a long-term trend of increasing mobile engagement; total time spent in apps is forecasted to surpass 6 trillion hours by 2028. This growth is fueled by 5G rollout and the deepening personalization of apps, with emerging markets in Latin America, Southeast Asia, and the Middle East driving significant engagement. These findings are based on proprietary market estimates and historical data analysis of global app store performance and consumer behavior.
- Mobile gaming consumer spending is projected to decline to $107 billion in 2023 due to macroeconomic pressures and stricter privacy regulations like IDFA.
- Global mobile advertising spend is expected to reach $362 billion in 2023, with short-form video apps serving as the primary growth driver to offset reduced performance marketing budgets.
- Eleven of the fourteen new apps projected to surpass $2 billion in lifetime consumer spend during 2023 are games, demonstrating that top-tier titles remain resilient despite the broader market downturn.
- The video streaming sector is showing sustained growth, with platforms like HBO Max and iQIYI expected to reach the $3 billion lifetime consumer spend milestone.
- Consumer spending is shifting away from physical goods toward experiential sectors like travel, live events, sports, and wellness as discretionary income tightens.
Mobile Growth & Monetization Report 2023
The mobile gaming landscape in 2023 reflects a strategic pivot toward operational efficiency as developers navigate softening in-app purchase (IAP) and advertising revenues. Success currently hinges on capturing player interest within the first 14 days, a critical window where 77% of all conversions occur. To capitalize on this timeframe, monetization strategies emphasize low-friction price points between $1.01 and $5.00, with high-performing assets such as virtual currencies, limited-time bundles, and sales generating over 56% of total IAP revenue.
Beyond direct purchases, the integration of rewarded video ads and offerwalls has become essential for sustaining non-paying user bases. Strategic ad placement between levels or within game lobbies yields the highest engagement, particularly when incentivized by currency or gacha mechanics. Offerwalls, in particular, represent a significant growth lever, contributing 33% of total ad revenue for games utilizing multi-faceted monetization. These tools also serve as powerful retention drivers; players engaging with offerwalls demonstrate a 14% retention rate at Day 90, vastly outperforming the 3% rate seen among non-converters.
From a global marketing perspective, hypercasual advertising remains the most effective conversion engine across the majority of gaming genres. Advertisers are increasingly looking toward high-value Tier-2 markets, noting exceptional click-through rates for sports titles in Japan and trivia games in South Korea. Furthermore, the adoption of Custom Store Pages is emerging as a vital tactic for improving return on investment, particularly within the puzzle, casino, and lifestyle segments. These findings underscore a broader industry trend toward data-driven personalization and diversified revenue streams to maintain long-term player lifetime value.
- 77% of all player conversions occur within the first 14 days, making this initial window the most critical period for monetization.
- Low-friction price points between $1.01 and $5.00 are the primary drivers of in-app purchase revenue, with virtual currencies and limited-time bundles accounting for over 56% of total IAP income.
- Offerwalls are a major retention driver, as players who engage with them exhibit a 14% retention rate at Day 90 compared to only 3% for non-converters.
- Offerwalls contribute 33% of total ad revenue for games that employ a multi-faceted monetization strategy.
- Rewarded video ads and offerwalls are essential for sustaining non-paying users, with the highest engagement occurring when ads are placed between levels or within game lobbies.
The State of Mobile Gaming in India: A Look at India's Casual, Hyper-Casual, and Real Money Gaming App Industry Trends
This analysis examines the rapid expansion and evolving user behavior within the Indian mobile gaming market, focusing on the casual, hyper-casual, and real-money gaming (RMG) segments. The primary thesis asserts that while the COVID-19 pandemic and increased smartphone penetration triggered a massive "gold rush" in installs and engagement, the industry now faces a critical inflection point. As organic growth stabilized in 2022, the focus for developers has shifted from simple acquisition to sophisticated, insights-led retention and monetization strategies to sustain long-term profitability.
Key findings value the Indian gaming industry at $2.6 billion, with projections to reach $8.6 billion by 2027. Data indicates that India has surpassed the United States in terms of user base, exceeding 300 million gamers. During the 2021 pandemic waves, casual games saw a 90% uplift in installs, while RMG apps experienced significant revenue fluctuations, including a 35% increase in April 2021. However, the data reveals a downward trend in "stickiness" and installs moving into 2022, highlighting a retention crisis where 68% of users engage with an app fewer than ten times.
The scope of the research covers the Indian market from 2021 through the first quarter of 2022, utilizing data from over 100 gaming brands. The methodology relies on a combination of market analysis from MoEngage, AppTweak, and AppsFlyer, incorporating normalized trends in installs, In-App Advertising (IAA), and In-App Purchases (IAP).
The conclusions emphasize that technical optimization and personalized engagement are mandatory for survival. Effective strategies identified include App Store Optimization (ASO) to improve discoverability, RFM (Recency, Frequency, Monetary) segmentation to target "champion" players, and the use of predictive AI to prevent churn. The findings suggest that brands utilizing multi-channel engagement platforms can achieve push notification conversion rates as high as 91%, which is essential for navigating India's highly competitive and maturing digital landscape.
- The Indian gaming industry is projected to grow from $2.6 billion in 2022 to $8.6 billion by 2027, supported by a user base exceeding 300 million gamers.
- The industry is facing a significant retention crisis, with 68% of users engaging with a gaming app fewer than ten times.
- Following a pandemic-era surge where casual game installs rose 90% and RMG revenue grew 35% in April 2021, organic growth stabilized and declined throughout 2022.
- Brands utilizing multi-channel engagement platforms can achieve push notification conversion rates as high as 91%.
- To combat churn and sustain profitability, developers must shift from acquisition-focused models to strategies like RFM (Recency, Frequency, Monetary) segmentation and predictive AI.
From Hyper to Hybrid: Hypercasual Gaming Trends 2023
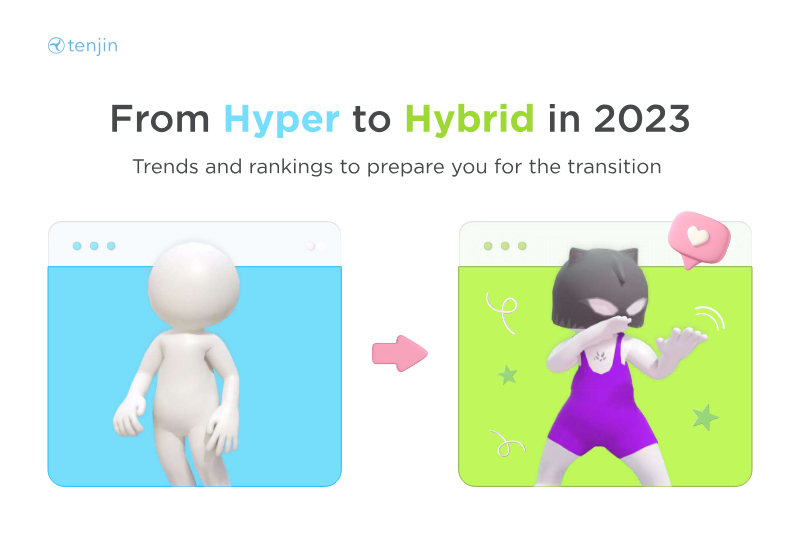
The mobile gaming landscape is undergoing a significant structural shift as developers transition from hyper-casual models toward hybrid-casual strategies. This evolution is driven by a marked decline in ad revenue profitability, influenced by the implementation of App Tracking Transparency on iOS, shifting post-pandemic user behaviors, and increased selectivity from major publishers. To maintain sustainability, developers are increasingly integrating in-app purchases and meta-gameplay components into their titles while opting for self-publishing models to retain greater control over their assets.
Data from 2022 reveals a downward trend in ad impressions and eCPMs across both Android and iOS platforms. Conversely, the volume of in-app purchases grew on both operating systems, signaling a successful pivot toward diversified monetization. Geographically, the United States remains the dominant market, ranking first for both ad revenue and in-app purchases across platforms. India emerged as the leading territory for total installs on Android, highlighting the importance of emerging markets for scale, even as monetization remains concentrated in Tier 1 regions.
The competitive landscape for ad networks and monetization channels shows distinct leaders. Apple Search Ads dominates the iOS ecosystem, securing the top position in multiple categories including retention and lifetime value. On Android, AppLovin and ironSource lead the market. AppLovin specifically stands out as the top monetization channel by total ad revenue on both operating systems. For eCPM performance, Meta Audience Network and ironSource lead on Android and iOS respectively.
These findings are based on anonymized data collected throughout the 2022 calendar year, utilizing a weighted average methodology. The analysis focuses on high-scale performance, only including countries and ad networks that exceeded a threshold of 25 million installs. This comprehensive view underscores a broader industry movement where the traditional reliance on pure advertising is being replaced by a more balanced, hybrid approach to game design and revenue generation.
- The mobile gaming industry is shifting from hyper-casual to hybrid-casual models, driven by declining ad revenue profitability and the impact of iOS App Tracking Transparency.
- Developers are increasingly adopting in-app purchases and meta-gameplay components to replace the traditional reliance on pure advertising revenue.
- Data from 2022 shows a consistent downward trend in ad impressions and eCPMs across both Android and iOS platforms, while in-app purchase volume grew.
- The United States remains the primary market for both ad revenue and in-app purchases, while India leads in total Android installs, emphasizing the split between scale in emerging markets and monetization in Tier 1 regions.
- AppLovin is the leading monetization channel by total ad revenue across both iOS and Android platforms.