Mobile
Documents
Modern Mobile Consumer 2022: App Discovery Report
The Modern Mobile Consumer 2022: App Discovery Report examines the evolving journey of mobile users from initial app discovery to daily usage and long-term engagement. The primary thesis suggests that the traditional distinction between gamers and non-gamers is increasingly obsolete, as consumer behaviors and attitudes toward advertising are remarkably consistent across different app categories. Findings indicate that mobile gaming has become a universal hobby, with 60% of non-gaming app users playing mobile games daily, tying with social media for the top usage category.
Data highlights the dominance of in-app advertising as a discovery tool, with 70% of gaming audiences and 78% of a control group reporting they have downloaded apps after seeing mobile advertisements. While most users maintain over 20 apps on their devices, the majority only engage with five to ten apps daily. To break into this limited rotation, the research suggests that video ads, app store promotions, and interactive formats are the most effective. Furthermore, rewarded ads—traditionally associated with gaming—show broad appeal, with 33% of non-gaming audiences paying more attention to ads that offer in-app incentives.
The research methodology involved a large-scale survey of 30,457 respondents conducted in April and May 2022. The sample included 18,894 consumers from gaming apps and 11,563 from non-gaming apps within the ironSource network, supplemented by a 500-person third-party control group to eliminate bias. All participants were verified adults aged 18 or older. The geographic scope is global, focusing on the broader mobile app economy. Conclusions emphasize that successful user acquisition strategies must prioritize interest-based relevance, humor, and rewarded engagement to capture the attention of the modern mobile consumer.
- Mobile gaming has become a universal behavior, with 60% of non-gaming app users playing mobile games daily, matching social media as the top usage category.
- In-app advertising is a primary driver for app discovery, leading to downloads for 70% of gaming audiences and 78% of non-gaming control group users.
- While users typically maintain over 20 apps on their devices, the majority limit their daily engagement to only five to ten apps.
- Rewarded ads have broad appeal beyond gaming, with 33% of non-gaming audiences reporting they pay more attention to advertisements that offer in-app incentives.
- To successfully acquire users in a crowded market, developers should prioritize interest-based relevance, humor, and interactive ad formats.
Ad Intelligence: An Overview 2022
Analysis of mobile advertising intelligence from 2022 reveals a rapidly expanding market, with the number of advertisers doubling since 2019 to exceed 120,000. Data collected from 35 countries across the Apptica platform indicates a significant platform disparity, as Android accounts for 71% of advertisers and over 80% of the 14.6 million total creatives tracked during the period. While Android publishers outnumber those on iOS by a factor of two, the gaming sector remains the dominant force on both platforms, capturing 69.02% of advertising traffic on the App Store and 55.58% on Google Play.
The gaming landscape is primarily led by the Casual and Puzzle genres. Casual games represent the largest traffic share on iOS at 23.8%, while Puzzles lead on Android at 25.4%. Beyond gaming, the Shopping and Social categories emerge as the other primary drivers of high-volume traffic. Top individual advertisers by traffic share include Meta Platforms, Playrix, and TikTok, while NewsBreak and ITI Inc. lead in the sheer volume of unique creatives.
Methodological findings highlight distinct creative strategies between operating systems. On iOS, video is the preferred format, accounting for 59.9% of creatives. Conversely, Android relies more heavily on static images, which make up 58.8% of its ad inventory. Interactive or playable ads remain a niche but consistent segment, representing less than 3% of the total share on both platforms. The data suggests that publishers are significantly more aggressive with creative testing on Android, often running between 2 and 124 times more creative variations than they do on iOS. Playrix, Easybrain, and Tripledot Studios are identified as the most consistent market leaders, appearing in the top ten for buying share across both ecosystems.
- The mobile advertising market has doubled since 2019, with over 120,000 active advertisers identified across 35 countries in 2022.
- Android dominates the advertising landscape, accounting for 71% of advertisers and over 80% of the 14.6 million creatives tracked.
- Gaming remains the primary advertising sector, capturing 69.02% of traffic on the App Store and 55.58% on Google Play, with Casual and Puzzle genres leading their respective platforms.
- Creative strategies differ by platform: iOS favors video (59.9% of creatives), while Android relies heavily on static images (58.8% of creatives).
- Android publishers are significantly more aggressive in testing, running between 2 and 124 times more creative variations than their iOS counterparts.
State of Anime Gaming 2022
The analysis evaluates the global mobile market for games that employ an anime art style, focusing on performance metrics from 2018 through 2021. By applying data.ai’s Game IQ feature‑tag system to isolate titles with anime aesthetics across all genres, the study aggregates download and consumer‑spend data from iOS and Google Play (iOS‑only for China) and presents a comprehensive view of audience behavior, revenue trends, and regional dynamics.
Anime‑themed titles generated one‑fifth of all mobile‑game spend in 2021 while capturing only about one percent of overall usage, highlighting a highly engaged but niche user base. Worldwide downloads rose 15 % year‑over‑year in 2021 and 50 % since 2018, with South Korea leading growth (170 % increase in downloads, 85 % rise in spend), followed by the United Kingdom (30 % downloads, 75 % spend) and the United States (40 % downloads, 70 % spend). Japan remained the largest market, accounting for 55 % of anime‑game spend in 2021, though its share fell by nine percentage points from 2018. RPG, simulation and action subgenres dominate both downloads and revenue, while breakout titles such as Genshin Impact (top global spender) and Pokémon GO (top downloader in the US and UK) illustrate cross‑regional appeal.
Demographic profiling shows a strong Gen‑Z skew, with anime gamers on U.S. iPhones 217 % more likely to use Discord and 52 % more likely to use Snapchat than the average mobile gamer; similar patterns appear in Japan and other markets. Gender preferences vary by subgenre, and certain genres—particularly idol‑training simulations and open‑world RPGs—recorded double‑digit year‑over‑year revenue growth (e.g., Uma Musume Pretty Derby +117 %, Genshin Impact +233
- Anime-themed mobile games generated 20% of total global mobile game consumer spend in 2021 despite accounting for only 1% of total usage.
- Japan remains the dominant market, representing 55% of global anime-game spend in 2021, though its market share has declined by nine percentage points since 2018.
- Global downloads for anime-style games grew 50% between 2018 and 2021, with South Korea emerging as a top growth market showing a 170% increase in downloads and 85% increase in spend.
- RPG, simulation, and action subgenres drive the majority of revenue and downloads, with high-performing titles like Genshin Impact and Pokémon GO demonstrating significant cross-regional appeal.
- Specific subgenres are seeing massive revenue acceleration, led by titles like Genshin Impact (+233% year-over-year) and Uma Musume Pretty Derby (+117% year-over-year).
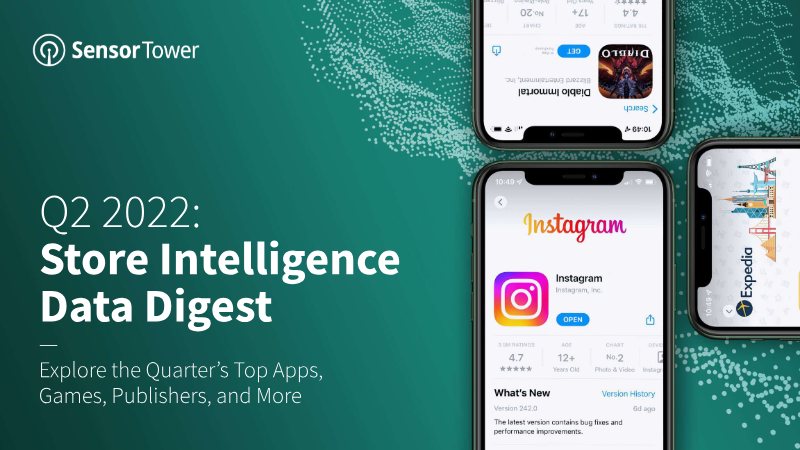
Store Intelligence Data Digest: Q2 2022
The global mobile application market experienced a pivotal transition in the second quarter of 2022, characterized by a 2.5% year-over-year decline in total downloads to 35 billion. While Google Play maintained the largest volume with 27.2 billion installs, the most significant development occurred within the United States, where consumer spending on non-gaming applications surpassed gaming revenue on the App Store for the first time. This shift was fueled by a 40% compound annual growth rate in subscriptions, with non-game subscription revenue soaring 129% above 2019 levels. This trend underscores a fundamental change in consumer behavior as 400 non-game titles generated over $1 million in quarterly revenue, signaling a maturation of the subscription economy.
The gaming landscape remained highly competitive, led by the resurgence of Subway Surfers, which achieved its best performance since 2014 with over 80 million downloads. While Garena Free Fire continued its dominance on Google Play, particularly in Asia, the quarter was defined by the successful entry of mid-core titles like Apex Legends Mobile and Diablo Immortal. Regional growth was most pronounced in Indonesia, which surpassed 2 billion quarterly downloads for the first time, while the U.S. market saw a resurgence in travel and ticketing sectors as consumers returned to pre-pandemic activities.
Publisher dynamics remained concentrated among established giants, with Meta and Google maintaining their global leadership. Meta saw an 11% year-over-year increase in downloads, driven by its ownership of four of the top five most-installed apps worldwide. The industry also witnessed significant consolidation and strategic shifts, notably Take-Two Interactive’s rise to the top of the U.S. gaming market following its acquisition of Zynga, and Miniclip’s acquisition of the Subway Surfers franchise. These movements, combined with the rising influence of domestic publishers in China and the U.S., illustrate a market balancing global scale with localized dominance.
- In a historic shift for the U.S. App Store, consumer spending on non-gaming applications surpassed gaming revenue for the first time, driven by a 129% increase in non-game subscription revenue compared to 2019 levels.
- The global mobile market saw a 2.5% year-over-year decline in total downloads to 35 billion in Q2 2022, though Google Play retained the largest share with 27.2 billion installs.
- Meta solidified its market dominance by owning four of the top five most-installed apps globally, contributing to an 11% year-over-year increase in the company's total downloads.
- Take-Two Interactive became the top U.S. gaming publisher following its acquisition of Zynga, while Miniclip expanded its portfolio by acquiring the Subway Surfers franchise.
- Subway Surfers experienced a major resurgence, recording over 80 million downloads—its strongest performance since 2014—while new mid-core titles like Apex Legends Mobile and Diablo Immortal successfully entered the market.
Japan Mobile App Trends 2022
The Japanese mobile app market experienced a period of significant expansion between 2020 and 2022, characterized by a 19% surge in total installs and a dominant 52% growth rate within the gaming sector. While the pandemic-driven peak of 2021 led to a stabilization of gaming sessions in 2022, the market remains robust across multiple verticals. Hyper-casual and RPG titles continue to lead in volume, though simulation games have emerged as highly efficient options for developers, offering lower acquisition costs and superior return on ad spend compared to puzzle games.
Beyond gaming, the fintech and e-commerce sectors have demonstrated remarkable resilience and growth. Fintech sessions increased by 13% year-over-year in the first half of 2022, while e-commerce activity reached record highs during the same period. The dating app category also saw a 13% uptick in engagement, with notable discrepancies in user acquisition costs between platforms; Android registrations proved more cost-effective at $8.47 compared to $10.20 for iOS. These trends indicate a maturing digital economy where user engagement is diversifying across utility and lifestyle applications.
A pivotal shift in the Japanese advertising landscape is the rapid rise of Connected TV (CTV), which is projected to reach 23.2% user penetration and ¥58.8 billion in ad spend by 2024. This emerging frontier is reshaping user acquisition strategies, necessitating sophisticated cross-device measurement and multi-touch attribution to link large-screen impressions to mobile conversions. As local broadcasters and analytics platforms form deeper integrations, CTV is transitioning from an experimental channel to a permanent, data-driven fixture of the Japanese mobile marketing ecosystem.
- The Japanese mobile market saw a 19% surge in total installs between 2020 and 2022, with the gaming sector experiencing a dominant 52% growth rate.
- Connected TV (CTV) is a critical emerging channel in Japan, projected to reach 23.2% user penetration and ¥58.8 billion in ad spend by 2024.
- Simulation games have become highly efficient for developers, offering lower acquisition costs and superior return on ad spend compared to traditional puzzle games.
- Fintech sessions grew by 13% year-over-year in the first half of 2022, while e-commerce activity reached record highs during the same period.
- Dating app engagement increased by 13%, with Android user acquisition costs ($8.47) proving more cost-effective than iOS ($10.20).
State of Mobile 2022 – Indonesia
Indonesia emerged as one of the world’s most mobile-centric markets in 2021, with users averaging 5.4 hours daily on mobile devices, representing a 38% increase since 2019. This engagement translates to roughly one-third of total waking hours, fueling 7.31 billion new app downloads and $532 million in consumer spending. While social, communication, and video applications captured 70% of total time spent, the gaming sector remained the primary economic driver, accounting for 42% of all downloads and 61% of total consumer expenditure. Titles such as Mobile Legends: Bang Bang and Free Fire led the market in both engagement and monetization, while Hypercasual games dominated the download charts.
Beyond entertainment, the Indonesian mobile landscape experienced transformative growth in utility and commerce sectors. Finance app downloads surged by 82% year-over-year, and time spent in shopping applications reached 5.5 billion hours, a 52% increase. The Food and Drink category saw the most explosive growth, with sessions increasing by over 480% due to the rise of quick-service restaurant brands and delivery services. Additionally, the video streaming market nearly doubled its engagement levels since 2019, driven by a shift toward mobile-first content and the continued dominance of platforms like YouTube and TikTok, the latter of which saw 75% year-over-year growth.
Niche sectors also demonstrated significant momentum as the market matured. Consumer spending on dating apps rose 188% since 2018, while Health and Fitness engagement remained 56% higher than pre-pandemic levels. Business and utility apps like BukuWarung and PLN Mobile emerged as breakout leaders, signaling a deeper integration of mobile solutions into daily professional and civic life. As travel restrictions eased in late 2021, the recovery of travel and sports applications further solidified the mobile device as the central hub for the Indonesian consumer's digital and physical interactions.
- Gaming remains the primary economic driver in Indonesia, accounting for 42% of all app downloads and 61% of total consumer expenditure, with titles like Mobile Legends: Bang Bang and Free Fire leading the market.
- Indonesian mobile users averaged 5.4 hours of daily screen time in 2021, a 38% increase since 2019, totaling 7.31 billion downloads and $532 million in consumer spending.
- The Food and Drink category experienced the most explosive growth, with session counts increasing by over 480% due to the rise of delivery services and quick-service restaurant brands.
- Finance app downloads surged by 82% year-over-year, while time spent in shopping applications reached 5.5 billion hours, reflecting a 52% increase.
- TikTok saw 75% year-over-year growth in engagement, contributing to a near-doubling of the total video streaming market since 2019.
Casual Gaming Apps Report 2022
The mobile gaming landscape entered a period of transition in early 2022, marked by the first year-over-year decline in global spending during the first quarter. Despite this contraction, mobile gaming remains the dominant force in the industry, commanding over 60% of the total market share. Analysis of performance metrics from May 2021 to May 2022 reveals an average cost per install (CPI) of $1.10 and a Day 30 return on ad spend (ROAS) of 17.81%. Lifestyle games emerged as a particularly lucrative segment, generating the highest returns for developers despite carrying higher-than-average acquisition costs.
Platform and regional disparities significantly influence user acquisition strategies. Android remains the more cost-effective platform with an average CPI of $0.75, which is less than half of the $2.27 required on iOS. Notably, both platforms maintain comparable ROAS at the Day 7 and Day 30 marks, suggesting that Android offers superior efficiency for many casual titles. Geographically, North America represents the most expensive market with a CPI of $3.32, while the LATAM and APAC regions provide the most affordable entry points. However, lower acquisition costs in LATAM are often offset by lower overall returns compared to more established markets.
To maintain long-term player investment and monetization, top-grossing casual games increasingly utilize hybrid mechanics. By blending core puzzle or rhythm gameplay with secondary layers like interior design or social competition, developers are successfully extending player lifecycles. These findings, derived from an extensive dataset of 76.1 billion impressions and 58.5 million installs, underscore a shift toward sophisticated, multi-layered game design as a primary driver for growth in an increasingly competitive and price-sensitive mobile environment.
- Mobile gaming maintains over 60% of the total industry market share despite experiencing its first year-over-year global spending decline in Q1 2022.
- Android is significantly more cost-effective for user acquisition than iOS, with an average CPI of $0.75 compared to $2.27, while both platforms deliver comparable Day 30 ROAS.
- Lifestyle games are the most lucrative segment for developers, yielding the highest returns despite carrying higher-than-average acquisition costs.
- North America is the most expensive market for user acquisition with a $3.32 CPI, whereas LATAM and APAC offer lower entry costs but typically provide lower overall returns.
- Top-grossing casual titles are increasingly utilizing hybrid mechanics—blending core gameplay with secondary layers like interior design or social competition—to extend player lifecycles.
State of Mobile: Brazil 2022
Brazil solidified its position as a global leader in mobile engagement throughout 2021, with users averaging 5.4 hours daily on their devices. This record-breaking activity drove 10.3 billion app downloads and a 22% year-over-year increase in consumer spending, which reached $1.13 billion. While social, communication, and video streaming apps captured 70% of total mobile minutes, the gaming sector emerged as the primary engine for monetization, accounting for more than half of all consumer expenditures. Hypercasual titles led in volume, while 4X Strategy games dominated revenue generation.
The market underwent a profound digital transformation across the finance and retail sectors. Finance app downloads surged by 91% over a two-year period, fueled by a large underbanked population gravitating toward neobanks like Nubank and PicPay. Similarly, shopping app engagement rose 45%, though domestic players faced increasing competition as international publishers secured a 52% share of the local market. This shift toward digital-first services extended to the "rapid delivery" and food sectors, where sessions reached 4.5 billion, and the business category, where users increasingly utilized apps to secure alternative income through gig economy platforms.
Post-pandemic recovery and lifestyle shifts further diversified the mobile landscape. Travel and sports apps saw significant rebounds in downloads and time spent, while the dating sector reached $47 million in consumer spend, marking a 62% increase since 2018. Health and fitness apps also maintained momentum with a 30% growth in downloads compared to pre-pandemic levels. Emerging trends, such as the 45% surge in TikTok usage and the rise of avatar-based social metaverses, indicate a maturing market where short-form video and interactive digital environments are becoming central to the Brazilian mobile experience.
- Brazilian mobile users averaged 5.4 hours of daily device usage in 2021, driving 10.3 billion app downloads and $1.13 billion in consumer spending.
- Gaming is the primary monetization engine in Brazil, accounting for over 50% of total consumer spend, with hypercasual titles leading in volume and 4X Strategy games dominating revenue.
- Finance app downloads surged 91% over two years, driven by a large underbanked population adopting neobanks such as Nubank and PicPay.
- Shopping app engagement grew 45%, though international publishers now control 52% of the local market share.
- The dating sector reached $47 million in consumer spend in 2021, representing a 62% increase since 2018.
Mobile App Trends 2022
The mobile app industry experienced a period of robust expansion throughout 2021, characterized by $170 billion in consumer spending and $288 billion in advertising expenditures. Despite the implementation of Apple’s App Tracking Transparency framework, the sector demonstrated unexpected resilience as global opt-in rates reached 25%, significantly outperforming initial industry forecasts. This growth was distributed across several key verticals, with fintech and gaming leading the surge in installs at 35% and 32% respectively, while e-commerce maintained steady upward momentum with a 12% increase in downloads.
Fintech emerged as a primary driver of engagement, particularly within the asset management and cryptocurrency subverticals. While traditional banking and payment apps maintained the highest share of installs, crypto apps achieved record session lengths exceeding 15 minutes. This heightened engagement occurred alongside a sharp rise in acquisition costs, with effective cost-per-install (eCPI) for fintech apps more than tripling. Consequently, developers are increasingly pivoting toward subscription-based models to ensure long-term profitability and offset the rising price of user acquisition.
The e-commerce and gaming sectors mirrored this trend of higher costs paired with increased user value. Although e-commerce retention rates saw a slight decline, total in-app revenue jumped by 46%, driven by longer session durations in marketplace apps. Similarly, the gaming industry saw hyper-casual titles dominate download volumes while adventure and strategy games secured deeper engagement. Across all sectors, the transition toward higher-quality user bases is evident; while it is becoming more expensive to acquire users, those who remain are spending more time and money within apps, making retention and lifetime value the critical metrics for sustained success in a maturing mobile market.
- The mobile industry generated $170 billion in consumer spending and $288 billion in advertising expenditures during 2021.
- Apple’s App Tracking Transparency framework saw a 25% global opt-in rate, exceeding initial industry expectations for resilience.
- Fintech and gaming led installation growth at 35% and 32% respectively, while e-commerce downloads increased by 12%.
- Fintech apps experienced a tripling of effective cost-per-install (eCPI), prompting a strategic shift toward subscription-based revenue models.
- E-commerce in-app revenue rose by 46% despite a slight decline in retention rates, driven by longer session durations in marketplace apps.
State of Mobile 2022 India
The Indian mobile ecosystem is undergoing rapid transformation, driven by a convergence of gaming, financial services, and entertainment applications. Hyper‑casual titles, primarily action‑puzzle games, have surpassed five billion downloads worldwide, while 4X march‑battle strategy games commanded the highest consumer spend in 2021, generating roughly ten billion dollars. This surge in gaming activity coincides with a 28 percent year‑over‑year increase in finance‑app usage, pushing total downloads beyond one billion and reaching 1.2 billion installations. Cryptocurrency platforms such as Binance, WazirX and CoinDCX recorded the strongest gains in sessions per user, signalling a growing appetite for digital‑asset services. Retail and video‑streaming applications also expanded markedly, with shopping apps alone accounting for 7.57 billion hours of user engagement.
The market in 2021 was dominated by a blend of global and domestic firms. Google, Meta, Reliance, the Times Group, ShareChat and Bharti Airtel led both download and spend rankings across categories. In the gaming segment, Chinese and U.S. publishers—including Tencent, Jinke Culture (Outfit7), Voodoo, ironSource and Supercell—held top positions, with popular titles such as Carrom Pool and My Talking Tom Friends driving user acquisition. This competitive landscape underscores the importance of cross‑border content while highlighting the rising influence of Indian platforms.
Overall, the data illustrate a diversified mobile market in India where high‑growth sectors—hyper‑casual gaming, strategic spend‑heavy titles, and fintech services—are reshaping user behavior and revenue streams. The coexistence of strong domestic players with leading international publishers suggests a dynamic environment poised for continued expansion throughout the coming years.
- The Indian mobile market is defined by high-growth sectors in gaming, fintech, and retail, with 4X march-battle strategy games generating approximately $10 billion in global consumer spend during 2021.
- Finance application usage in India grew by 28% year-over-year in 2021, resulting in over 1.2 billion total installations.
- Hyper-casual action-puzzle games have achieved significant scale, surpassing five billion downloads worldwide.
- Cryptocurrency platforms including Binance, WazirX, and CoinDCX experienced the strongest growth in sessions per user, reflecting a rising demand for digital-asset services.
- Retail applications saw massive user engagement, with shopping apps accounting for 7.57 billion hours of total usage in 2021.
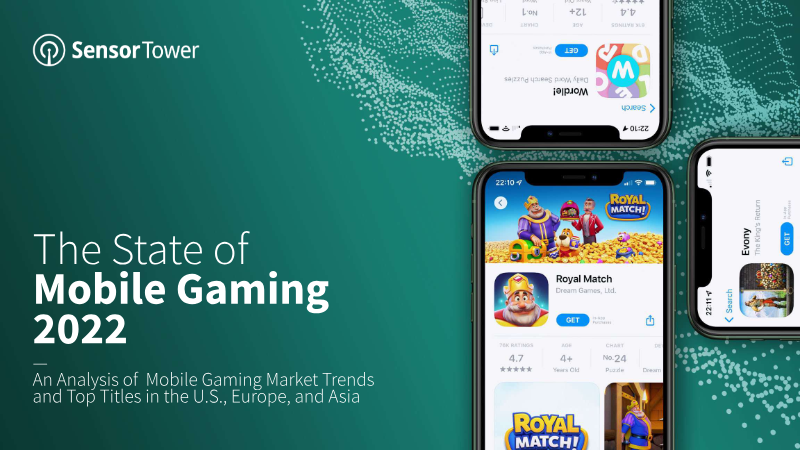
The State of Mobile Gaming 2022: Market Trends and Top Titles in the U.S., Europe, and Asia
Global mobile gaming revenue experienced its first historical year-over-year decline in the first quarter of 2022, falling 6% to $21.2 billion. This contraction follows a period of unprecedented pandemic-driven growth and is largely attributed to market stabilization and rising inflation, which contributed to a 22% spending drop on Google Play. While established markets such as the United States and Japan saw double-digit revenue decreases, global game adoption remained resilient at approximately 14 billion quarterly downloads, a figure significantly higher than pre-pandemic benchmarks.
Geographic performance diverged sharply between mature and emerging regions. The U.S. market saw consumer spending fall 10% to $5.8 billion, and the broader Asian market declined 7% to $11.2 billion. Conversely, emerging markets in Southeast Asia and the APAC region showed significant growth. India solidified its position as the global leader in volume, accounting for 15% of worldwide installs and a 73% increase in consumer spending. In Europe, Turkey emerged as a primary growth hub, recording a 36% revenue increase and becoming the region's fastest-growing market for both downloads and development.
Genre and monetization trends indicate a shift toward sophisticated engagement mechanics. While RPG and Shooter revenues fell by 13% and 14% respectively, RPG remains the highest-grossing genre globally, and Hypercasual titles continue to dominate downloads with a 32.5% market share. Real-Time Strategy emerged as the fastest-growing sub-genre by revenue. To combat declining spending, developers are increasingly adopting Season Passes, now utilized by half of the world’s top-grossing titles to revitalize legacy games. Furthermore, strong correlations have emerged between specific aesthetics and monetization strategies, particularly the synergy between Anime art styles and Gacha mechanics, as well as the integration of ad-removal subscriptions within casual titles.
- Global mobile gaming revenue declined 6% year-over-year in Q1 2022 to $21.2 billion, ending a period of pandemic-driven growth due to market stabilization and inflation.
- Consumer spending dropped 10% in the U.S. and 7% in Asia, while Google Play saw a 22% decrease in spending despite global downloads remaining resilient at 14 billion.
- Emerging markets are driving growth, led by India’s 73% increase in consumer spending and Turkey’s 36% revenue surge, which established it as Europe’s fastest-growing market.
- While RPG and Shooter genres saw revenue declines of 13% and 14% respectively, Real-Time Strategy emerged as the fastest-growing sub-genre by revenue.
- Hypercasual titles continue to dominate the market with a 32.5% share of total downloads.
IP-Based Mobile Games: 2022
The mobile gaming landscape has shifted toward intellectual property (IP) as a primary strategy for navigating user-tracking challenges like Apple’s App Tracking Transparency. By 2021, nearly all top-downloaded new iOS titles were based on existing IPs, demonstrating that established brands are essential for driving organic acquisition and attracting high-spending players. While Western franchises like Disney and Marvel lead in global download volume, Eastern IPs—particularly those rooted in Japanese manga and Chinese literature—command superior revenue through specialized monetization models like gacha. This geographic divide highlights a fundamental difference in market behavior, where Western audiences prioritize battle mechanics while Asian markets focus on deep character development and simulation.
Success in this sector requires a rigorous alignment between an IP’s core values and the chosen game genre. Titles such as Marvel Strike Force and Umamusume: Pretty Derby illustrate how faithful adherence to lore and character-driven mechanics fosters emotional attachment and long-term retention. However, leveraging a known brand introduces operational complexities, including intensive stakeholder management, extended development timelines for licensor approvals, and the necessity of localized adaptations to meet regional preferences. The primary objective for developers is to deliver a unique IP experience rather than prioritizing original game design, as any perceived misalignment with the source material can lead to immediate user churn.
The industry is currently evolving toward a transmedia model where mobile games are no longer secondary products but integral components of a franchise’s universe. This strategy involves integrating game-original content back into the broader IP narrative to sustain community engagement across multiple platforms. Ultimately, the effectiveness of an IP-based title hinges on its ability to lower user acquisition costs while maintaining a "perfect fit" between the theme and gameplay. As the market matures, the integration of cross-platform strategies will be vital for publishers seeking to maximize the lifecycle and monetization potential of global entertainment brands.
- By 2021, nearly all top-downloaded new iOS titles were based on existing intellectual property, confirming IP as the primary strategy for organic user acquisition following privacy shifts like Apple’s App Tracking Transparency.
- Western IPs (e.g., Disney, Marvel) drive higher global download volumes, while Eastern IPs (e.g., Japanese manga, Chinese literature) generate superior revenue through specialized monetization models like gacha.
- Successful IP-based games require a 'perfect fit' between core gameplay mechanics and source material lore, as seen in titles like Marvel Strike Force and Umamusume: Pretty Derby.
- Developers must prioritize faithful adherence to IP values over original game design to prevent user churn, accepting the trade-off of increased operational complexity and longer development timelines due to licensor approvals.
- The industry is shifting toward a transmedia model where mobile games serve as integral narrative components of a broader franchise rather than secondary products.