Global
Documents
Mobile Monetization Report 2025
The global mobile gaming market reached $57.1 billion between 2023 and 2025, representing a 3.4% increase driven primarily by the App Store and emerging regions such as LATAM and MENA. While established markets like China and Japan experienced revenue contractions of up to 15%, the Strategy genre surged by over 25%, bolstered by a massive 213% increase in Card Battlers. A pivotal shift in the industry is the rise of direct-to-consumer revenue, which grew by 46% among the top 100 US titles as developers increasingly adopt webshops and alternative payment systems to bypass traditional platform fees.
Monetization trends indicate a widening performance gap between platforms, with the App Store consistently outperforming Google Play in both revenue growth and average revenue per paying user. In the United States, the share of high-value players spending over $100 rose from 22% to 32%, while the App Store’s 90-day ARPPU climbed by 71%. This growth is largely attributed to rising transaction values, including the introduction of $159.99 price caps in top-tier titles. Conversely, Google Play’s growth remains dependent on a higher frequency of smaller, low-priced purchases, particularly as the RPG sector faces a 15% decline and a significant drop in Android spending.
Genre-specific performance reveals a move toward diversification and sophisticated LiveOps. The Puzzle genre grew by 15%, led by a 911% revenue explosion in Block Puzzles, while the Hybridcasual segment saw in-app purchase revenue surge by 84% through the standardization of Season Passes and failure-triggered offers. Despite a 7.5% decline in the Casino market, the Simulation genre successfully increased average purchase values by 52%. Across all segments, developers are prioritizing customizable bundles and high-value special offers to maintain engagement and offset declining purchase frequencies among long-term players.
- Top US mobile titles are increasingly bypassing platform fees, with direct-to-consumer revenue via webshops and alternative payment systems growing by 46%.
- The App Store is significantly outperforming Google Play, evidenced by a 71% increase in 90-day ARPPU and a rise in high-value US players spending over $100 from 22% to 32%.
- The Strategy genre surged over 25% globally, driven by a 213% explosion in Card Battlers, while the Puzzle genre grew 15% behind a 911% revenue spike in Block Puzzles.
- Hybridcasual games are successfully monetizing through IAPs, which surged 84% due to the standardization of Season Passes and failure-triggered offers.
- While the global mobile market grew 3.4% to $57.1 billion, established markets like China and Japan contracted by up to 15%, shifting growth focus to emerging regions like LATAM and MENA.
Reclaiming the Game Distribution Landscape
This analysis examines the shifting dynamics of the mobile game distribution market as of Summer 2025, focusing on the transition from a duopoly dominated by Apple and Google toward a more diverse ecosystem of alternative app stores. The central thesis posits that the industry is at a critical "reset" point where developers are increasingly seeking to reclaim control over their revenue, discoverability, and platform policies. By diversifying distribution strategies, game makers aim to bypass high fees and restrictive environments that have historically stifled commercial and creative potential.
The findings are based on a survey of 304 senior-level mobile game development professionals from the United States and United Kingdom, all of whom work at companies with 250 or more employees. The research was conducted in April 2025 by Atomik Research on behalf of Aptoide. The data reveals significant industry dissatisfaction: 67% of developers are concerned about over-reliance on the two major stores, 51% cite high fees as a primary pain point, and 50% believe the dominant platforms unfairly prioritize their own services.
Despite the current dominance of the major stores—which still account for roughly 87% of revenue for the majority of respondents—there is a clear trend toward adoption of alternative platforms. Approximately 74% of developers expect alternative stores to be a standard part of their distribution mix within five years. Furthermore, 73% of respondents anticipate double-digit revenue growth from these alternative channels. Key perceived benefits include access to new user bases (42.8%), greater policy freedom (42.4%), and improved discoverability through curated content and better marketing support.
The scope of the analysis covers the global mobile gaming industry with specific emphasis on the US and UK markets. It concludes that while the Apple and Google stores remain essential for reach, the rise of alternative stores and direct-to-consumer webshops offers a necessary path for growth, risk reduction, and improved profit margins in an increasingly competitive landscape.
- As of April 2025, 67% of senior mobile game developers express concern over their over-reliance on the Apple and Google app store duopoly.
- While Apple and Google currently command 87% of mobile gaming revenue, 74% of developers expect alternative app stores to become a standard part of their distribution strategy within five years.
- Developers anticipate significant financial upside from diversification, with 73% of respondents projecting double-digit revenue growth from alternative distribution channels.
- High platform fees remain a primary industry pain point for 51% of developers, while 50% believe dominant platforms unfairly prioritize their own internal services.
- The primary drivers for adopting alternative stores include access to new user bases (42.8%), greater policy freedom (42.4%), and improved discoverability through better marketing support.

Retention Radar
The global mobile ecosystem is entering a period of maturation characterized by a 2.3% decline in installs, necessitating a strategic pivot from aggressive user acquisition toward sophisticated retention models. Because a 10% improvement in retention can yield profit increases of up to 90%, the industry is increasingly prioritizing the lifetime value of existing users. This shift is supported by the identification of distinct behavioral patterns between functional apps, which command high initial stickiness, and emotional categories like gaming, which foster long-term loyalty. By analyzing these "app-hopping" behaviors, marketers can identify high-value users who move fluidly between different app categories.
Data across various gaming genres indicates that while retention naturally declines over time, Return on Ad Spend often grows significantly as players deepen their investment in narrative and premium features. For instance, simulation games frequently see a threefold increase in ROAS by the thirtieth day of engagement. Furthermore, significant cross-genre affinities exist, such as RPG players demonstrating a 40.2% engagement rate with non-gaming applications. These insights suggest that targeting "synthesized cohorts"—clusters of interconnected apps based on shared user habits—is more effective than traditional siloed marketing.
To maximize engagement through 2025, the industry must adopt advanced technological frameworks, including deep neural networks and supervised AI, to facilitate surgical ad precision. Utilizing a "Stickiness Index" allows for the quantification of engagement patterns, enabling the deployment of dynamic product ads and automated event-based retargeting. By leveraging real-time post-install data and deep linking, advertisers can create frictionless, hyper-personalized journeys that capture users during high-intent moments. This methodology transforms brief digital interactions into sustained loyalty, ensuring that advertising spend is optimized across both gaming and non-gaming verticals globally.
- A 10% improvement in user retention can drive profit increases of up to 90%, making retention a more critical financial lever than aggressive user acquisition in a market seeing a 2.3% decline in installs.
- Simulation games demonstrate the value of long-term engagement by achieving a threefold increase in Return on Ad Spend (ROAS) by the thirtieth day of player activity.
- Targeting 'synthesized cohorts'—clusters of interconnected apps based on shared user habits—is more effective than siloed marketing, especially given that RPG players show a 40.2% engagement rate with non-gaming applications.
- The industry is shifting toward advanced technological frameworks, including deep neural networks and supervised AI, to facilitate surgical ad precision and real-time, event-based retargeting.
- Quantifying engagement through a 'Stickiness Index' allows advertisers to deploy dynamic product ads and deep linking to create frictionless, hyper-personalized user journeys through 2025.
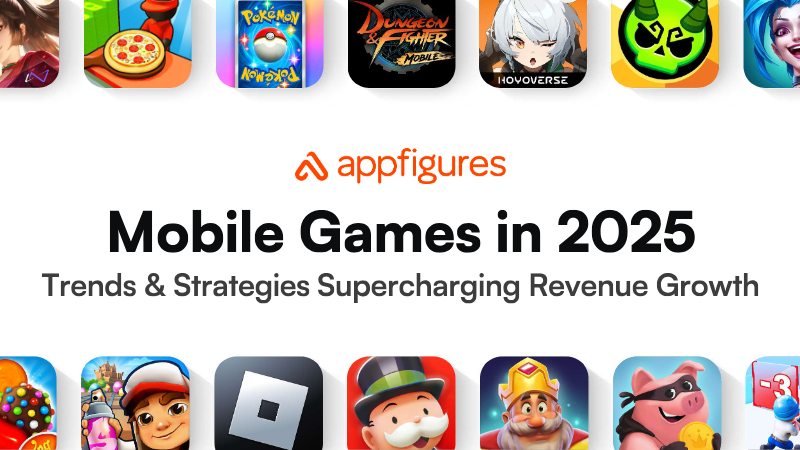
Mobile Games in 2025: Trends & Strategies Supercharging Revenue Growth
The global mobile gaming market entered a phase of intensified monetization and efficiency in 2024, characterized by a 3.8% increase in consumer spending to $65.7 billion despite a 6.6% decline in total downloads. This shift indicates a maturing landscape where revenue is driven by an 11.2% rise in spending per download rather than sheer user acquisition volume. Although the number of new game releases plummeted by over 43%, the highest-quality titles are achieving financial success at an accelerated pace, reaching the $1 million revenue milestone nearly twice as fast as they did in 2022. Geographically, the United States maintains its position as the primary revenue engine with $20.8 billion in spending, while India continues to dominate global download volume.
Mid-core titles, particularly Role-Playing Games, represent the most significant segment of the market, accounting for half of the top 1,000 earning games. While established giants like Tencent and Scopely maintain their dominance, new entries from China and Japan are capturing substantial global market share. Growth is also accelerating in emerging markets, with Brazil and Mexico both experiencing a 47% surge in spending. To maintain engagement and drive revenue spikes, developers are increasingly relying on high-impact intellectual property crossovers and collaborations, such as integrating popular media franchises into existing gameplay loops.
Monetization strategies have become highly standardized among top-performing titles, with 100% of the top 500 earning games utilizing consumables and limited-time offers. In-game advertising serves as a vital secondary revenue stream, with Unity Ads emerging as the most adopted platform among developers. Looking toward 2025, the industry is expected to be defined by the continued dominance of mid-core genres, the strategic expansion of IP-based events, and the rising economic influence of Latin American markets. Success in this environment requires a focus on high-value user retention and sophisticated monetization frameworks to offset the broader decline in new release volume.
- The mobile gaming market is shifting toward higher monetization efficiency, evidenced by a 3.8% increase in consumer spending to $65.7 billion despite a 6.6% decline in total downloads.
- Spending per download rose by 11.2% in 2024, as the industry prioritizes high-value user retention over the volume-based acquisition strategies of previous years.
- New game releases dropped by over 43%, yet top-tier titles are reaching the $1 million revenue milestone nearly twice as fast as they did in 2022.
- Mid-core titles, specifically Role-Playing Games, dominate the financial landscape, accounting for 50% of the top 1,000 earning games.
- Emerging markets are becoming critical growth engines, with Brazil and Mexico recording a 47% surge in consumer spending.
2025 State of Mobile Gaming: In-App Purchase Trends of Leading Apps
The 2025 State of Mobile Gaming report analyzes the transition of the mobile gaming industry into a new growth phase characterized by refined monetization and sophisticated user acquisition. Based on an anonymized dataset of 100 leading global gaming advertisers and Sensor Tower estimates spanning 24 months, the analysis tracks the evolution of In-App Purchase (IAP) trends across 2.3 billion projected players.
The findings indicate that while global install volume remained flat in 2024, IAP revenue grew by 4%. This growth is driven by a 6% increase in install-to-payer conversion rates and improved long-term monetization, with Day 90 Average Revenue Per Paying User (ARPPU) rising by 6%. A significant shift in platform dominance has occurred, with iOS now generating 55% of global IAP revenue. High-value users represent a critical concentration of wealth; specifically, the top 5% of payers generate 48% of total revenue. In the United States, a mere 0.02% of global installs—representing high-spending iOS users—account for 20% of total global gaming revenue.
Market dynamics show fierce competition for these spenders, with the top 1% of iOS winning bid prices increasing by 140% year-over-year. To counter rising costs in mature markets like the U.S. and Tier 1 regions, leading advertisers are diversifying into the Rest of World (ROW) and emerging markets, where iOS revenue grew by 19% and 31% respectively.
Successful strategies among the top five advertisers include a heavy reliance on Return on Ad Spend (ROAS) optimization, a 5x higher investment in interactive playable creatives, and a 3x greater focus on re-engagement campaigns compared to the broader industry. The report concludes that the industry is moving toward a hybrid model where casual gameplay mechanics are blended with deep IAP structures to maximize lifetime value across a global audience.
- Global IAP revenue grew by 4% in 2024 despite flat install volume, driven by a 6% increase in both install-to-payer conversion rates and Day 90 ARPPU.
- The top 5% of players generate 48% of total revenue, with a hyper-niche segment of U.S. iOS users (0.02% of global installs) accounting for 20% of all global gaming revenue.
- Competition for high-value spenders has intensified, causing bid prices for the top 1% of iOS users to surge by 140% year-over-year.
- iOS now dominates the market, generating 55% of global IAP revenue, while emerging markets and the Rest of World (ROW) saw iOS revenue growth of 31% and 19% respectively.
- Top-performing advertisers are countering rising acquisition costs by investing 5x more in interactive playable creatives and 3x more in re-engagement campaigns than the industry average.

How to Prepare Your Live Ops for the Holiday Season
A well‑designed Live Ops strategy is essential for capitalising on the heightened player activity that occurs during the holiday period. Analysis of hundreds of mobile games worldwide demonstrates that a coherent Live Ops framework can produce a substantial uplift in sessions, revenue and player retention throughout the season. The core argument is that developers should treat the holidays as a series of tightly integrated, short‑term experiences that reinforce the game’s everyday loop while delivering clear, time‑bound incentives.
Short‑term events that run for one to three days are most effective for generating quick spikes in engagement. These events focus on immediate objectives—such as a burst of sessions, a specific resource collection, or a limited‑time reward—while employing a “soft‑sawtooth” difficulty curve that eases players in, ramps up challenge, offers a brief respite, and then escalates again. By keeping the event mechanics a natural extension of the main gameplay loop, developers avoid disrupting player expectations and maintain momentum.
For the broader holiday window, the most successful structures combine a single, clearly defined Battle‑Pass progression path with social‑cooperation events that reward group performance through prestige items like avatars, badges and leaderboard positions. Layering weekly quests, long‑term collection albums, and brief “bonus amplifier” events creates cumulative engagement loops. Linking these components through shared currencies and diversified motivations systematically drives both retention and monetisation, particularly for mature titles that benefit from community‑driven competition.
Overall, the guidance applies to the global mobile gaming sector during the Q4 holiday season and emphasizes that incremental, interconnected events—anchored by transparent progression and social incentives—are the key levers for maximising holiday‑season performance.
- Implement a series of short-term, 1-to-3-day events to generate immediate spikes in player engagement and session frequency.
- Structure holiday content as a 'soft-sawtooth' difficulty curve that alternates between periods of challenge and respite to maintain player momentum.
- Integrate holiday events directly into the core gameplay loop to ensure they feel like natural extensions of the existing experience rather than disruptive additions.
- Combine a single, clear Battle-Pass progression path with social-cooperation events to drive both retention and monetization through group-based prestige rewards.
- Layer weekly quests, long-term collection albums, and brief 'bonus amplifier' events to create cumulative engagement loops.
The Importance of Wishlists in 2025
Executive Summary – “The Importance of Wishlists” (VGI Report, 2025)
1. What the Data Shows | Metric | Key Figure | Insight | |--------|------------|---------| | Games surpassing 100 k wishlists at launch | ~9 % (141/1 500) | Only a small minority achieve the “break‑out” threshold. | | Correlation (wishlists ↔ Month‑1 sales) | r ≈ 0.70 (RSQ ≈ 0.49) | Strong overall link, but it spikes to r ≈ 0.71 for games with > 100 k wishlists. | | Top‑heavy distribution | 1–2 % of titles > 1 M wishlists; > 90 % < 10 k | Success is heavily skewed toward a few blockbuster titles. | | Genre performance | Action/Adventure & RPG/Strategy → highest medians (≈ 180‑190 k) | Casual & MMO titles lag (median ≈ 70‑80 k) and rely more on post‑launch tactics. | | Wishlist momentum | Games that hit 100 k+ before launch have a 71 % chance of strong month‑1 sales vs. 17 % for < 100 k. | Momentum is a “crystal ball” for launch success. | | Steam page creation timing | 40 % of top performers publish 0.5‑1 yr before launch; 35 % publish > 1 yr early. | Early page creation gives sustained visibility and higher wishlist growth. | | Pre‑launch wishlist accumulation | 85 % of wishlists are collected ≥ 4 months before launch. | The bulk of audience commitment happens well before the final countdown. |
2. Why Wishlists Matter
1. Predictive Power – Once a title crosses the 100 k‑wishlist threshold, its first‑month sales become far more predictable (≈ 71 % correlation). 2. Marketing Leverage – High wishlist counts signal strong community interest, making it easier to secure press coverage, influencer partnerships, and paid‑media spend. 3. Resource Allocation – Studios can prioritize titles with early wishlist momentum for larger launch budgets and store‑front promotion. 4. Risk Management – Low‑wishlist titles (≤ 10 k) have a 50 % chance of under‑performing, suggesting a need for contingency plans (e.g., extended beta, community events).
3. How Games Accumulate Wishlists
| Tactic | Effectiveness (based on VGI data) | |--------|-----------------------------------| | Early Steam page (≥ 6 months pre‑launch) | +30 % average wishlist growth vs. late‑launch pages | | Regular content drops (trailers, dev logs, screenshots) | Each major trailer ≈ 10‑15 % spike in wishlist count (case: Kingdom Come Deliverance 2 added ~0.2 M per trailer) | | Early Access / Demo releases | Boosts momentum for “core” genres; median increase ≈ 12 % | | Community engagement (Discord, Reddit AMAs) | Stronger post‑launch
- Crossing the 100,000 wishlist threshold is the primary indicator of success, as these titles have a 71% probability of strong first-month sales compared to only 17% for those with fewer than 100,000.
- Wishlist accumulation is highly top-heavy, with only 9% of games reaching the 100,000-wishlist milestone and over 90% of all titles failing to exceed 10,000.
- 85% of total pre-launch wishlists are collected at least four months before a game's release, emphasizing that audience commitment must be secured well in advance of launch.
- Publishing a Steam page at least six months prior to launch increases wishlist growth by an average of 30% compared to pages created closer to the release date.
- Major content drops, such as trailers, consistently drive significant engagement, with each release triggering a 10–15% spike in wishlist counts.
PC & Console Year in Review 2025
Alinea Analytics provides a comprehensive review of the PC and console gaming market for 2025, offering data-driven insights into player behavior, revenue trends, and regional growth. The analysis highlights a year defined by the continued rise of indie and "Triple-I" titles, which accounted for over 25% of Steam’s revenue. Major success stories like RimWorld’s Odyssey DLC, which earned $10 million to date, and the rapid development of viral hits like RV There Yet? underscore a market where high return on investment is increasingly decoupled from massive studio sizes.
Geographically, the report identifies China as a dominant force, ranking as the top market for Steam and the fifth for PlayStation. This surge is attributed to the momentum of titles like Black Myth: Wukong, with Chinese players making up a significant percentage of the audience for games such as Escape from Duckov and Monster Hunter Wilds. In Europe, the Swedish development scene saw a massive year, capturing significant market share through titles like R.E.P.O. and Split Fiction.
Technical and genre trends show Unreal Engine maintaining its position as the industry standard for AA and AAA development, while Unity remains the backbone for indie successes. Co-op games emerged as a primary revenue driver, representing 11 of the top 20 highest-grossing titles. While adventure and RPGs remain popular, "cute" and "realistic" tags saw the highest year-over-year revenue growth. The data also notes a shift in marketing dynamics: while wishlist campaigns are now standard—requiring nearly 200,000 wishlists to break the top 200 most-anticipated list—conversion rates have declined, placing greater emphasis on post-launch player reception and "shadow drops" for viral success.
- Indie and 'Triple-I' titles have become a major market force, accounting for over 25% of total Steam revenue in 2025.
- Co-op games are a primary revenue driver, representing 11 of the top 20 highest-grossing titles of the year.
- China has emerged as a dominant global market, ranking as the top region for Steam and the fifth for PlayStation, largely driven by the success of titles like Black Myth: Wukong.
- Marketing dynamics have shifted as wishlist conversion rates decline, with developers now requiring nearly 200,000 wishlists to break into the top 200 most-anticipated games list.
- Unreal Engine remains the industry standard for AA and AAA development, while Unity continues to serve as the primary engine for indie market successes.

UGC Impact Study 2025
The 2025 UGC Impact Study, conducted by GameDiscoverCo and commissioned by mod.io, analyzes the commercial and engagement benefits of integrating official user-generated content (UGC) support into video games. The research demonstrates that games offering official modding tools or content-sharing solutions consistently outperform those without such features across PC, console, and VR platforms. By examining a dataset of approximately 1,200 Steam games that generated at least $1 million in their first month, the study finds that titles with UGC support see an 8% revenue advantage after one year, which expands to 31% after five years.
The primary driver for this long-term financial success is significantly higher player retention. On PC, games with UGC support maintain 75% higher concurrent user counts after two years and 115% higher after five years compared to games without these features. Furthermore, the research refutes concerns regarding the cannibalization of official content; games with UGC support actually see 105% higher median revenue per DLC. Case studies, such as Baldur’s Gate 3 and SnowRunner, support these findings, with the latter noting that players using mods were 2.4 times more likely to purchase official DLC.
The scope of the study extends beyond PC to include PlayStation, Xbox, and Meta Quest platforms. On consoles, the impact is even more pronounced in the short term, with UGC-supported titles showing a 16% performance boost on PlayStation and a 24% boost on Xbox after one year. In the VR sector, titles with UGC support experienced 30% more median growth over the past year than those without. The methodology evolved from previous years to include not just Steam Workshop, but also middleware solutions like mod.io and proprietary studio tools, suggesting that the positive correlation between UGC and commercial longevity is a robust, industry-wide trend.
- Games with official UGC support see a 31% revenue advantage over non-UGC titles after five years, growing from an 8% advantage in the first year.
- UGC support drives long-term player retention, resulting in 75% higher concurrent user counts after two years and 115% higher after five years on PC.
- Official UGC does not cannibalize sales; games with modding support see 105% higher median revenue per DLC, with SnowRunner players using mods being 2.4 times more likely to purchase official DLC.
- Console platforms show significant short-term gains from UGC integration, with a 16% performance boost on PlayStation and a 24% boost on Xbox after one year.
- VR titles integrating UGC support experienced 30% more median growth over the past year compared to those without such features.
PC/Console Gaming Index: A Look at the Top Games, Publishers, and Platforms in 2025 So Far
The 2025 PC and console landscape is dominated by Steam, which recorded 450 million downloads and is projected to achieve a record $12 billion in premium revenue, reflecting a 15 percent year‑to‑date increase. PlayStation and Xbox follow with 376 million and 283 million downloads respectively, underscoring Steam’s clear lead in both user acquisition and monetisation. Across the combined market, action titles command the highest demand at 262 million downloads, while shooters and role‑playing games attract 189 million and 131 million downloads, indicating a strong preference for high‑intensity, narrative‑driven experiences among gamers.
Premium revenue accounts for the majority of earnings on the leading platforms, with Steam generating 79 percent of its income from premium sales and PlayStation reaching 83 percent, highlighting the continued viability of upfront purchase models despite the growth of free‑to‑play alternatives. The data suggest that while free‑to‑play titles remain a significant segment, the premium‑heavy ecosystem retains a decisive advantage in revenue generation.
Overall, the findings illustrate a globally integrated market in 2025 where PC distribution via Steam outpaces console rivals, genre preferences skew toward action‑oriented titles, and premium monetisation continues to dominate the financial structure of the industry.
- Steam leads the 2025 PC and console market with 450 million downloads and a projected $12 billion in premium revenue, representing a 15 percent year-to-date increase.
- Premium purchase models remain the primary revenue driver, accounting for 79 percent of Steam's income and 83 percent of PlayStation's earnings.
- Steam outperforms console competitors in user acquisition, recording 450 million downloads compared to 376 million for PlayStation and 283 million for Xbox.
- Action titles are the most popular genre in 2025, generating 262 million downloads across the combined market.
- Shooters and role-playing games follow action titles in popularity, attracting 189 million and 131 million downloads respectively.
The Intrinsic In-Game Advertising Key Trends Report H1 2025
Intrinsic in-game advertising (IIGA) has transitioned into a measurable, high-impact media channel that allows brands to reach premium gaming environments through buying approaches similar to traditional digital and broadcast media. The primary thesis of this analysis is that gaming offers a unique, year-round engagement opportunity that remains consistent even when traditional channels like television and social media experience seasonal dips. By integrating non-disruptive, native ads into gameplay, advertisers can achieve significant full-funnel impact, including a 20-point lift in ad recall and a 21% lower cost per acquisition (CPA) compared to standard goals.
The findings are based on aggregated internal data from 105 games and 333 direct advertisers, supplemented by third-party research from partners such as IAS, Lumen, and Comscore. The scope is global, with specific insights covering North America, Europe, LATAM, and APAC throughout the 2024 calendar year. While mobile currently offers 25 times the scale of impressions and greater audience diversity, PC and console platforms provide superior immersion, with significantly longer session lengths and higher total playtime per user.
Key data points highlight that IIGA outperforms traditional digital formats in attention, delivering 2,957 attentive seconds per thousand impressions—nearly triple the performance of Facebook Infeed. Regional trends indicate that while North America and Europe command the highest CPMs, emerging markets like APAC and LATAM offer cost-effective growth opportunities. Furthermore, genre-specific data reveals that sports and racing titles see engagement peaks tied to real-world competitions, while simulation games offer a steady, female-skewing audience. The report concludes that advertisers should move beyond seasonal buying habits to capitalize on gaming’s "always-on" nature, particularly during Q1 when CPMs are lower but engagement remains high.
- Intrinsic in-game advertising (IIGA) delivers 2,957 attentive seconds per thousand impressions, nearly triple the performance of Facebook Infeed.
- Adopting IIGA drives a 20-point lift in ad recall and a 21% lower cost per acquisition (CPA) compared to standard digital benchmarks.
- Mobile platforms provide 25 times the scale of impressions and greater audience diversity, while PC and console platforms offer superior immersion through longer session lengths.
- Advertisers can optimize budgets by shifting to an 'always-on' strategy, specifically targeting Q1 when CPMs are lower but engagement remains consistent.
- Sports and racing titles show engagement peaks aligned with real-world events, whereas simulation games provide a consistent, female-skewing audience.

The State of Games QA
This analysis explores the current state and future trajectory of quality assurance (QA) within the video game industry, specifically focusing on the integration of artificial intelligence and automation. The central thesis posits that modern game development—characterized by the complexity of games-as-a-service and accelerated release cycles—has outpaced traditional manual QA capabilities. Consequently, there is a critical need for AI-driven solutions to bridge the gap between increasing content volume and stagnant testing budgets.
The findings are based on a September 2024 survey of 303 US-based game development professionals across various disciplines, including QA, production, and design, supplemented by interviews with industry experts from companies such as Netflix and Indium Play. Data indicates a significant strain on current resources: 77% of developers admit to conducting less QA than necessary for their most recent releases, and 50% believe budgets are failing to keep pace with game complexity. While 94% of studios use some form of non-AI automation, there is a near-unanimous consensus (94%) that AI will be essential for the future of the field.
Key statistics highlight a strong industry appetite for AI adoption, with 88% of respondents viewing AI as equal to or better than traditional methods for bug detection. Developers identify faster bug detection, automated reporting, and 24/7 testing as the primary advantages of the technology. However, a significant implementation gap exists; while 87% of studios feel "somewhat ready" for AI, only 18% feel fully prepared. Primary barriers to adoption include setup complexity, high initial costs, and a lack of skilled staff. The analysis concludes that while AI is vital for scalability and stress testing, it serves as a complement to—rather than a replacement for—human intuition and creative exploratory testing.
- 77% of game developers report conducting insufficient QA for their recent releases, highlighting a critical gap between traditional manual testing and the demands of modern, complex game development.
- While 94% of studios currently utilize non-AI automation, there is a near-unanimous consensus (94%) that AI integration is essential for the future of quality assurance.
- 88% of industry professionals believe AI-driven testing is equal to or superior to traditional methods, specifically citing faster bug detection, automated reporting, and 24/7 testing as key advantages.
- Despite high interest, only 18% of studios feel fully prepared to implement AI, with setup complexity, high initial costs, and a lack of skilled staff serving as the primary barriers to adoption.
- Half of all surveyed developers report that current QA budgets are failing to keep pace with the increasing complexity of games-as-a-service models and accelerated release cycles.