Advertising

110 documents·36 publishers

Documents

Page 1
Report43 pages

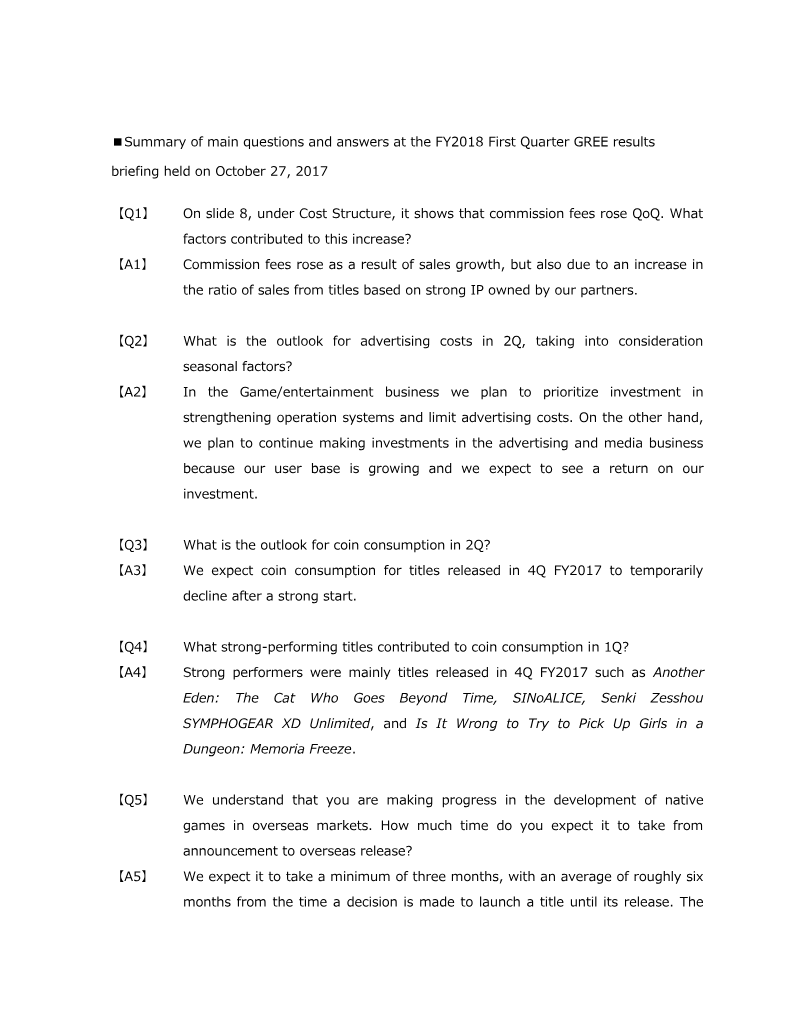
2Q FY2025 Financial Presentation Material

2Q FY2025 Presentation Material We corrected past annual securities reports and others due to the discovery of an inappropriate accounting treatment at the consolidated subsidiary. Please refer to the “Notice on Submission of Correction Reports of Past Annual Securities Reports and Amendments of Financial Statements for Past Fiscal Years” released on May 15, 2025, for details.

  • The company achieved record-high sales of 217.3 billion yen in FY2025 Q2, up 1.2% YoY, with operating profit increasing by 0.7% YoY to 20.8 billion yen, primarily driven by Media & IP and Ad businesses.
  • An inappropriate accounting treatment at a consolidated subsidiary led to corrections of past annual securities reports and amendments of financial statements, with details released on May 15, 2025.
  • The Media & IP business saw significant growth, with sales up 14.4% YoY to 57.0 billion yen and operating profit increasing 6.5x YoY to 3.3 billion yen, through building a multi-layered revenue stream and investing in anime production.
  • The Ad business maintained a high sales increase rate, up 9.9% YoY to 117.5 billion yen, and operating profit increased by 8.7% YoY to 6.0 billion yen, with an operating profit margin of 5.1%.
  • Sales and profit in the game console game sector declined 23.4% YoY to 51.4 billion yen and 15.7% YoY to 15.3 billion yen respectively, despite a significant QoQ increase (34.6% in sales, 4.6x in OP) due to a game release in February 2024.
+2
CyberAgent
Page 1
Report37 pages

1Q FY2025 Presentation Material

The presentation outlines CyberAgent’s FY 2025 financial outlook, operational highlights, and strategic priorities across its Media & IP, Internet Advertising, and Game divisions. FY 2025 revenue is projected at ¥820 billion with operating profit of ¥42 billion, representing 24.9 % and 19.8 % of the year‑to‑date targets, respectively. First‑quarter results show a 5.6 % YoY sales increase to ¥203.8 billion and a 32.1 % rise in operating profit to ¥8.3 billion, driven largely by a 10.5 % lift in Media & IP sales (¥55.6 billion) and an 11.8 % growth in Internet Advertising sales (¥117.7 billion). The Game segment, however, posted a 15.1 % YoY decline to ¥38.2 billion and a 4.1 % drop in operating profit, attributed to slower releases despite strong performance of new titles.

Operating margins improved from 3.3 % in FY 2024 to 4.1 % in FY 2025, supported by a 32 % increase in operating income. SG&A expenses rose 4.4 % YoY to ¥45.7 billion, while cash deposits increased 11.3 % YoY to ¥205.6 billion, reflecting liquidity strengthening.

Strategically, the company is shifting from a Media‑only model to an integrated Media & IP business, aiming to generate global IPs through ABEMA and new production units such as CA Soa Inc. The medium‑to‑long‑term plan emphasizes investment in high‑profit IP content, game development, and advertising technology leveraging AI to enhance ad effectiveness. The presentation also lists a pipeline of over six new games for FY 2025, including international releases, and outlines organizational changes to support the expanded IP focus.

  • CyberAgent reported a 5.6% YoY revenue increase to ¥203.8 billion and a 32.1% rise in operating profit to ¥8.3 billion for 1Q FY2025.
  • The Game segment underperformed, recording a 15.1% YoY revenue decline to ¥38.2 billion and a 4.1% drop in operating profit due to a slower release cadence.
  • Growth was primarily driven by the Media & IP segment, which saw a 10.5% sales increase to ¥55.6 billion, and the Internet Advertising segment, which grew 11.8% to ¥117.7 billion.
  • The company is pivoting to an integrated Media & IP strategy, utilizing ABEMA and new production units like CA Soa Inc. to develop global intellectual property.
  • CyberAgent plans to bolster its gaming portfolio with a pipeline of over six new titles in FY2025, including several international releases.
+1
CyberAgent
Page 1
Report1 pages

Quarterly Transition by Business Segment: Japan

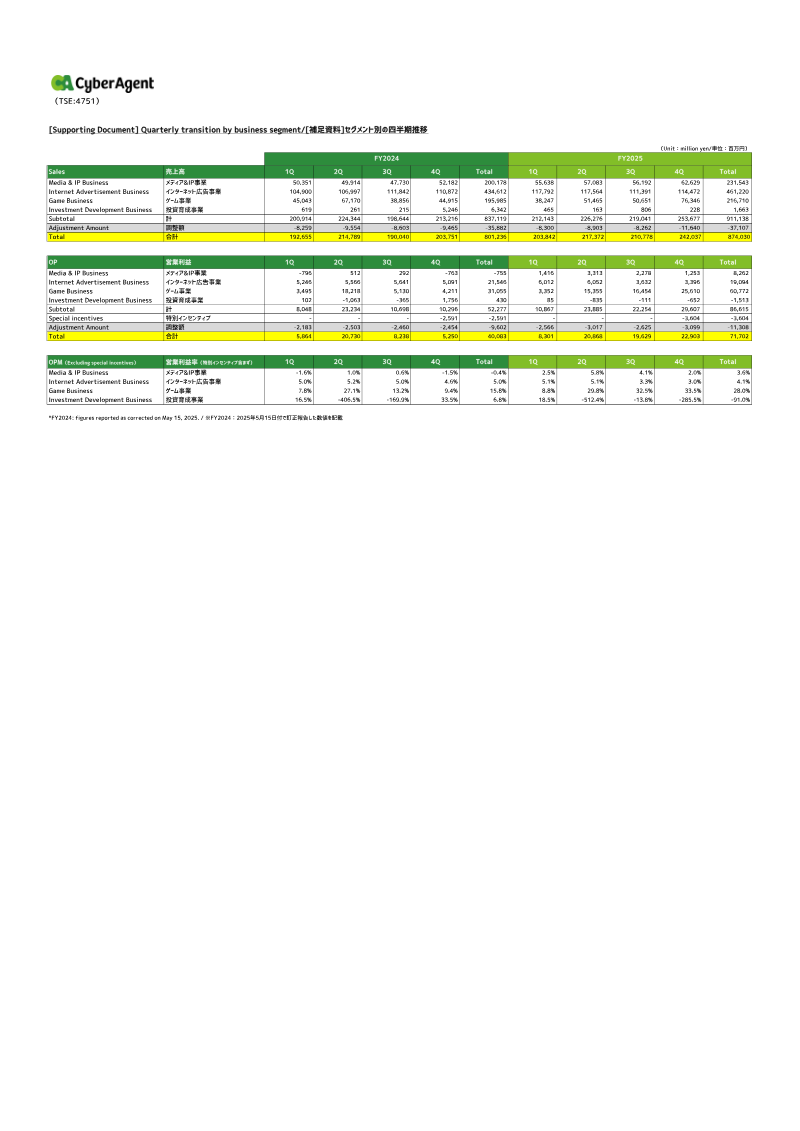
The quarterly transition analysis for Japan’s business segments presents detailed financial performance for FY2024 and FY2025, focusing on Media & IP, Internet Advertisement, Game, and Investment Development divisions. Sales figures reveal that the Internet Advertisement Business consistently leads with a FY2024 total of ¥434,612 million and a FY2025 total of ¥461,220 million. The Game Business shows the most volatility, peaking in Q2 FY2024 at ¥67,170 million before declining to ¥38,856 million in Q3. Media & IP sales remain relatively stable around ¥50–52 billion per quarter, while Investment Development remains a minor contributor with totals under ¥7 billion.

Operating profit (OP) highlights divergent profitability across segments. The Game Business delivers the highest OP, reaching ¥31,055 million in Q1 FY2024 and sustaining strong quarterly results thereafter. Internet Advertisement maintains steady OP around ¥5–6 billion each quarter, whereas Media & IP oscillates between losses and modest gains, culminating in a FY2024 total OP of ¥8,262 million. Investment Development experiences significant swings, with a notable loss in Q2 FY2024 but a recovery to ¥1,756 million in Q4.

Operating profit margins (OPM) excluding special incentives illustrate segment efficiency. Game Business achieves the highest margin, peaking at 33.5% in Q3 FY2024 and maintaining a FY2025 average of 28%. Internet Advertisement sustains margins around 5%, while Media & IP remains near break‑even, fluctuating between –1.6% and 5.8%. Investment Development shows extreme volatility, with a negative margin of –406.5% in Q2 FY2024 and a positive 33.5% in Q4, resulting in an overall FY2024 margin of 3.6%.

The data cover the Japanese market over two fiscal years, with quarterly granularity and corrections applied as of May 15 2025. The analysis relies on internal financial statements, presenting a comprehensive view of segment performance and profitability trends.

  • The Game Business is the company's most profitable segment, maintaining a FY2025 average operating profit margin of 28% and peaking at 33.5% in Q3 FY2024.
  • Internet Advertisement is the largest revenue generator, growing from ¥434,612 million in FY2024 to ¥461,220 million in FY2025, though it operates on thin margins of approximately 5%.
  • Game Business revenue is highly volatile, experiencing a sharp decline from a peak of ¥67,170 million in Q2 FY2024 to ¥38,856 million in Q3 FY2024.
  • Media & IP remains a stable but low-margin segment, with quarterly sales consistently between ¥50 billion and ¥52 billion and operating profit margins fluctuating between –1.6% and 5.8%.
  • Investment Development is a minor contributor with annual revenue under ¥7 billion and extreme performance volatility, ranging from a –406.5% margin in Q2 FY2024 to a 33.5% margin in Q4 FY2024.
+1
CyberAgent
Page 1
Report2 pages

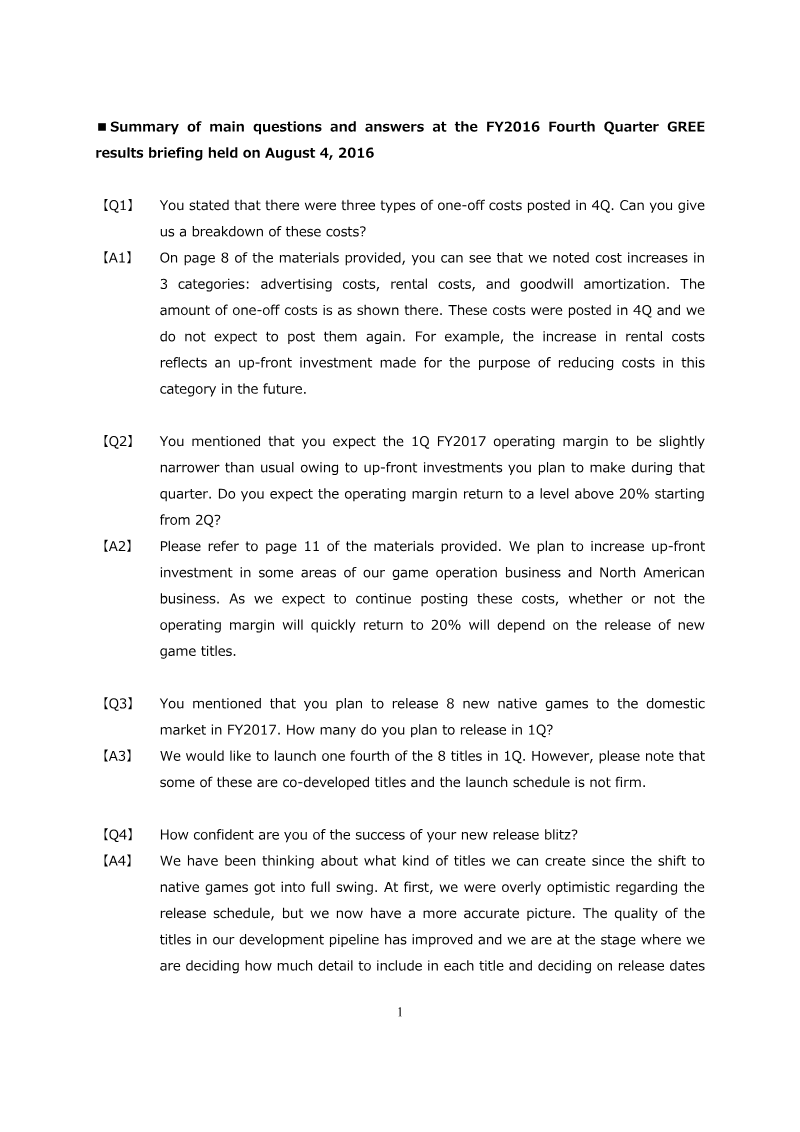
Summary of Q&A: FY2016 4Q GREE Results Briefing

The briefing clarified GREE’s financial and strategic outlook for FY2016–FY2017. One‑off costs in Q4 were broken into advertising, rental and goodwill amortization, with rental increases reflecting upfront investments aimed at future cost reductions. These expenses are not expected to recur. Operating margin for Q1 FY2017 is projected to be slightly below normal due to continued upfront spending, particularly in game operations and North America; a return above 20% is contingent on new title releases. GREE plans to launch eight native games in FY2017, with a quarter‑backed schedule of one‑quarter releases for roughly two titles, though co‑development timelines remain fluid. Confidence in the release blitz has improved as development pipelines mature and release dates are refined based on competitive market conditions.

Strategically, each studio is positioned to leverage core strengths: Wright Flyer focuses on action RPGs and IP integration, while Pokelabo targets GvG titles built on card‑battle expertise. Hit titles are defined by top‑ten App Store rankings in the games category. Financially, GREE aims to use its strengthened capital base to sustain long‑term game development and pursue selective M&A or IP acquisitions, exemplified by the 4Q acquisition of ad‑media firm ADFULLY. The scope covers domestic Japanese markets, with implications for North American expansion, and the time frame spans FY2016 Q4 through FY2017. The briefing relied on internal financial statements and strategic planning documents to outline cost structures, margin expectations, product pipelines, studio focus areas, success metrics, and capital deployment strategies.

  • GREE plans to launch eight native games in FY2017, targeting a release cadence of two titles per quarter.
  • Operating margins for Q1 FY2017 are expected to remain below 20% due to upfront investments in game operations and North American expansion, with a return to higher margins contingent on new title performance.
  • The company defines 'hit titles' as games that achieve top-ten rankings within the App Store games category.
  • One-off costs incurred in Q4 FY2016—including advertising, rental, and goodwill amortization—are non-recurring expenses intended to facilitate future cost reductions.
  • Studio strategies are specialized: Wright Flyer is focused on action RPGs and IP integration, while Pokelabo is focused on GvG titles leveraging card-battle expertise.
+1
GREE
Page 1
Report3 pages

Summary of Main Questions and Answers at the FY2018 First Quarter GREE Results Briefing

The briefing, held on October 27 2017, focused on GREE’s first‑quarter FY2018 performance and future strategy. Commission fees rose quarter‑on‑quarter, driven by overall sales growth and a higher proportion of revenue from partner titles with strong intellectual property. Advertising spend outlook for the second quarter varies by segment: the game and entertainment arm will tighten costs while continuing to invest in advertising for its expanding user base, expecting a return on investment. Coin consumption is projected to dip temporarily after the strong start of Q4 FY2017 releases, yet titles such as Another Eden: The Cat Who Goes Beyond Time, SINoALICE, Senki Zesshou SYMPHOGEAR XD Unlimited, and Is It Wrong to Try to Pick Up Girls in a Dungeon: Memoria Freeze drove robust coin usage in Q1.

GREE’s overseas native‑game development pipeline is expected to take a minimum of three months from announcement to launch, averaging six months. The company emphasizes delivering versions faithful to the original Japanese product and local operation for success in China, noting that Chinese users prefer authenticity and require localized fine‑tuning with strong local partners. In the VR arena, GREE is expanding its development knowledge base and partnering to provide access points for users lacking personal VR hardware, anticipating market growth.

Regarding the domestic native‑game environment, GREE acknowledges rising user expectations and a challenging acquisition landscape. Leveraging its financial strength and industry relationships, the company plans large‑scale development and mixed‑media initiatives to deliver hit titles. Sales of native games are expected to experience a temporary decline before operations are strengthened—through larger support teams, content enhancement, overseas launches, and tailored promotional activities—to drive subsequent growth.

  • GREE’s Q1 FY2018 revenue growth was driven by increased commission fees from partner titles that leverage strong intellectual property.
  • Key titles driving robust coin consumption in Q1 included 'Another Eden: The Cat Who Goes Beyond Time', 'SINoALICE', 'Senki Zesshou SYMPHOGEAR XD Unlimited', and 'Is It Wrong to Try to Pick Up Girls in a Dungeon: Memoria Freeze'.
  • The company expects a temporary decline in native game sales as it transitions to larger support teams, enhanced content, and more aggressive promotional activities to drive future growth.
  • GREE’s overseas native-game development pipeline requires a minimum of three months from announcement to launch, with an average lead time of six months.
  • Success in the Chinese market is predicated on delivering versions faithful to original Japanese products while utilizing strong local partners for necessary fine-tuning.
+3
GREE
Page 1
Report2 pages

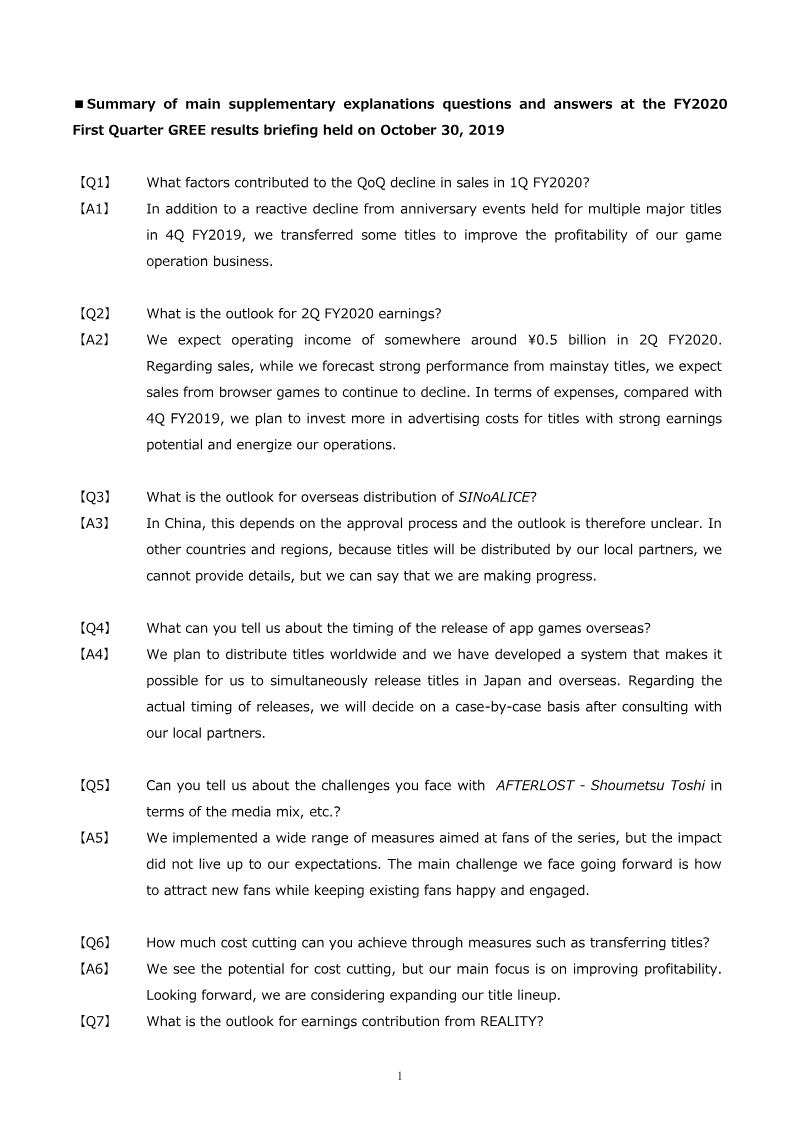
Summary of main supplementary explanations questions and answers at the FY2020 First Quarter GREE results briefing held on October 30, 2019

The briefing addressed key financial and operational questions for GREE’s first quarter of FY2020. A decline in sales was attributed to a reactive drop following anniversary events for major titles in the previous quarter and strategic title transfers aimed at improving profitability. Management projected operating income of roughly ¥0.5 billion for the second quarter, with strong expectations for core titles but a continued decline in browser game revenue; advertising spend was to increase on high‑potential games. Overseas distribution of SINoALICE remains uncertain in China due to regulatory approval, while other regions rely on local partners and progress is ongoing. Global release strategy now allows simultaneous launches in Japan and abroad, with timing set on a case‑by‑case basis after partner consultation. Challenges for AFTERLOST – Shoumetsu Toshi include attracting new fans while retaining existing ones, despite extensive fan‑targeted measures. Cost‑cutting through title transfers is viewed as a means to improve profitability, with plans to broaden the title lineup. Earnings contribution from REALITY depends on internal factors such as lifetime value enhancement and external 5G infrastructure development; the focus is on steady content portfolio expansion and platform functionality rather than rapid growth before full infrastructure deployment.

  • GREE projects an operating income of approximately ¥0.5 billion for the second quarter of FY2020.
  • First-quarter sales declined due to the conclusion of major title anniversary events and the strategic transfer of titles to improve overall profitability.
  • Management expects browser game revenue to continue its decline while increasing advertising spend on high-potential mobile titles.
  • The global release strategy has shifted to allow for simultaneous launches in Japan and international markets, contingent on partner consultation.
  • The release of SINoALICE in China remains stalled due to pending regulatory approval, while other international markets rely on local distribution partners.
+3
GREE
Page 1
Report10 pages

Winning on Google Discover: A Data-Driven Guide for Gaming Media

The brief explains how Google’s February 5, 2026 “Discover core update” expands the personalized content feed and shifts traffic from traditional search to Discover, especially for gaming media. Across 197 active gaming sites in the Raptive network, roughly half of Google traffic originates from Discover, with a 20 % rise in sites receiving feed impressions after the update. The report identifies three key performance drivers that correlate with both Discover visibility and overall revenue: high U.S. traffic concentration, deep session depth, and structured editorial content such as guides and reference databases. Sites that meet these criteria see stronger Discover performance, while those dominated by forum‑style or low‑differentiation content face greater volatility.

Methodologically, the analysis draws on internal Raptive data from 6,000+ sites and external sources like Chartbeat and Google Search Console. It highlights early post‑update signals: Discover traffic is growing for smaller publishers, click volatility remains high due to real‑time recommendation algorithms, and AI summaries now occupy about half of feed impressions. The brief recommends five high‑impact actions—optimizing Core Web Vitals, crafting Discover‑specific headlines, adding author voice, aligning publishing calendars with gaming events, and correcting meta tags—to boost Discover clicks.

The document concludes by outlining Raptive’s support services, including a forthcoming Discover Workbook and personalized audits that have historically yielded an 89 % RPM uplift for gaming publishers. The brief positions Discover as a critical, data‑driven channel for gaming media amid declining search traffic and AI‑generated content.

  • Google Discover now accounts for roughly 50% of Google traffic for gaming sites within the Raptive network, following a February 5, 2026 core update that shifted traffic away from traditional search.
  • Sites that prioritize high U.S. traffic concentration, deep session depth, and structured editorial content like guides and databases experience superior Discover performance and revenue stability.
  • Following the February 2026 update, 20% more gaming sites began receiving Discover feed impressions, with smaller publishers seeing notable traffic growth.
  • AI-generated summaries currently occupy approximately 50% of all Discover feed impressions, contributing to high click volatility for publishers.
  • Publishers relying on forum-style or low-differentiation content face increased traffic volatility compared to those producing structured, expert-led editorial content.
+2
RaptiveMar 2026
Page 1
Report88 pages

Gaming and Esports in Vietnam: A New Arena for Brands

Vietnam’s gaming and esports landscape has evolved into a high‑growth, culturally resonant channel for brands targeting the country’s youthful, tech‑savvy population. With one‑third of the populace engaged in esports and an adult gamer rate of 85 %—the highest globally—the market is driven by widespread smartphone penetration, robust 4G coverage, and a demographic where roughly 70 % are under 25. Mobile titles dominate, particularly MOBAs and FPS games, while PC gaming remains significant; casual players account for nearly half of the audience.

Consumer behavior shows intense engagement: gamers spend 1–3 hours per session, seek entertainment (85.9 %), stress relief (74.7 %), and social interaction (46.5 %). Streaming platforms such as YouTube Gaming and Facebook Gaming lead, with Twitch lagging behind. Brands that sponsor mobile esports events or partner with key opinion leaders (KOLs) can tap into this high‑interaction environment, especially as 51 % of gamers trust KOL recommendations and 42 % purchase endorsed products.

Investment trends confirm the sector’s appeal. Global esports spend reached $844 million in 2021, with 9.9 % allocated to Vietnam. In‑game advertising that offers prizes (49 %) and video content (40 %) yields the strongest purchase intent, particularly for electronics, tech, and gaming accessories. Best practices emphasize customized creative assets, reward‑based incentives, and authentic collaborations—examples include Adidas “Time In” with Ninja, Dashing’s team sponsorship, and Mastercard’s League of Legends partnership—demonstrating higher recall than traditional sports ads.

Practical engagement strategies recommend experiential pop‑ups, in‑game placements, and co‑creation with publishers (e.g., Louis Vuitton’s LVxLOL) to deliver authentic touchpoints. Cause‑based campaigns resonate with Gen Z’s social consciousness, while treating esports as a “co‑business” encourages integrated, audience‑centric messaging. Overall, Vietnam’s rapidly expanding mobile and PC gaming ecosystem offers brands a fertile arena for digital fluidity, agile research, influencer partnerships, and localized media strategies to capture high‑growth engagement.
  • Vietnam has the world's highest adult gamer rate at 85%, with a demographic where 70% of the population is under 25 and one-third of citizens are engaged in esports.
  • Mobile gaming dominates the market, supported by high smartphone penetration and 4G coverage, with gamers typically spending 1–3 hours per session.
  • Influencer marketing is highly effective, as 51% of gamers trust key opinion leader (KOL) recommendations and 42% report purchasing products endorsed by them.
  • In-game advertising featuring prizes (49%) and video content (40%) generates the strongest purchase intent, particularly for electronics, tech, and gaming accessories.
  • Vietnam captured 9.9% of the $844 million global esports spend in 2021, signaling significant market appeal for international investment.
+3
Decision LabFeb 2026
Page 1
Report32 pages

Festive Season 2025: App Marketing Trends and Strategies for India

India’s festive season—from Onam in August through Diwali and Christmas in December—drives more than 30 % of the country’s annual digital advertising spend, making it a pivotal period for app marketers. In 2024, mobile games alone attracted over 3.2 billion downloads and generated $151 million in‑app purchase revenue, while non‑gaming verticals such as shopping, food delivery and OTT experienced sharp install spikes during key festivals. The data reveal a 53 % rise in mobile ad spend from Q1‑Q2 to Q3‑Q4, with installs up 36 % and re‑engagements soaring 69 % during the peak festive window, underscoring the season’s high‑value user acquisition and monetisation potential.

User‑acquisition efficiency improved markedly, with CPI falling by approximately 12 % while CPA remained stable. Video and playable ads delivered the highest ROAS—up to 4.2× in fintech and 3.8× in e‑commerce—and programmatic/OEM placements on Xiaomi and Samsung yielded significant conversion lifts, particularly in Tier‑2 and Tier‑3 cities. Creatives that refreshed weekly, incorporated localized language, and employed urgency cues such as countdowns outperformed static ads, highlighting the need for agile, culturally relevant creative and a diversified media mix that extends beyond Meta and Google into programmatic and OEM channels.

Marketers are increasingly leveraging data‑driven platforms—Singular, MobuppsX, Sensor Tower, Pathmatics and others—to optimise acquisition, retention and media spend. By integrating MAFO, iRTB, advanced fraud prevention and audience‑retention analytics, brands can reduce wasted spend, improve advertising ROI and accelerate growth across web, social and mobile channels. A unified data‑house approach enables faster campaign optimisation, measurable engagement gains and stronger competitive positioning during India’s lucrative festive period.

  • India's festive season (August–December) accounts for over 30% of annual digital ad spend, driving a 36% increase in installs and a 69% surge in re-engagements during the peak window.
  • Mobile gaming remains a primary growth driver, recording 3.2 billion downloads and $151 million in-app purchase revenue in 2024.
  • Ad spend efficiency improved during the festive period, with a 53% increase in mobile ad investment accompanied by a 12% reduction in cost-per-install (CPI).
  • Video and playable ads are the most effective formats, delivering up to 4.2× ROAS in fintech and 3.8× in e-commerce.
  • Programmatic and OEM placements on devices like Xiaomi and Samsung are essential for capturing growth in Tier-2 and Tier-3 cities.
+3
InvestGameJan 2026
Page 1
Report36 pages

Winning with Creative: Building, Testing, and Scaling High-Performance Ads

The purpose of the analysis is to demonstrate that creative content remains the decisive lever for growth in an advertising environment increasingly fragmented by privacy constraints and platform diversity. By measuring “Return on Creative” through volume, variety, and versioning, marketers can isolate incremental value per asset and scale profitable campaigns across platforms.

High‑performance ads are defined by rapid, data‑driven testing and creative diversification. In e‑commerce and lifestyle categories, first‑person point‑of‑view walkthroughs that showcase everyday use outperform generic user‑generated content, with a 350 % lift in ad spend when winning templates are paired with top assets. TikTok’s “TikTok‑first” structure—hook, body, close—shows that 30‑second videos with sound on can raise purchase intent by up to 77 %. AI tools such as TikTok Symphony deliver a 57 % efficiency gain in content creation, underscoring the necessity of automated, localized creative testing for scaling.

The three‑stage CRAFTSMAN+ framework provides a systematic approach to creative optimization. Stage 2 refines concepts by testing talent, video duration, and demographic fit to identify the most engaging format. Stage 3 fine‑tunes assets—including intro hooks, audio, CTA copy, and visual elements—to lock in the winning creative, benchmark performance, and scale campaigns. Narrative structure (education‑focused versus social proof) and localized storytelling drive higher conversion rates and return on ad spend, while structured fatigue monitoring (CTR decay, spend decline) enables proactive creative refreshes.

Geographically the findings apply to major digital markets worldwide, with a focus on platforms such as TikTok and broader social media ecosystems. The time period covers the most recent advertising cycles, reflecting current privacy regulations and platform algorithm changes. Overall, the analysis concludes that dynamic, interactive creative—tested rapidly and scaled strategically—offers the highest growth potential for brands navigating today’s complex advertising landscape.

  • High-performance ads achieve a 350% lift in ad spend when winning templates are paired with top-performing assets.
  • TikTok-first video structures—comprising a hook, body, and close—can increase purchase intent by up to 77% when using 30-second, sound-on formats.
  • AI-driven content creation tools, such as TikTok Symphony, provide a 57% efficiency gain in the production process.
  • First-person point-of-view walkthroughs demonstrating everyday product use consistently outperform generic user-generated content.
  • The CRAFTSMAN+ framework optimizes performance by systematically testing variables like talent, video duration, and demographic fit before fine-tuning specific elements like hooks and CTAs.
+3
MolocoJan 2026
Page 1
Whitepaper90 pages

2026 Global Mobile Apps Marketing Trends

The 2026 mobile marketing landscape is defined by a fundamental transition from media-centric targeting to creative-driven acquisition, necessitated by tightening privacy constraints and the saturation of traditional advertising channels. Competitive advantage now hinges on the speed of creative iteration and the ability to unify product development, monetization, and distribution. By leveraging early behavioral signals to predict long-term value, industry leaders are successfully aligning short-term performance metrics with sustainable user lifecycle growth. This evolution is supported by a strategic shift toward AI-powered personalization and behavior-driven gamification, as non-gaming applications increasingly adopt the engagement tactics traditionally reserved for the mobile gaming sector.

Data from 2025 reveals a period of significant market consolidation, marked by a 16.7% decline in active advertisers alongside a 73.3% surge in creative output per advertiser. Playable ads have emerged as the premier format, consistently yielding the highest attention duration, scroll-stop rates, and conversion metrics. While the AI app sector experienced a sharp 48% contraction in the number of advertisers, top-tier players have responded by aggressively scaling localized marketing efforts. Simultaneously, the finance and health sectors have maintained greater stability, focusing on service-centric, medical-grade solutions and persuasive, value-based messaging to capture mature markets in North America and Europe.

Global strategies for 2026 prioritize a balanced media mix, typically favoring video content, while emphasizing hyper-local operations in emerging regions like Southeast Asia and the Middle East. Success in these diverse markets requires intensive user education and culturally nuanced, scenario-based ad updates. As the industry moves toward subscription-based models and on-device AI integration, the focus has shifted from mere technological development to the large-scale monetization of AI-enhanced user experiences. Ultimately, the market is moving toward a future of highly segmented, interactive, and performance-driven advertising that prioritizes technical precision and regulatory compliance to foster long-term user trust.

  • The mobile marketing landscape has shifted from media-centric targeting to creative-driven acquisition, evidenced by a 73.3% surge in creative output per advertiser alongside a 16.7% decline in the total number of active advertisers.
  • Playable ads are currently the top-performing format, consistently delivering the highest conversion metrics, scroll-stop rates, and attention duration.
  • The AI application sector underwent a significant contraction in 2025, with the number of active advertisers dropping by 48%.
  • Industry leaders are prioritizing the use of early behavioral signals to predict long-term user value, effectively bridging the gap between short-term performance metrics and sustainable lifecycle growth.
  • Non-gaming applications are increasingly adopting engagement tactics from the mobile gaming sector, specifically utilizing AI-powered personalization and behavior-driven gamification.
+4
SocialPetaJan 2026
Page 1
Report31 pages

State of Digital Advertising India 2026

The analysis presents a comprehensive overview of India’s digital‑advertising landscape, emphasizing its rapid expansion and the shifting strategic focus of advertisers. In 2025 the market surpassed the $4 billion threshold and is projected to exceed $5 billion in 2026, reflecting robust demand across multiple verticals. Shopping emerged as the dominant category, accounting for 28 % of total spend and delivering an 18 % year‑on‑year increase, while software recorded the strongest growth rate at 84 % YoY. Food‑and‑dining services and automotive sectors also posted notable gains of 38 % and 4 % respectively, underscoring a diversified expansion beyond traditional e‑commerce.

The competitive environment is concentrated among a handful of large advertisers, with Flipkart, Amazon and Reliance leading in impression share. A clear strategic shift is evident toward performance‑driven, audience‑specific creative, as brands increasingly deploy tailored messaging to capture high‑yield, short‑duration placements. This trend intensifies during the festive half‑year, when domestic players in generative‑AI services, food‑delivery, and film promotion amplify spend on segment‑focused creatives to maximize visibility.

Overall, the findings illustrate that India’s digital‑advertising ecosystem is entering a phase of accelerated growth, driven by both expanding spend in core categories and a pronounced move toward data‑centric, personalized creative execution. The outlook suggests continued market deepening, with advertisers likely to prioritize precision targeting and seasonal intensity to sustain momentum through 2026.

  • India’s digital advertising market surpassed $4 billion in 2025 and is projected to exceed $5 billion in 2026.
  • Shopping remains the dominant advertising category, representing 28% of total spend with an 18% year-on-year increase.
  • Software recorded the highest growth rate among all sectors, surging 84% year-on-year.
  • Flipkart, Amazon, and Reliance currently hold the largest share of advertising impressions in the market.
  • Food-and-dining services and the automotive sector posted notable growth of 38% and 4% respectively.
+1
Sensor TowerJan 2026

Publishers

Related Topics