Advertising
Documents
Mobile Ad Creative Index 2020
The 2020 mobile advertising landscape is defined by a stark divergence in performance metrics across creative formats, operating systems, and geographic regions. While banner ads remain the most cost-effective entry point for driving initial installs, native and video formats demonstrate superior efficacy in securing high-value, deep-funnel actions such as in-app purchases. Native ads, in particular, achieve conversion rates as high as 52.8%, signaling their importance for long-term user retention. However, these performance gains come at a premium on iOS, where costs consistently dwarf those on Android. For instance, the cost of securing an in-app purchase through native ads on iOS reaches $218.09, nearly triple the $73.62 required on Android.
Geographically, North America persists as the most expensive market for user acquisition across all formats, while the LATAM and APAC regions offer significantly more accessible pricing for advertisers. Seasonal trends also influence these costs, with install expenses typically peaking during the summer months. To navigate these fluctuations, successful campaigns increasingly rely on iterative A/B testing and dynamic creative strategies. Case studies from major brands like Credit Karma and Groupon illustrate that disciplined testing can yield lifts in click-to-install rates exceeding 120%, underscoring the necessity of a data-driven approach to creative optimization.
The industry is shifting toward a performance-based, cost-per-action model that prioritizes post-install revenue events over simple downloads. By leveraging machine learning and focusing on single-deal creative strategies, advertisers can better align their spending with actual user value. Ultimately, the data suggests that while the cost of acquisition is rising, particularly on premium platforms and in mature markets, the integration of dynamic product ads and rigorous testing frameworks remains the most effective path toward achieving sustainable return on ad spend.
- Native ads achieve conversion rates as high as 52.8%, making them the most effective format for driving long-term user retention and high-value in-app purchases.
- Acquiring an in-app purchase via native ads on iOS costs $218.09, which is nearly triple the $73.62 cost required on Android.
- Disciplined A/B testing and dynamic creative strategies, as utilized by brands like Credit Karma and Groupon, can increase click-to-install rates by more than 120%.
- The mobile advertising industry is shifting from simple download-based metrics to a performance-based model that prioritizes post-install revenue events.
- North America remains the most expensive market for user acquisition, while LATAM and APAC provide more cost-accessible alternatives for advertisers.
MTG Corporate Responsibility Report 2009
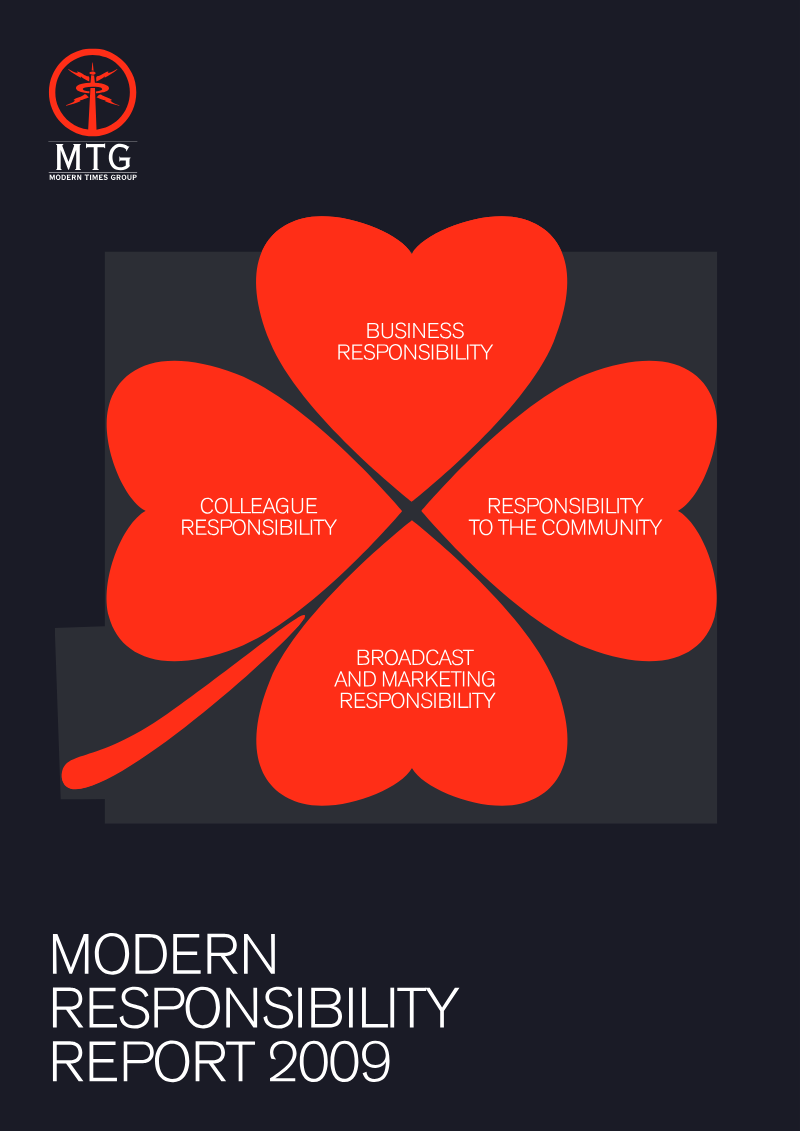
The 2009 Modern Responsibility Report presents Modern Times Group’s (MTG) effort to embed corporate responsibility across its broadcasting and media operations while navigating the aftermath of the 2008‑09 financial crisis. The report’s thesis is that a structured, multi‑pillar responsibility programme can coexist with commercial growth, even as the group expands its channel portfolio and geographic reach.
In 2009 MTG recorded net sales of SEK 14.2 billion and launched three new channels—TV3 Puls, Prima COOL and Viasat Hockey—while completing a major restructuring of its Bulgarian assets. Despite revenue growth, operating income fell to a loss of SEK 1.4 billion and basic earnings per share turned negative at ‑30.86 SEK. The responsibility framework, introduced in 2004, is now governed by the CEO, board directors, a central committee and local “Green Ambassadors,” with KPIs, internal audits and external consultancy guiding progress. Targets for 2010 include broader KPI coverage, reduced carbon emissions and enhanced stakeholder communication across business, broadcast‑marketing, colleague and community dimensions.
Employee engagement proved strong: 86 % of the 2,906 staff across 38 national markets completed the annual survey, 88 % expressed enthusiasm for their work and 90 % embraced the company’s three lead words. Gender balance approached parity overall (52 % male, 48 % female) though managerial levels remained skewed (63 % male, 37 % female). Internal recruitment accounted for 40 % of hires.
The carbon footprint for 2009 amounted to roughly 13 000 t CO₂e across 19 countries, split evenly between facilities and office‑supply material use, with an intensity of 4.2 t CO₂e per employee (0.9 t per MSEK turnover). ISO 14001 certification for the Swedish radio division and energy‑efficient headquarters illustrate concrete mitigation steps. Partnerships with WWF and Sweden’s BLICC, together with expanded carbon‑footprint audits, underscore MTG’s commitment to environmental stewardship within the
- MTG reported 2009 net sales of SEK 14.2 billion, though operating income resulted in a loss of SEK 1.4 billion and earnings per share fell to -30.86 SEK.
- The company expanded its portfolio during the 2008-09 financial crisis by launching TV3 Puls, Prima COOL, and Viasat Hockey, alongside a major restructuring of Bulgarian assets.
- Employee engagement remained high, with 86% of the 2,906-person workforce participating in the annual survey and 88% reporting enthusiasm for their work.
- Gender parity across the total workforce was nearly achieved at 52% male and 48% female, though management roles remained male-dominated at 63%.
- The company's 2009 carbon footprint totaled approximately 13,000 t CO2e, representing an intensity of 4.2 t CO2e per employee or 0.9 t per MSEK of turnover.