Skip to main content
Game Industry
Library
Library
Search
Ask AI
News
Connect your AI
Browse
The Catch Up
Topics
Collections
Writers
Help
Subscribe
Game Industry
Library
Library
Search
Ask AI
Saved
Library
161 reports matching your filters
All Types
Reports
Articles
Presentations
Whitepapers
Financial
Legal
Other
Search
Player Behavior
Market Analysis
Global
Monetization
PC
Mobile
Player Demographics
Steam
Game Design
Marketing
Retention
Game Development
Console
Europe
Streaming
North America
USA
Game Publishing
Clear
Filters
1
Player Behavior
Recently added
Newest first
Oldest first
Title A–Z
Title Z–A
Report
20 pages
Stream Hatchet Q2 2024 Report
Live streaming viewership reached 8.5 billion hours in Q2 2024, representing a 10% year-over-year increase.
Twitch's market share of hours watched declined from 70% in Q2 2023 to 60% in Q2 2024.
YouTube Gaming grew to a 23% market share, while the platform Kick captured 5.5% of the total viewership.
Streaming
Market Analysis
Player Behavior
+1
Stream Hatchet
Jun 2024
Report
9 pages
How Gamers Discover What to Play
Gamers utilize an average of four to five distinct information sources before purchasing a new title, reflecting a shift away from single-channel marketing reliance.
YouTube is the primary discovery platform for 52% of gamers and is ranked as the most trusted source of information.
Purchasing decisions are driven by risk mitigation, with 40% of players prioritizing established franchises and 25% favoring games from respected developers.
Marketing
Player Behavior
Player Demographics
+1
Big Games Machine
May 2024
Report
53 pages
Mobile App Trends 2024: Japan Edition
The Japanese mobile market generated $17.9 billion in consumer spending in 2023, with Q1 2024 showing a 3.5% increase in spending and a 3% rise in downloads.
Mobile gaming remains the primary revenue driver, with RPGs capturing nearly 50% of consumer spend and simulation games achieving session lengths exceeding 40 minutes.
Finance apps experienced a 53.5% surge in spending in early 2024, while e-commerce apps reached a first-month lifetime value of $9.67, nearly double the global median.
Market Analysis
Player Behavior
Mobile
+1
Sensor Tower
Mar 2024
Report
21 pages
2023 Roblox Report: Behind the Data
Retention is a universal challenge on Roblox, with Day 1 retention averaging 12% to 15% and falling to approximately 1% by Day 90.
Monetization is highly concentrated, as only 4.2% of players spend Robux, with over half of those spenders contributing less than $1 annually.
Top-tier games in the 95th percentile generate approximately $77 per playing player annually, significantly outperforming the broader platform average.
Player Behavior
Monetization
Global
+1
GameAnalytics
Mar 2024
Report
33 pages
Mistplay Mobile Gaming Spender Report 2024: Decoding Mobile IAP Spenders
Economic pressure is causing 32% of all spenders and 41% of high-value spenders to plan for reduced in-game expenditures in 2024.
The first month of play is critical for monetization, as 79% of spenders make their initial purchase during this period.
Loyalty programs are essential for retention, with 79% of spenders engaging with rewards and 60% of high-value players reporting increased spending likelihood when redeemable rewards are offered.
Monetization
Player Behavior
Market Analysis
+1
Mistplay
Mar 2024
Report
2 pages
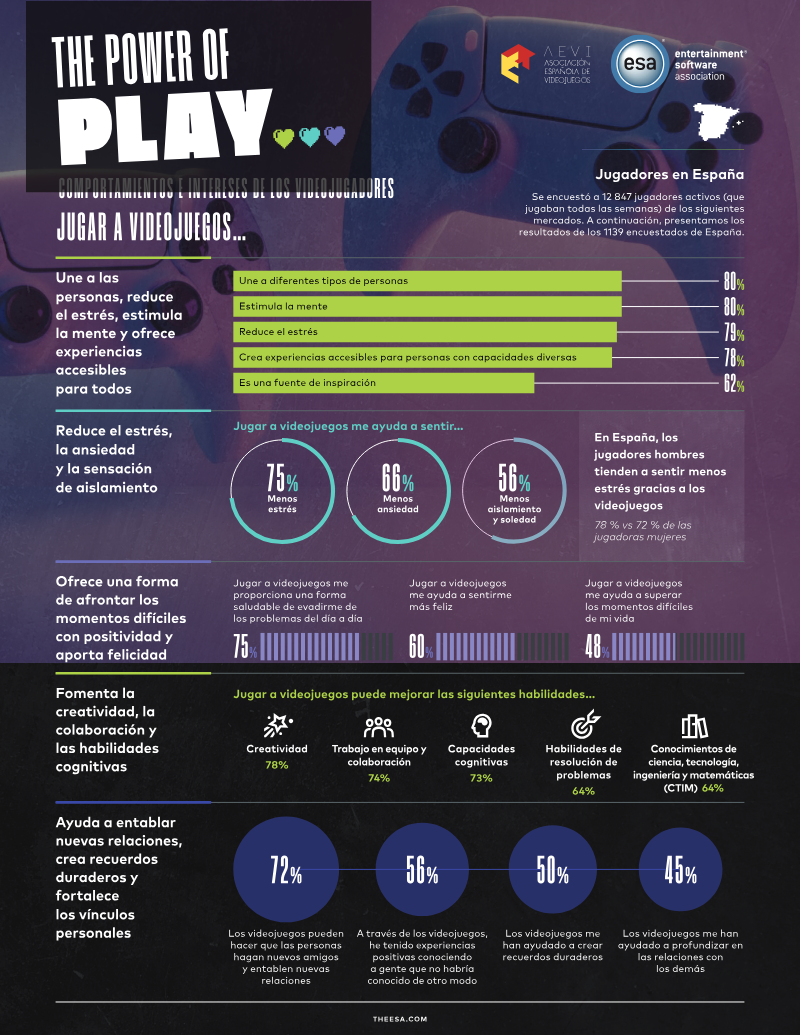
Comportamientos e Intereses de los Videojugadores: Spain
80% of Spanish gamers play primarily to meet new people and stimulate their minds, while 78% use gaming as a tool to reduce stress and anxiety.
Multiplayer gaming is perceived as a driver for skill development, with 78% of players associating it with creativity, 74% with teamwork, and 64% with improved cognitive and STEM-related abilities.
Social gaming is a core habit, as 55% of all participants view playing with others as a positive experience that fosters lasting friendships and shared memories.
Player Behavior
Player Demographics
Market Analysis
AEVI
Jan 2024
Report
5 pages
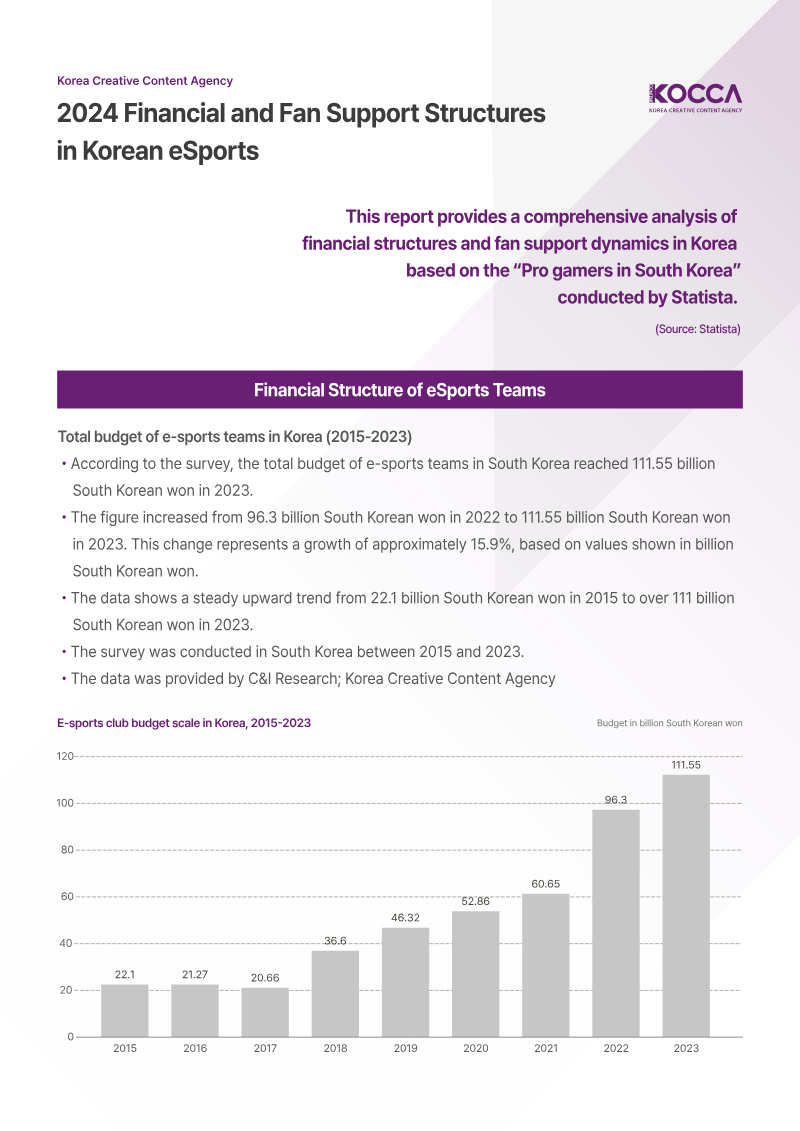
2024 Financial and Fan Support Structures in Korean eSports
Korean e-sports team expenditures grew nearly five-fold between 2015 and 2023, rising from 22.1 billion won to 111.6 billion won.
Market investment is accelerating, with total team spending increasing by 15.9% between 2022 and 2023 alone.
Fan loyalty is highly concentrated, as T1 commands 78.2% of identified team supporters, while the runner-up Gen.G holds only 5.4%.
Market Analysis
South Korea
Player Behavior
+1
KOCCA – Korea Creative Content Agency
Jan 2024
Report
111 pages
Annual Universe of Positive Gaming Experiences 2024
Stillfront Group reported a net loss of 7,378 MSEK for fiscal year 2024, largely driven by a 6.9 billion SEK goodwill impairment in its North American segment.
Total net revenues reached 6,737 MSEK, reflecting a 2% organic revenue decline that prompted a major geographic reorganization into Europe, North America, and MENA & APAC.
Despite the net loss, the company generated over 1 billion SEK in free cash flow and improved gross margins to 80% through direct-to-consumer initiatives.
Market Analysis
Player Behavior
Global
+1
Stillfront
Jan 2024
Report
12 pages
Inside Gaming: It's Personal! 2024
46% of gamers now prioritize creation and imagination as their primary motivation for playing, representing a 10% year-over-year increase.
Games that facilitate self-expression through customization, open worlds, and constant updates—such as Roblox, Fortnite, and The Sims—achieve 60% higher engagement than industry norms.
72% of consumers report they would view brands more favorably if those companies helped them translate their gaming-inspired self-expression into real-world products, skills, or lifestyle alignments.
Market Analysis
Player Behavior
Marketing
+1
Fandom
Jan 2024
Report
32 pages
Gaming Report 2024: Meet the Moment – How Gamers Are Changing the Game
The global video game market reached $196 billion in 2023 and is projected to grow at an annual rate of approximately 6% through 2028.
Engagement in immersive, cross-platform ecosystems is highly lucrative, as players spend up to five times more per hour when participating in multiple activities rather than gaming alone.
Mobile game titles face an 80% failure rate after three years, necessitating rigorous A/B testing, targeted performance marketing, and tight alignment between development and finance teams.
Market Analysis
Player Behavior
Monetization
+1
Bain & Company
Jan 2024
Report
47 pages
The Xsolla Report: State of Play (Autumn 2024 Edition)
Mobile gaming is the dominant global segment, generating $98.7 billion in 2024, with $65 billion of that revenue originating from Asian markets.
A small 'whale' cohort comprising 2% to 6% of the player base accounts for 95% of all in-app spending.
Direct-to-consumer (D2C) web shops are highly effective, with 81% of players aware of them and 77% having completed at least one purchase.
Market Analysis
Player Behavior
Mobile
+1
Xsolla
Jan 2024
Report
35 pages
How Consumers Engage with Games Today: Newzoo’s Global Gamer Study 2024
Gen Z and Gen Alpha players spend an average of 5.2 hours per week gaming, surpassing their time spent on social media.
Approximately 22% of Gen Z players spend $25 or more monthly on games, showing a strong preference for upfront payments compared to the free-to-play model favored by mobile gamers.
One-third of PC/console gamers are 'new game seekers' who spend 7–8 hours weekly across multiple platforms and consistently invest over $25 monthly.
Market Analysis
Player Behavior
Monetization
+1
Newzoo
Jan 2024
Report
9 pages
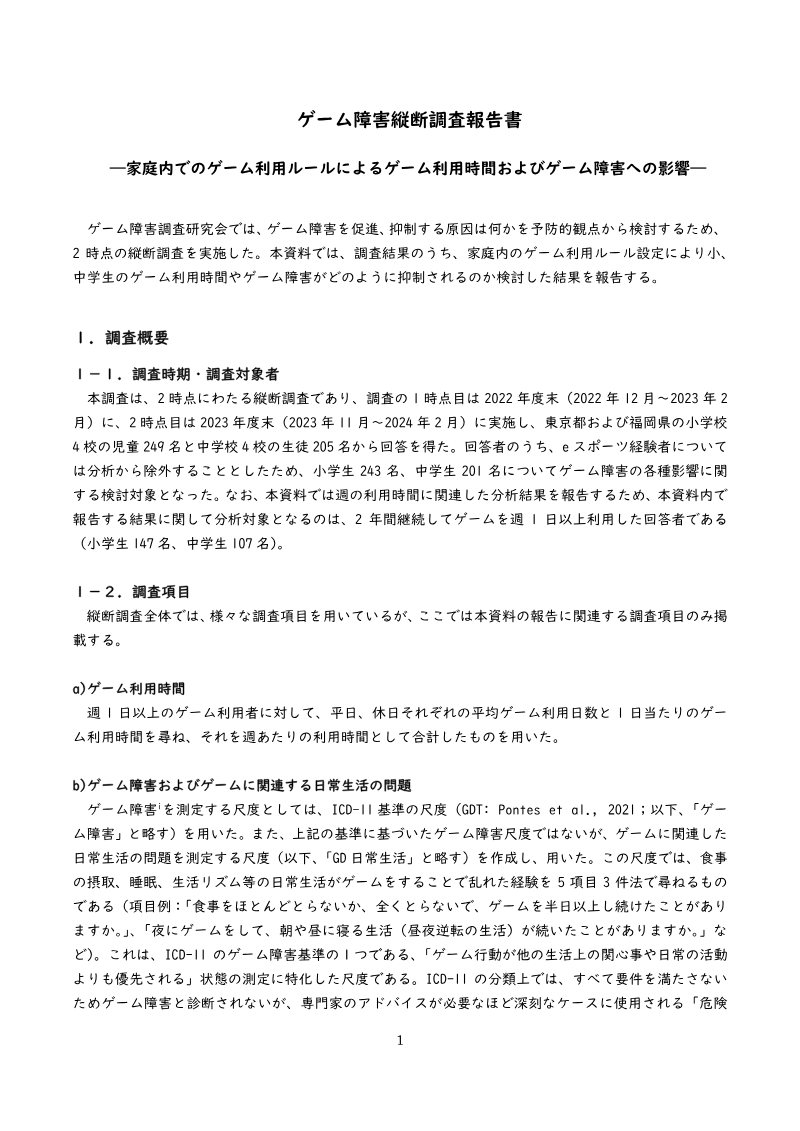
Longitudinal Survey Report on Gaming Disorder: Japan
Increased weekly gaming hours serve as a significant predictor for higher gaming disorder scores, with standardized coefficients of .12 for elementary students and .11 for middle-school students.
Gaming hours and daily-life problems, such as disruptions to sleep and meals, create a negative feedback loop where each factor mutually reinforces the other.
Gaming disorder symptoms do not appear to influence or increase future weekly play time, suggesting that excessive play is the primary driver of disorder rather than a consequence of it.
Player Behavior
Player Demographics
Japan
+1
CESA – Computer Entertainment Supplier's Association
Jan 2024
Report
10 pages
Toxicity and the Bottom Line: The Impact of Hate and Harassment on Player Retention and In-Game Purchases
Toxicity directly suppresses revenue, as 19% of players spend less money and 21% reduce their overall playtime to avoid harassment.
Safety is a critical player priority, with 75% of the 2,408 surveyed gamers identifying protection from hate and harassment as a high priority.
Harassment causes significant engagement loss, with 44% of players disabling voice chat, 31% abandoning active matches, and 27% leaving lobbies to avoid abuse.
Monetization
Player Behavior
Diversity & Inclusion
+2
Take This
Jan 2024
Report
53 pages
The Xsolla Report: State of Play – Summer Edition 2024
Indie games now account for 31% of total Steam earnings, with their U.S. market share on PC and console platforms rising from 13% in 2021 to 18% in 2024.
Marketing spend for the indie sector is projected to triple to $24 billion by 2024, with influencer partnerships on YouTube, TikTok, and Instagram serving as the primary drivers of discovery.
Indie titles are outperforming AAA games in quality perception, maintaining an average Steam rating of approximately 72%.
Market Forecast
Player Behavior
Global
+1
Xsolla
Jan 2024
Whitepaper
127 pages
Guide to Game Literacy: Improving Understanding of Games
Parental involvement is a critical determinant of healthy gaming habits, as 78.5% of adaptive gamers have informed parents compared to only 60.2% of those classified as problematic.
The UK gaming market is projected to grow from £4 billion in 2022 to £10 billion by 2030, with the national gamer population expected to reach 38.5 million by 2025.
A 2023 Korean survey indicates that 86% of adolescents play video games, with the user base segmented into 71% general users, 12% adaptive users, and 3% problematic users.
Player Behavior
Game Design
South Korea
K-GAMES – Korea Association of Game Industry
Jan 2024
Report
2 pages
The Power of Play: España
Gaming is primarily used for emotional regulation in Spain, with 78% of men and 75% of women reporting that it effectively reduces stress and anxiety.
Social connection is a major driver for the Spanish gaming population, with 62% of men and 55% of women citing it as a primary motivation for play.
Online multiplayer engagement is significantly higher among men, with approximately 80% reporting they play with others online, whereas women show a stronger preference for solo play.
Player Behavior
Europe
Global
+3
AEVI
Jan 2024
Report
17 pages
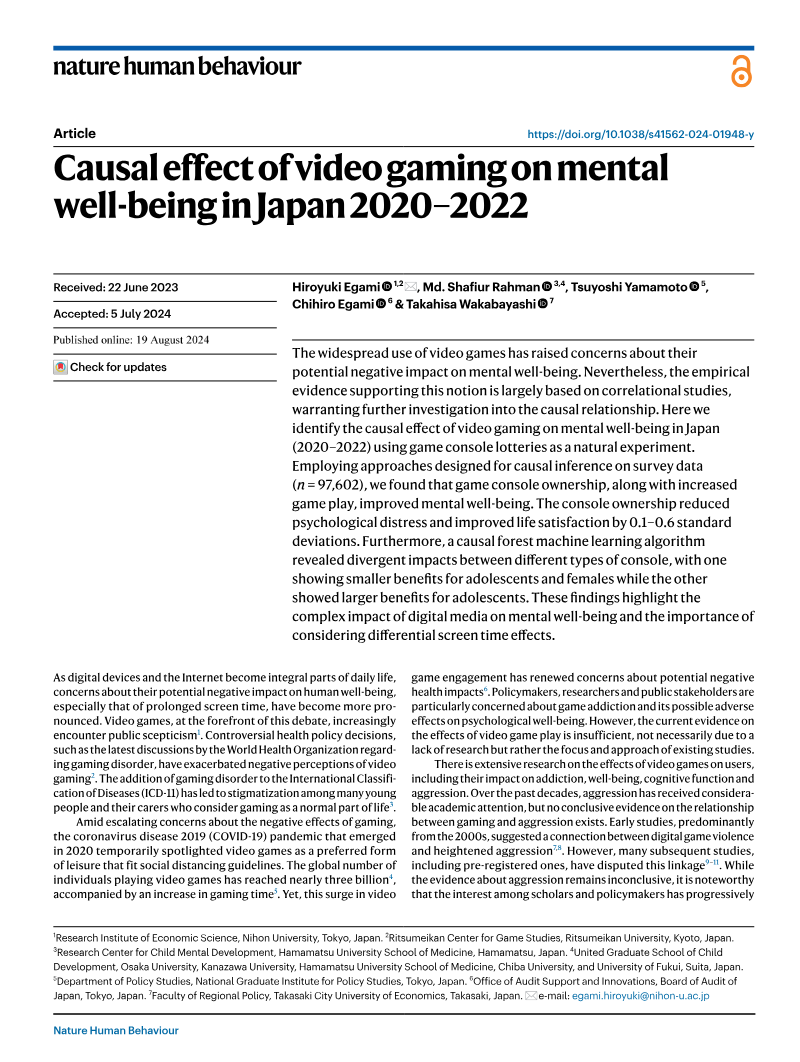
Causal Effect of Video Gaming on Mental Well-Being in Japan 2020–2022
Winning a gaming console lottery during the 2020–2022 Japanese supply shortages reduced psychological distress by 0.1 to 0.6 standard deviations, establishing a positive causal link between gaming and mental well-being.
The positive impact of video games on mental health and life satisfaction follows a threshold effect, with benefits beginning to decline after three hours of daily play.
Nintendo Switch ownership provides the most pronounced well-being improvements for adolescents and female users, while the PlayStation 5 yields stronger benefits for adult males and dedicated gamers.
Player Behavior
Japan
Springer Science and Business Media LLC
Jan 2024
Report
32 pages
Gaming Report 2024: Meet the Moment
The global video game market reached a $196 billion valuation in 2023 and is projected to grow at an annual rate of 6% through 2028.
Industry growth is driven by younger demographics treating gaming environments as primary hubs for social interaction, commerce, and creative expression.
Market leaders must transition from siloed development to immersive, cross-platform ecosystems that prioritize interoperability and user-generated content.
Market Analysis
Player Behavior
Global
+2
Bain & Company
Jan 2024
Report
5 pages
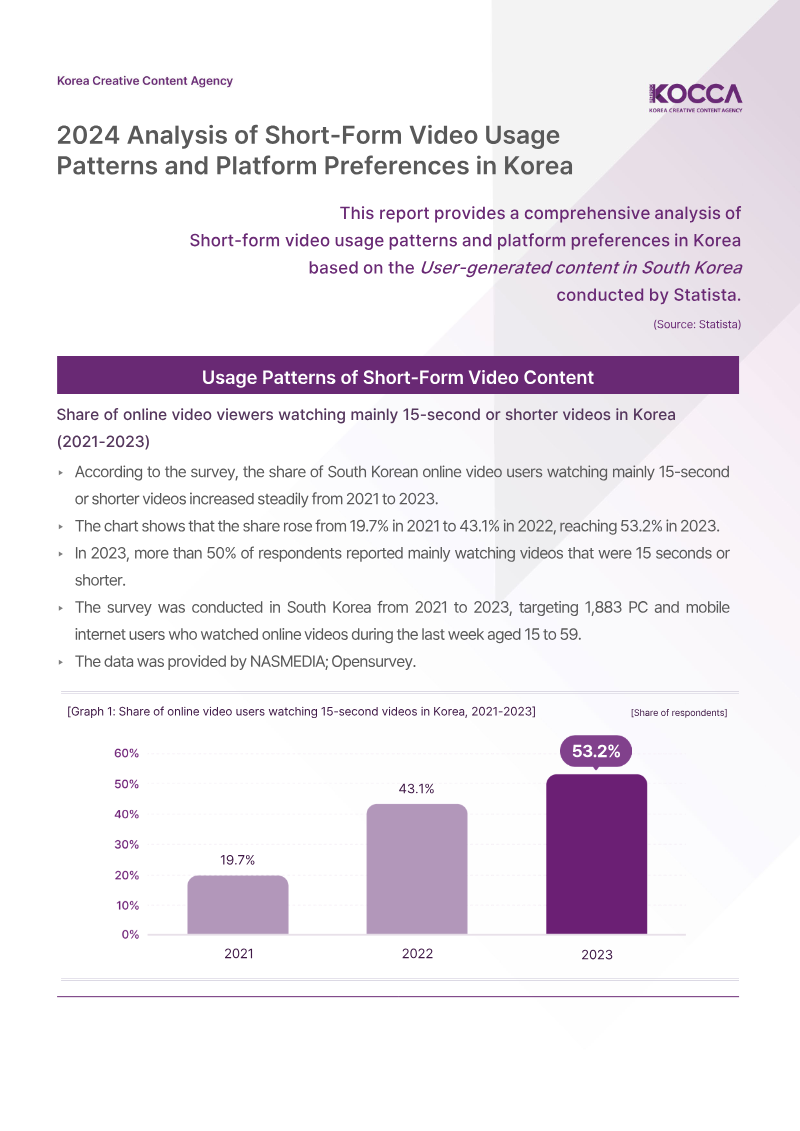
2024 Analysis of Short-Form Video Usage Patterns and Platform Preferences in Korea
Consumer preference for ultra-short videos (15 seconds or less) in South Korea surged from 19.7% in 2021 to 53.2% in 2023.
TikTok leads in engagement volume, with users watching an average of 15.4 short videos per session, compared to 11 on YouTube Shorts and 10.6 on Instagram Reels.
Humor and gag content is the primary driver for both YouTube Shorts (48.2%) and TikTok (40.5%).
Market Analysis
Player Behavior
South Korea
+1
KOCCA – Korea Creative Content Agency
Jan 2024
Previous
1
…
3
4
5
…
9
Next